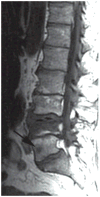
Dynamic contrast-enhanced magnetic resonance imaging of osseous spine metastasis before and 1 hour after high-dose image-guided radiation therapy
- PMID: 28041318
- PMCID: PMC5530364
- DOI: 10.3171/2016.9.FOCUS16378
Dynamic contrast-enhanced magnetic resonance imaging of osseous spine metastasis before and 1 hour after high-dose image-guided radiation therapy
Abstract
OBJECTIVE High-dose image-guided radiation therapy (HD IGRT) has been instrumental in mitigating some limitations of conventional RT. The recent emergence of dynamic contrast-enhanced (DCE) MRI to investigate tumor physiology can be used to verify the response of human tumors to HD IGRT. The purpose of this study was to evaluate the near-immediate effects of HD IGRT on spine metastases through the use of DCE MRI perfusion studies. METHODS Six patients with spine metastases from prostate, thyroid, and renal cell carcinoma who underwent HD IGRT were studied using DCE MRI prior to and 1 hour after HD IGRT. The DCE perfusion parameters plasma volume (Vp) and vascular permeability (Ktrans) were measured to assess the near-immediate and long-term tumor response. A Mann-Whitney U-test was performed to compare significant changes (at p ≤ 0.05) in perfusion parameters before and after RT. RESULTS The authors observed a precipitous drop in Vp within 1 hour of HD IGRT, with a mean decrease of 65.2%. A significant difference was found between Vp values for before and 1 hour after RT (p ≤ 0.05). No significant change was seen in Vp (p = 0.31) and Ktrans (p = 0.1) from 1 hour after RT to the first follow-up. CONCLUSIONS The data suggest that there is an immediate effect of HD IGRT on the vascularity of spine metastases, as demonstrated by a precipitous decrease in Vp. The DCE MRI studies can detect such changes within 1 hour after RT, and findings are concordant with existing animal models.
Keywords: AIF = arterial input function; ASMase = acid sphingomyelinase; DCE = dynamic contrast-enhanced; FA = flip angle; FOV = field of view; HD IGRT = high-dose image-guided radiation therapy; Ktrans = vascular permeability; ROI = region of interest; Vp = plasma volume; dynamic contrast-enhanced MRI; high-dose image-guided radiation therapy; spine tumor response.
Figures


Similar articles
-
Dynamic contrast-enhanced magnetic resonance imaging measurements in renal cell carcinoma: effect of region of interest size and positioning on interobserver and intraobserver variability.Invest Radiol. 2015 Jan;50(1):57-66. doi: 10.1097/RLI.0000000000000096. Invest Radiol. 2015. PMID: 25260094
-
Measurement of blood perfusion in spinal metastases with dynamic contrast-enhanced magnetic resonance imaging: evaluation of tumor response to radiation therapy.Spine (Phila Pa 1976). 2013 Oct 15;38(22):E1418-24. doi: 10.1097/BRS.0b013e3182a40838. Spine (Phila Pa 1976). 2013. PMID: 23873238 Free PMC article.
-
Reproducibility of the aortic input function (AIF) derived from dynamic contrast-enhanced magnetic resonance imaging (DCE-MRI) of the kidneys in a volunteer study.Eur J Radiol. 2009 Sep;71(3):576-81. doi: 10.1016/j.ejrad.2008.09.025. Epub 2008 Nov 11. Eur J Radiol. 2009. PMID: 19004588
-
Dynamic contrast-enhanced magnetic resonance imaging for assessing tumor vascularity and vascular effects of targeted therapies in renal cell carcinoma.Clin Cancer Res. 2007 Jan 15;13(2 Pt 2):770s-776s. doi: 10.1158/1078-0432.CCR-06-1921. Clin Cancer Res. 2007. PMID: 17255308 Review.
-
Dynamic contrast-enhanced magnetic resonance imaging in oncology.Top Magn Reson Imaging. 2001 Aug;12(4):301-8. doi: 10.1097/00002142-200108000-00006. Top Magn Reson Imaging. 2001. PMID: 11687716 Review.
Cited by
-
T1-weighted Dynamic Contrast-enhanced MRI to Differentiate Nonneoplastic and Malignant Vertebral Body Lesions in the Spine.Radiology. 2020 Nov;297(2):382-389. doi: 10.1148/radiol.2020190553. Epub 2020 Sep 1. Radiology. 2020. PMID: 32870135 Free PMC article.
-
Intravoxel Incoherent Motion Imaging on Sacroiliitis in Patients With Axial Spondyloarthritis: Correlation With Perfusion Characteristics Based on Dynamic Contrast-Enhanced Magnetic Resonance Imaging.Front Med (Lausanne). 2022 Jan 26;8:798845. doi: 10.3389/fmed.2021.798845. eCollection 2021. Front Med (Lausanne). 2022. PMID: 35155474 Free PMC article.
-
Delay of Aortic Arterial Input Function Time Improves Detection of Malignant Vertebral Body Lesions on Dynamic Contrast-Enhanced MRI Perfusion.Cancers (Basel). 2023 Apr 18;15(8):2353. doi: 10.3390/cancers15082353. Cancers (Basel). 2023. PMID: 37190282 Free PMC article.
-
T1-Weighted, Dynamic Contrast-Enhanced MR Perfusion Imaging Can Differentiate between Treatment Success and Failure in Spine Metastases Undergoing Radiation Therapy.AJNR Am J Neuroradiol. 2023 Dec 11;44(12):1451-1457. doi: 10.3174/ajnr.A8057. AJNR Am J Neuroradiol. 2023. PMID: 38049990 Free PMC article.
-
Dynamic contrast-enhanced magnetic resonance imaging parameter changes as an early biomarker of tumor responses following radiation therapy in patients with spinal metastases: a systematic review.Radiat Oncol J. 2023 Dec;41(4):225-236. doi: 10.3857/roj.2023.00290. Epub 2023 Oct 27. Radiat Oncol J. 2023. PMID: 38185927 Free PMC article.
References
-
- Cosgrove VP, Jahn U, Pfaender M, Bauer S, Budach V, Wurm RE. Commissioning of a micro multi-leaf collimator and planning system for stereotactic radiosurgery. Radiother Oncol. 1999;50:325–336. - PubMed
-
- Fuks Z, Kolesnick R. Engaging the vascular component of the tumor response. Cancer Cell. 2005;8:8991. - PubMed
-
- Garcia-Barros M, Paris F, Cordon-Car–o C, Lyden D, Rafii S, Haimovitz-Friedman A, et al. Tumor response to radiotherapy regulated by endothelial cell apoptosis. Science. 2003;300:1155–1159. - PubMed
MeSH terms
Substances
Grants and funding
LinkOut - more resources
Full Text Sources
Other Literature Sources
Medical

