Comparative Study
. 2017 Jan 23;35(4):639-646.
doi: 10.1016/j.vaccine.2016.12.008. Epub 2016 Dec 29.

Unique cellular and humoral immunogenicity profiles generated by aerosol, intranasal, or parenteral vaccination in rhesus macaques

Affiliations
Comparative Study

Unique cellular and humoral immunogenicity profiles generated by aerosol, intranasal, or parenteral vaccination in rhesus macaques

Diane L Bolton et al. Vaccine. .

Abstract

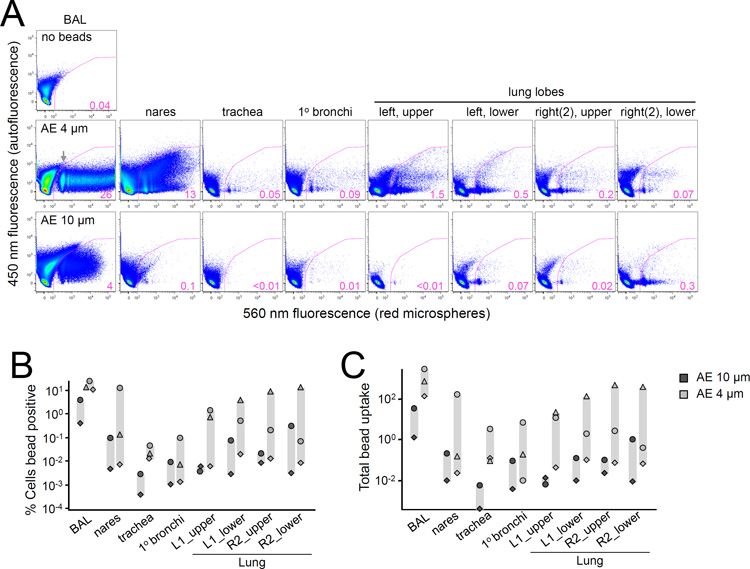
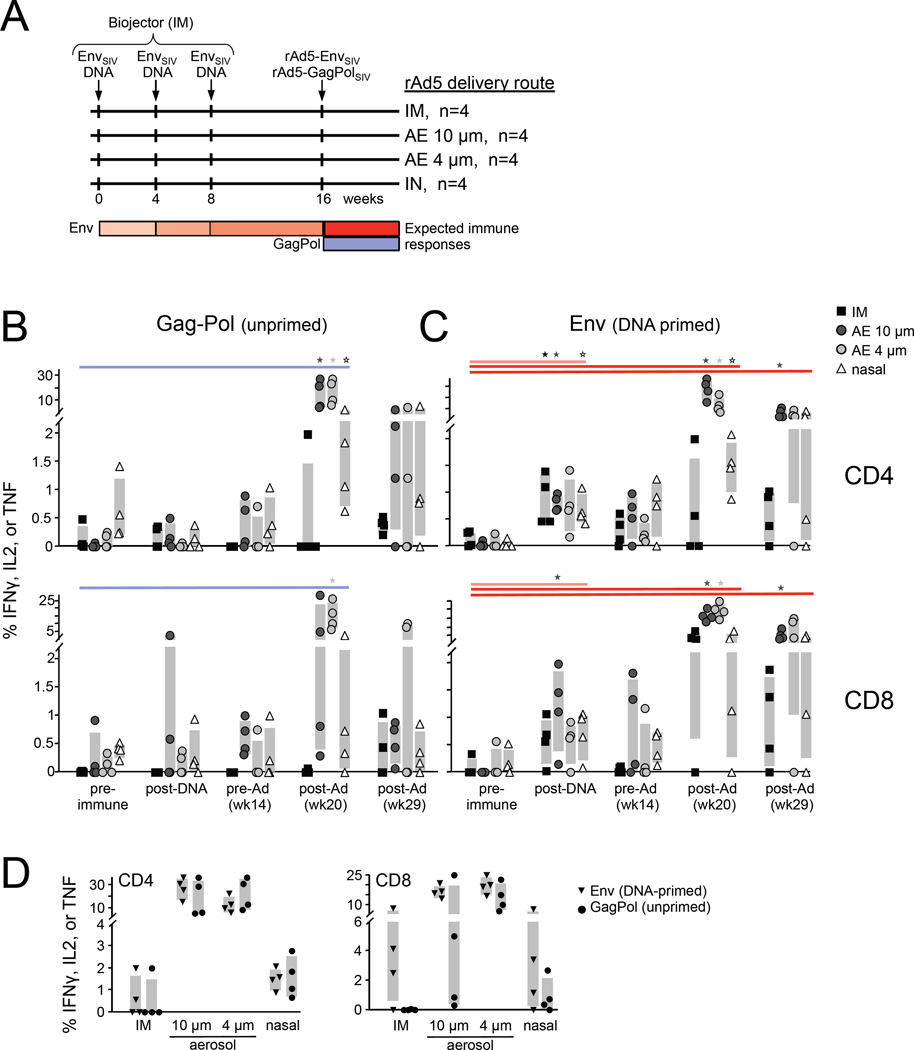
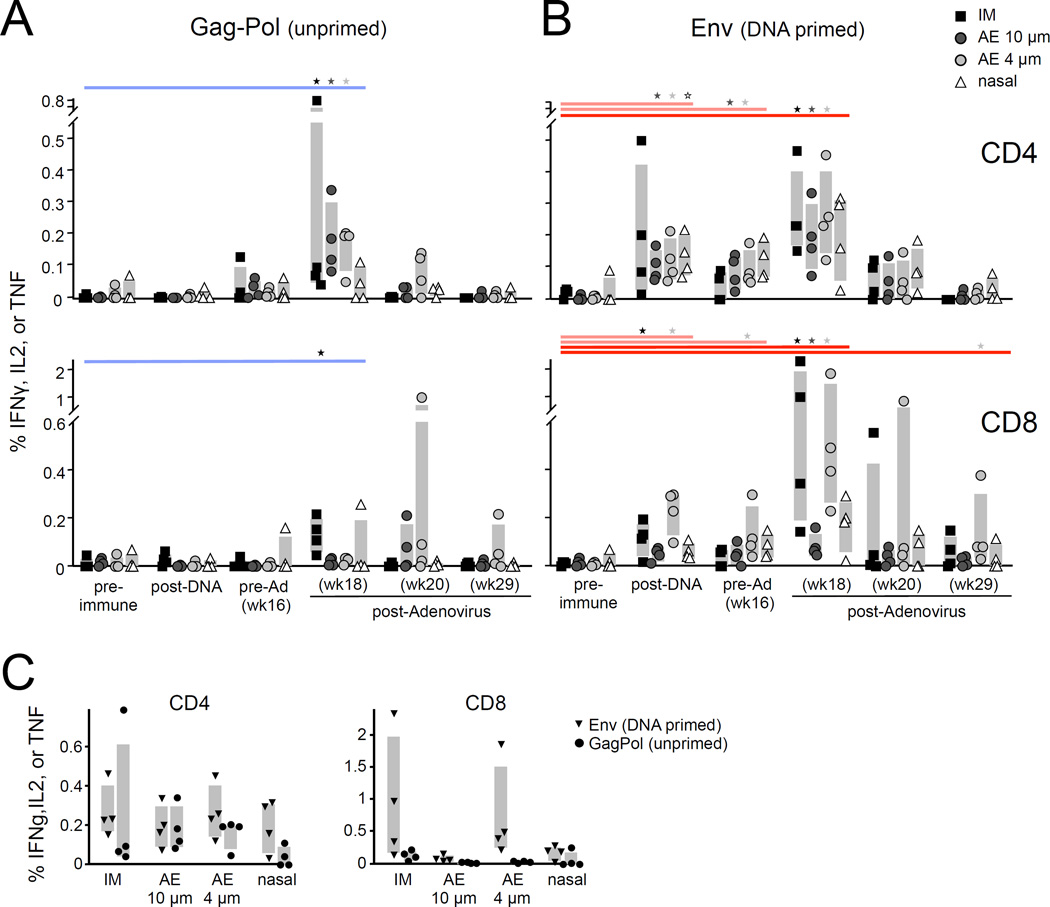
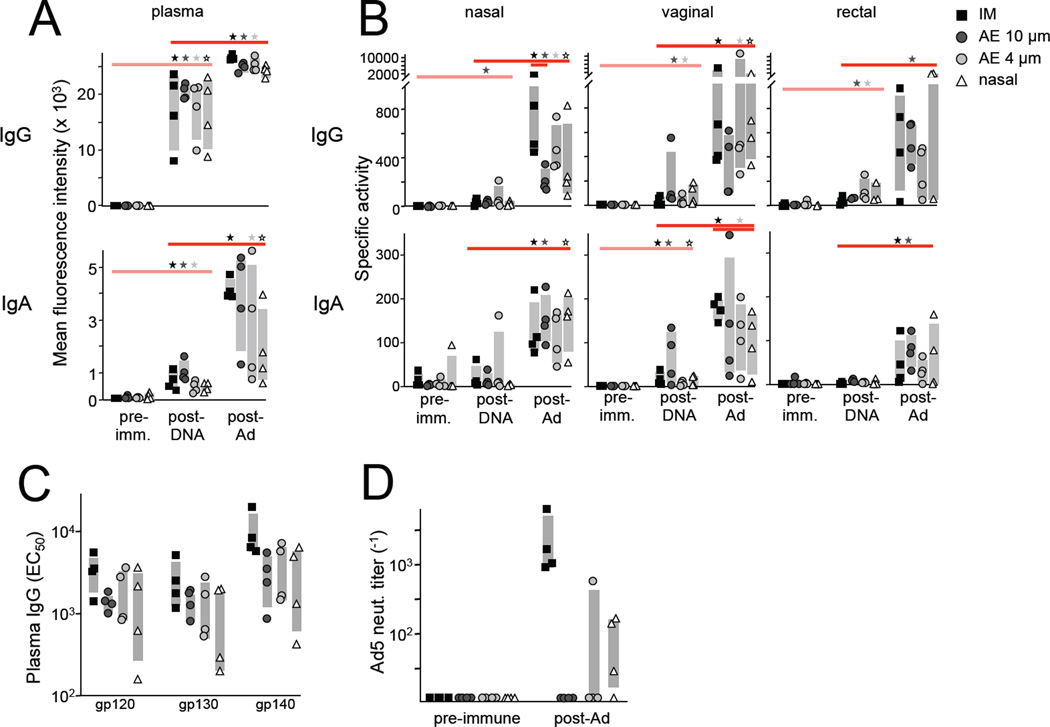
Respiratory mucosa immunization is capable of eliciting both local and distal mucosal immune responses; it is a potentially powerful yet largely unused modality for vaccination against respiratory diseases. Targeting the lower versus upper airways by aerosol delivery alters the immunogenicity profile of a vaccine, although the full extent of this impact is not well characterized. We set out to define the cellular and humoral response profiles elicited by immunization via intranasal, small aerosol droplets, and large aerosol droplets. We compared responses following adenovirus-vectored vaccination by these routes in macaques, either for the generation of primary immune responses or for the boosting of previously primed systemic responses. Aerosol delivery (4 or 10μm diameter droplets, addressing lower or upper airways, respectively) generated the highest magnitude lung CD4 and CD8 T-cell responses, reaching 10-30% vaccine-specific levels in bronchoalveolar lavage cells. In contrast, intranasal delivery was less immunogenic with >10-fold lower peak lung T-cell responses. Systemic (blood) T-cell responses were only observed following 4μm aerosol (and parenteral) immunization, while all delivery routes elicited similar humoral responses. These data demonstrate distinct immune response profiles with each respiratory tract vaccination modality and suggest that small droplet aerosol offers several immunological advantages over other respiratory routes.

Keywords: Aerosol; Immunogenicity; Nasal; Rhesus macaque; Vaccine delivery route.


Conflict of interest statement

Conflict of Interest. The authors declare no conflict of interest.

Figures

Figure 1
Figure 1
Differential uptake of aerosolized micro-beads with 4 and 10 µm aerosol droplets. Macaques received fluorescent particles by either 4 or 10 µm nebulizers and were sacrificed 18h later for bead uptake in respiratory tract tissues. (A) Flow cytometric analysis of ungated single cells isolated from the indicated tissue is shown for two representative animals; 4µm (middle), 10µm (bottom), and negative control BAL from an unexposed animal (top). Cellular uptake of red fluorescent microspheres is depicted by the gated population, with percent positive indicated. Fluorescence at 450 nm is plotted as a negative control, although some spill over or increased autofluorescence is observed at this wavelength. Gray arrow indicates cell population containing a single microsphere. (B) The percentage of cells positive for fluorescent microspheres by flow cytometric analysis is plotted for five animals (n=3, AE 4µm; n=2, AE 10µm) across the indicated tissues. Symbols represent individual animals. (C) Total microsphere uptake is plotted as in (B). Uptake was calculated as follows: (fraction cells containing ≥1 microsphere×mean G560 fluorescence of all positive cells) / (mean G560 fluorescence of cells containing one microsphere).
Figure 2
Figure 2
Airway mucosal T-cell response magnitude. (A) Experimental vaccination scheme. Sixteen rhesus macaques were immunized with three DNA primes encoding Env at one-month intervals. Eight weeks after the last DNA prime, a mixture of two rAd5 viruses encoding Env and GagPol immunogens was administered IN, IM, AE 4µm, or AE 10µm (n=4 per group). Antigen-specific T-cells were measured throughout the vaccination regimen in BAL by in vitro peptide stimulation and intracellular Th1 cytokine staining and flow cytometric quantitation. Unprimed GagPol-specific (B) and DNA-primed Env-specific (C) CD4+ (top) and CD8+ (bottom) T-cell responses are shown for each vaccination group at the indicated time point. Statistically significant (p<0.05, Wilcoxon rank-sum test) responses relative to the pre-immune measurement for each vaccine group are indicated. (D) Direct comparison of DNA-primed and unprimed BAL responses four weeks after rAd5 vaccination (week 20) is shown.
Figure 3
Figure 3
Systemic T-cell response magnitude. Antigen-specific T-cell responses in PBMC were measured and plotted as in Figure 2. The unprimed GagPol-specific (A) and DNA-primed Env-specific (B) PBMC responses are shown. Statistically significant (p<0.05, Wilcoxon rank-sum test) responses relative to the pre-immune measurement for each vaccine group are indicated. (C) DNA-primed and unprimed PBMC responses are compared directly at peak (two weeks after rAd5, or week 18).
Figure 4
Figure 4
Systemic and mucosal humoral responses. (A–B) Env- and Gag-specific antibodies were measured in plasma and mucosal (nasal, vaginal, rectal) secretions by Luminex. (A) gp120-specific plasma IgG (top) and IgA (bottom) are plotted for each animal as mean fluorescence intensity (MFI). Statistically significant (p<0.05) responses relative to the post-DNA measurement for each vaccine group are indicated along the top (Wilcoxon rank-sum test). “Post-DNA” and “post-Ad” refer to study week 14 (6 weeks post-DNA) and 20 (4 weeks post Ad), respectively. Gray bars reflect the interquartile range for each group. (B) Nasal, vaginal, and rectal IgG (top) and IgA (bottom) are plotted as specific activity (binding units / total Ig (µg/ml), where binding units = MFI*dilution). Between group comparisons within a time point are indicated by lines spanning group with significantly different responses. (C) Week 20 plasma IgG EC50 values for the indicated Env antigens were determined using a 4 parameter logistic curve fit model. (D) The plasma 90% adenovirus neutralizing titer was determined for each animal before and 4 weeks after the rAd5 immunization and plotted as the reciprocal dilution.

References

    1. Holmgren J, Czerkinsky C. Mucosal immunity and vaccines. Nature medicine. 2005;11:S45–S53. - PubMed
    1. Johansson EL, Wassen L, Holmgren J, Jertborn M, Rudin A. Nasal and vaginal vaccinations have differential effects on antibody responses in vaginal and cervical secretions in humans. Infection and immunity. 2001;69:7481–7486. - PMC - PubMed
    1. Nardelli-Haefliger D, Lurati F, Wirthner D, Spertini F, Schiller JT, Lowy DR, et al. Immune responses induced by lower airway mucosal immunisation with a human papillomavirus type 16 virus-like particle vaccine. Vaccine. 2005;23:3634–3641. - PubMed
    1. Balmelli C, Roden R, Potts A, Schiller J, De Grandi P, Nardelli-Haefliger D. Nasal immunization of mice with human papillomavirus type 16 virus-like particles elicits neutralizing antibodies in mucosal secretions. Journal of virology. 1998;72:8220–8229. - PMC - PubMed
    1. Revaz S, Dudler J. [Clinical manifestations of gout] Revue medicale suisse. 2007;3:728–730. - PubMed

Publication types