. 2017 Jan 12;168(1-2):239-251.e16.
doi: 10.1016/j.cell.2016.11.059. Epub 2016 Dec 29.

Lipid-Sorting Specificity Encoded in K-Ras Membrane Anchor Regulates Signal Output

Affiliations

Lipid-Sorting Specificity Encoded in K-Ras Membrane Anchor Regulates Signal Output

Yong Zhou et al. Cell. .

Abstract

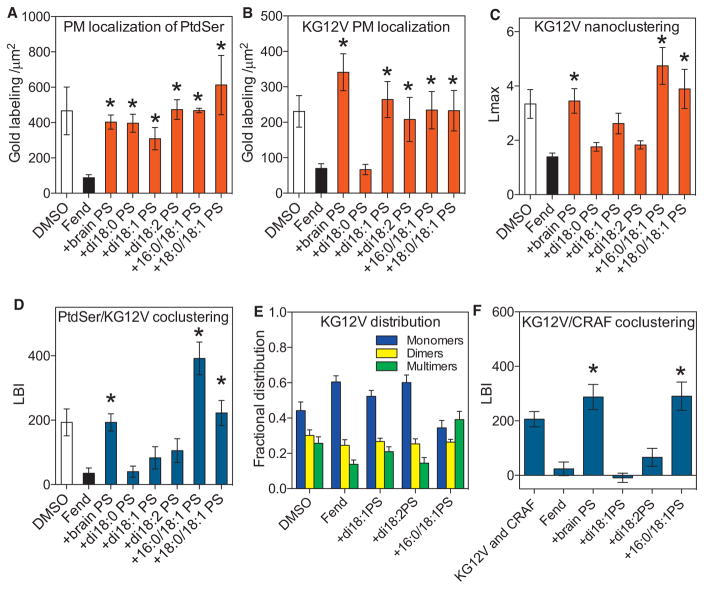
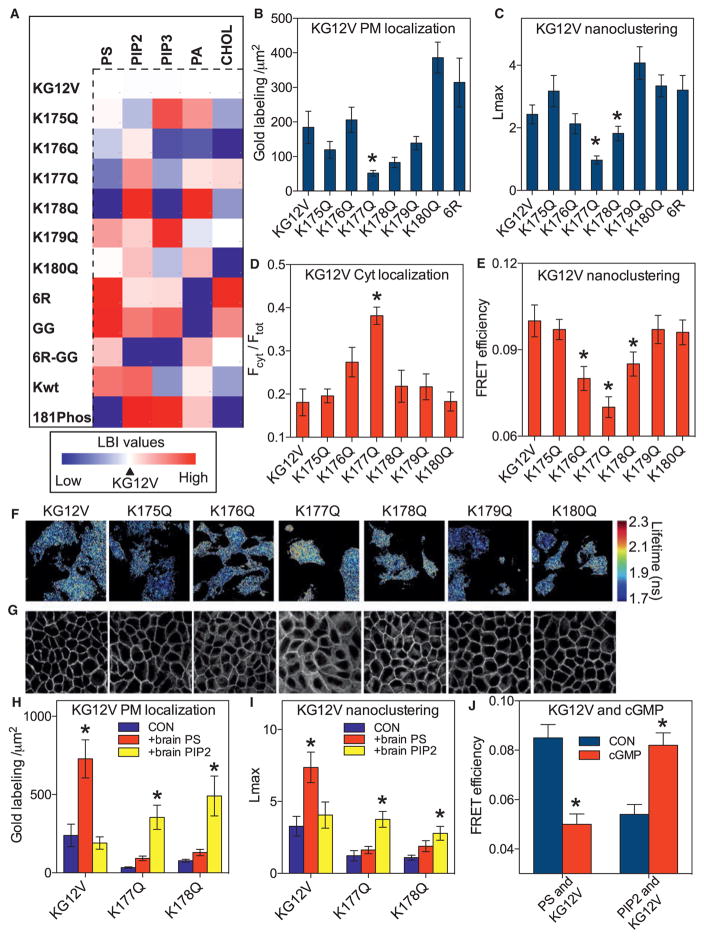
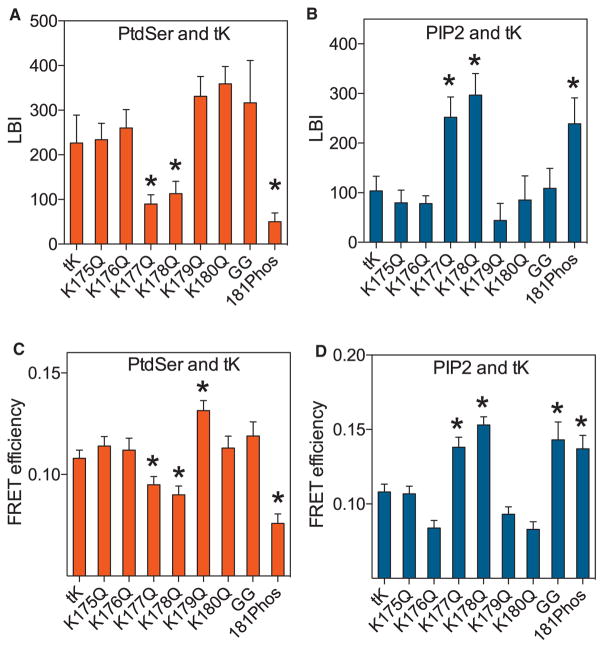
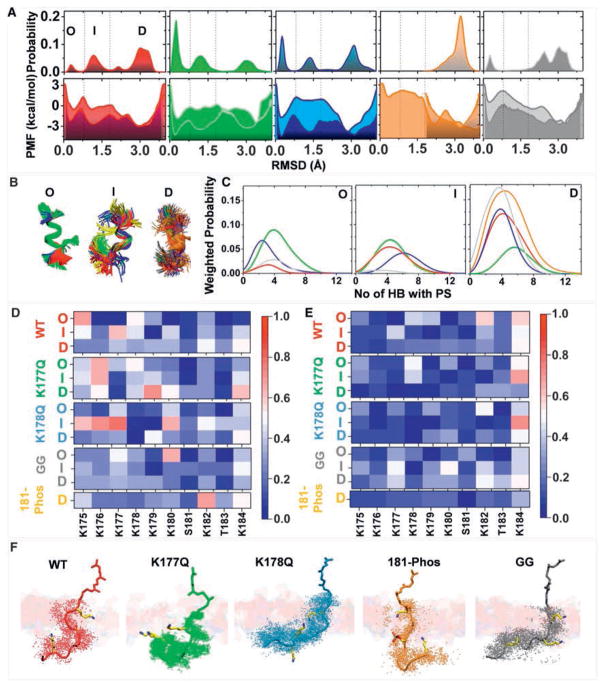
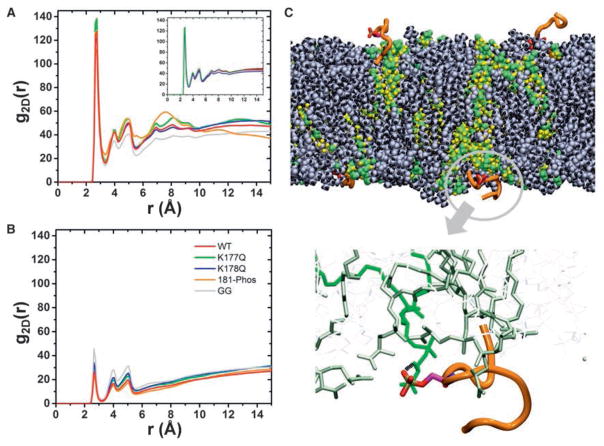
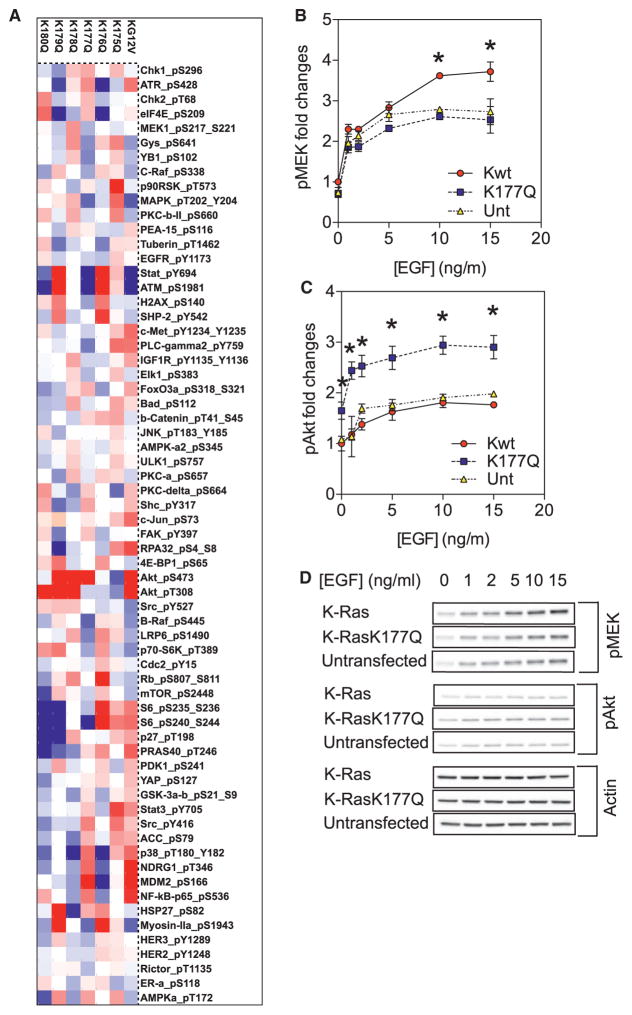
K-Ras is targeted to the plasma membrane by a C-terminal membrane anchor that comprises a farnesyl-cysteine-methyl-ester and a polybasic domain. We used quantitative spatial imaging and atomistic molecular dynamics simulations to examine molecular details of K-Ras plasma membrane binding. We found that the K-Ras anchor binds selected plasma membrane anionic lipids with defined head groups and lipid side chains. The precise amino acid sequence and prenyl group define a combinatorial code for lipid binding that extends beyond simple electrostatics; within this code lysine and arginine residues are non-equivalent and prenyl chain length modifies nascent polybasic domain lipid preferences. The code is realized by distinct dynamic tertiary structures of the anchor on the plasma membrane that govern amino acid side-chain-lipid interactions. An important consequence of this specificity is the ability of such anchors when aggregated to sort subsets of phospholipids into nanoclusters with defined lipid compositions that determine K-Ras signaling output.

Keywords: K-RAS; electron microscopy; molecular dynamics; nanoclustering; phosphatidylserine; polybasic domain.


Figures

Figure 1
Figure 1. K-Ras Interacts with Selected Species of PtdSer
(A and B) BHK cells stably expressing the PtdSer probe GFP-LactC2 (A) or GFP-K-RasG12V (B) were treated with vehicle (DMSO) or 10 μM fendiline (Fend) for 24 hr before incubation with exogenous PtdSer lipids for 1 hr. Intact PM sheets were fixed, labeled with 4.5 nm gold-anti-GFP, and imaged by EM. PtdSer and K-RasG12V content, respectively, of the inner PM leaflet is quantified as the number of gold particles per 1 μm2 and shown as mean ± SEM (n ≥ 15 for each condition). Significant differences between fendiline-treated cells with and without PtdSer add-back were evaluated by one-way ANOVA (*p < 0.05). (C) The gold point patterns from (B) were analyzed with univariate K-functions expressed as L(r)-r. The extent of GFP-K-RasG12V nanoclustering is quantified by the peak value Lmax of the L(r)-r curve (Figure S1). The results are mean ± SEM (n ≥ 15 for each condition). Statistical significance of differences between fendiline-treated cells with and without PtdSer add-back were evaluated in bootstrap tests (*p < 0.05). (D) BHK cells co-expressing GFP-LactC2 and RFP-K-RasG12V were treated with vehicle (DMSO) or 10 μM fendiline for 24 hr and incubated with exogenous PtdSer for 1 hr. Intact PM sheets were labeled with 6 nm gold-anti-GFP and 2 nm gold-anti-RFP and imaged by EM. Co-localization of the two populations of gold particles and hence of LactC2 (PtdSer) and K-RasG12V was analyzed by integrated bivariate K-functions (= LBI) (Figure S1). Statistical significance of differences between fendiline-treated cells with and without PtdSer add-back were evaluated in bootstrap tests (*p < 0.05). (E) A local L(r)-r analysis at r = 15 nm was used estimate to relative proportions of monomers, dimers, and higher order oligomers (nanoclusters) in the GFP-K-RasG12V gold PM point patterns in (B) and (C). Significant differences between fendiline-treated cells with and without PtdSer add-back were evaluated by one-way ANOVA (*p < 0.05). (F) BHK cells co-expressing GFP-K-RasG12V and RFP-CRAF were treated with vehicle (DMSO) or 10 μM fendiline for 24 hr before 1 hr incubation with exogenous PtdSer. PM sheets from the cells were labeled with 6 nm gold-anti-GFP and 2 nm gold-anti-RFP and imaged by EM. The extent of co-clustering between K-RasG12V and CRAF was analyzed by integrated bivariate K-functions (= LBI). The results are mean ± SEM (n ≥15 for each condition). Statistical significance between fendiline-treated cells with and without PtdSer add-back were evaluated in bootstrap tests (*p < 0.05). See also Figures S1 and S2.
Figure 2
Figure 2. The K-Ras Membrane Anchor Is a Combinatorial Code for Lipid Sorting
(A) A heatmap was constructed with EM-derived mean LBI values (n ≥15 for each condition) to quantify co-clustering between GFP-lipid-binding domains and RFP-K-RasG12V mutants. The mutants include K → Q point mutations at each lysine in the PBD (K175-K180), replacement of all lysines with arginines (6R), replacement of farnesyl with geranylgeranyl (GG). K-RasG12V phosphorylated at Ser181 (S181-Phos) and wild-type K-Ras (Kwt) were also evaluated. For each lipid, the LBI value for K-RasG12V and the cognate lipid probe was assigned as midpoint (marked in white), with lower and higher values marked in blue and red, respectively. The heatmap thus shows positive or negative deviations from the lipid content of K-RasG12V nanoclusters. For raw LBI values see Figures S3A–S3E. The LactC2 domain did not compete for PtdSer because the PM binding and nanoclustering of GFP-K-RasG12V and each PBD mutant was unaffected by RFP-LactC2 expression (Figures S3K–S3N). Co-expression of the LactC2 domain also had no effect on K-RasG12V signaling (Figures S3L and S3M). (B) PM sheets from BHK cells expressing each GFP-K-RasG12V PBD mutant were labeled with anti-GFP-4.5 nm gold and imaged by EM. Localization to the inner PM was quantified as the number of gold particles per 1 μm2 and is shown as mean ± SEM (n ≥15 for each condition). Significant differences from control were evaluated by one-way ANOVA (*p < 0.05). (C) The gold point patterns from (B) were analyzed for the extent of GFP-K-RasG12V nanoclustering as in Figure 1C. The results show mean Lmax values ± SEM (n ≥ 15 for each condition). Significant differences between control and each mutant were evaluated in bootstrap tests (*p < 0.05). (D) MDCK cells stably expressing each GFP-K-RasG12V PBD mutant were imaged by confocal microscopy. Fractional cytosolic mislocalization (mean ± SEM of >15 images) was estimated with a custom ImageJ algorithm. Statistical significance was evaluated by one-way ANOVA (*p < 0.05). (E) BHK cells co-expressing GFP-K-RasG12V and RFP-K-RasG12V PBD mutants were imaged in a FLIM microscope to measure GFP fluorescence lifetime and mean FRET efficiency ± SEM (n ≥ 50 cells for each condition) calculated. Significant differences were evaluated by one-way ANOVA (*p < 0.05). (F) Representative images of cells from (E) showing GFP fluorescence lifetime values. (G) Representative confocal images from (D). (H) Lipid add-back experiments using brain PtdSer or brain PIP2 were carried out as in Figure 1 in BHK cells expressing GFP-K-RasG12V, GFP-K-RasG12V,K177Q, or GFP-K-RasG12V,K178Q (not treated with fendiline). Inner PM leaflet localization was quantified as the number of gold particles per 1 μm2 and is shown as mean ± SEM (n ≥ 15 for each condition). Significant differences between cells with and without lipid add-back were evaluated by one-way ANOVA (*p < 0.05). (I) Gold point patterns from (H) were analyzed for the extent of nanoclustering. The results show mean Lmax values ± SEM (n ≥ 15 for each condition). Bootstrap tests were used to evaluate statistical significance of differences induced by lipid supplementation (*p < 0.001). (J) Co-localization between PtdSer (GFP-LactC2) or PIP2 (GFP-PH-PLCδ) and RFP-K-RasG12V was tested in a FLIM experiment as in (A) before and after treatment with 500 μM cGMP for 15 min to activate PKG and phosphorylate S181 in the PBD. See also Figure S3.
Figure 3
Figure 3. K-Ras Minimal Membrane Anchor Has a Similar Lipid Binding Specificity as Full-Length GTP-Bound K-RasG12V
(A and B) PM sheets of BHK cells co-expressing each RFP-tK PBD K → Q point mutant, RFP-tK-GG, or phosphorylated RFP-tK with GFP-LactC2 (A) or GFP-PH- PLCδ (B) were assayed for co-clustering using EM and bivariate analysis (n ≥ 15 for each condition) exactly as in Figure 2C to evaluate interaction with PtdSer (LactC2) and PIP2 (PH-PLCδ). (C and D) BHK cells co-expressing the same set of RFP-tK mutants with GFP-LactC2 (C) or GFP-PH-PLCδ (D) were imaged in a FLIM microscope to measure GFP fluorescence lifetime and mean FRET efficiency ± SEM (n ≥ 60 cells for each condition) calculated. Statistical significance of differences from GFP-tK was evaluated by one-way ANOVA (*p < 0.05).
Figure 4
Figure 4. Different K-Ras Anchor Variants Sample Different Backbone Conformations that Interact Differentially with Membrane
(A) Free energy profiles as a function of root-mean-square deviation (RMSD) of Cα atoms of residues 177–182 obtained after re-weighting the metaMD (lighter shade, bottom panel) and from the Boltzmann inversion of the probability distribution of the RMSD (top panel) from unbiased cMD simulations (darker shade, bottom panel). The metaMD PMF was extracted from the 2D PMFs shown in Figure S4. The three most common free energy basins demarcated by the vertical dashed lines represent distinct groups of conformations referred to as ordered O, intermediate I, and disordered D. (B) Superposition of representative backbone conformations of O, I, and D. (C) Weighted probability of the number of hydrogen bonds between protein (donor) and PtdSer (acceptor) in O, I, and D; the percentages in (A) were used for weighting as highlighted by the matching colors. Cutoffs for hydrogen bond calculation in this and the rest of the figures were donor-acceptor distance of 3.0 Å and donor-hydrogen-acceptor angle of 30°. (D and E) Heatmaps of the probability of hydrogen bonding of individual residues with PtdSer (D) and PC (E) separately for each tK-variant and each group. (F) Representative structures of bilayer-bound peptides (shown in stick model) highlighting similar membrane insertion but varied relative orientations of the backbone. For each peptide system, a snapshot was chosen based on the most probable location of K175, K180, and Far/GG185 Cα atoms relative to the bilayer center. For this analysis, we considered only the dominant conformations sampled during the simulations, which is D for all, except K177Q where it is I. The extent of the backbone conformational fluctuation is highlighted by the dots representing the instantaneous coordinates of the Cα atoms. A few selected residues with high hydrogen bonding potential are highlighted in licorice. A portion of one leaflet of the bilayer is shown in transparent slab with the membrane-penetrating farnesyl or GG moieties sticking out. Color code: tK-WT (red), tK-K177Q (green), tK-K178Q (blue), 181-Phos (orange), and tK-GG (gray); licorice presentation: carbon (yellow), nitrogen (blue), and oxygen (red). See also Figure S4.
Figure 5
Figure 5. Lipid Clustering Profile of K-Ras Anchor Variants
(A and B) Two-dimensional (2D) radial distribution function (RDF) of head group oxygen atoms of PtdSer (A) and PC (B) around nitrogen of Lys or oxygen atoms of Ser/Thr side chains of the peptides. The inset in (A) shows convergence of the RDF for WT-tK by comparing data from 500–600 ns (black), 500–700 ns (red), 500–800 ns (blue), 500–900 ns (pink), and 500–1,000 ns (green); similar results were obtained for the other peptides. (C) A snapshot of 181-Phos showing the four peptides in the simulation box (orange) and the clusters of PtdSer around each peptide (green/yellow spheres). PC lipids are shown in gray/black spheres. A bi-dentate hydrogen bond between the phosphorylated Ser and PtdSer is highlighted in the bottom panel. See also Figure S5.
Figure 6
Figure 6. K-Ras PBD Mutations Change Signal Output
(A) Lysates of BHK cells expressing equal amounts of GFP-tagged K-RasG12V (KG12V) or each K-RasG12V PBD mutant were collected after overnight serum-starvation. Reverse phase protein array (RPPA) was conducted. Relative protein levels for each sample were determined by interpolation from the standard curve of each antibody and normalized for protein loading. Raw values were converted to Log2 values. Results of phosphorylated proteins are shown as a heatmap of Log2 values centered on the 50th centile (white) and with a range of −0.3 (blue) and 0.3 (red). (B and C) MDCK cells stably expressing GFP-K-Ras or GFP-K-Ras-K177Q were serum-starved and stimulated with various doses of EGF (0–15 ng/mL). Whole cell lysates were blotted for phosphorylated MEK (B) or phosphorylated AKT (C) and quantified, the results are mean ± SEM (n = 5). In each plot, all values have been normalized against untransfected control without EGF stimulation. Significant differences between control and each mutant were evaluated by one-way ANOVA (*p < 0.05). (D) Representative blots are shown. See also Figure S6.

References

    1. Abankwa D, Hanzal-Bayer M, Ariotti N, Plowman SJ, Gorfe AA, Parton RG, McCammon JA, Hancock JF. A novel switch region regulates H-ras membrane orientation and signal output. EMBO J. 2008;27:727–735. - PMC - PubMed
    1. Abankwa D, Gorfe AA, Inder K, Hancock JF. Ras membrane orientation and nanodomain localization generate isoform diversity. Proc Natl Acad Sci USA. 2010;107:1130–1135. - PMC - PubMed
    1. Bach D, Wachtel E, Borochov N, Senisterra G, Epand RM. Phase behaviour of heteroacid phosphatidylserines and cholesterol. Chem Phys Lipids. 1992;63:105–113.
    1. Barducci A, Bonomi M, Parrinello M. Metadynamics. Wiley Interdiscip Rev Comput Mol Sci. 2011;1:14.
    1. Bivona TG, Quatela SE, Bodemann BO, Ahearn IM, Soskis MJ, Mor A, Miura J, Wiener HH, Wright L, Saba SG, et al. PKC regulates a farnesyl-electrostatic switch on K-Ras that promotes its association with Bcl-XL on mitochondria and induces apoptosis. Mol Cell. 2006;21:481–493. - PubMed

LinkOut - more resources