. 2017 Jan 12;168(1-2):295-310.e19.
doi: 10.1016/j.cell.2016.12.010. Epub 2016 Dec 29.

The Cellular and Synaptic Architecture of the Mechanosensory Dorsal Horn

Affiliations

The Cellular and Synaptic Architecture of the Mechanosensory Dorsal Horn

Victoria E Abraira et al. Cell. .

Abstract

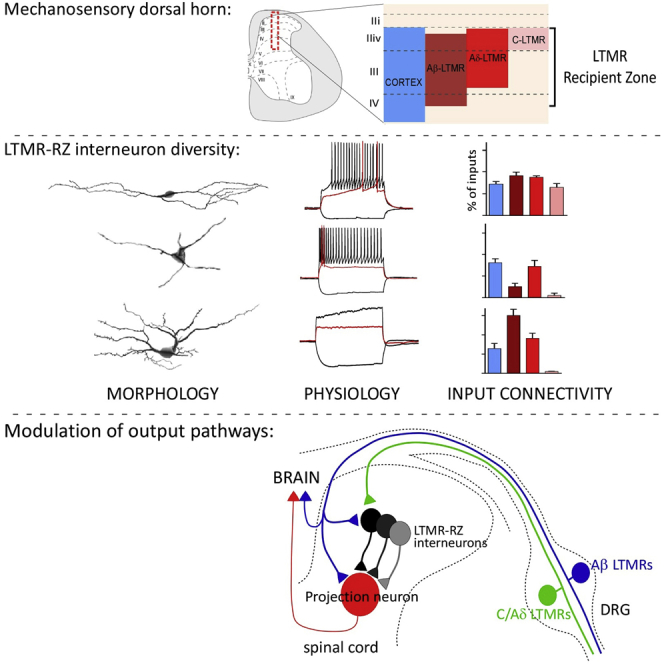
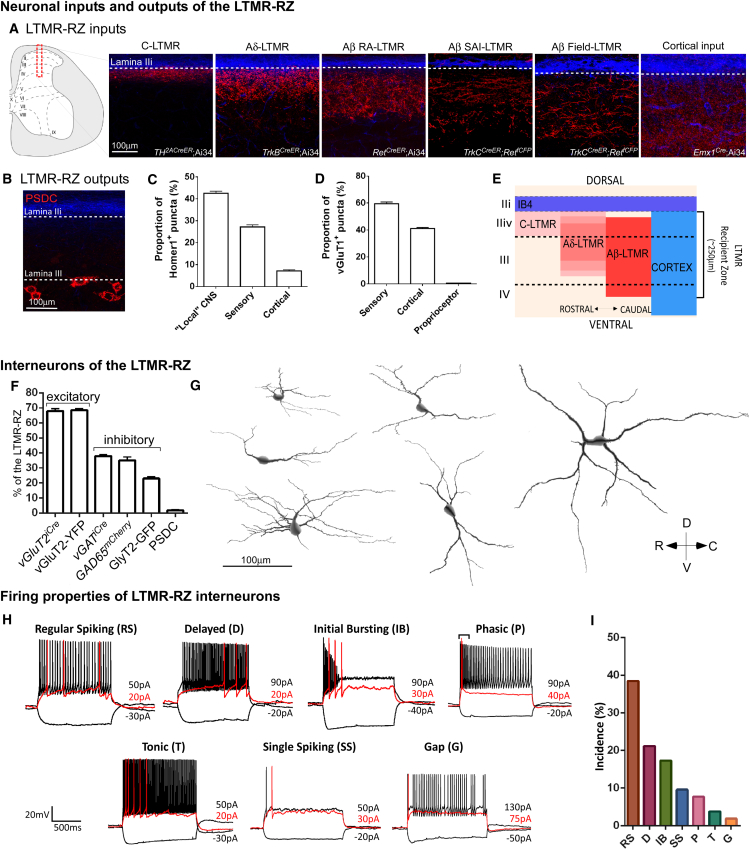
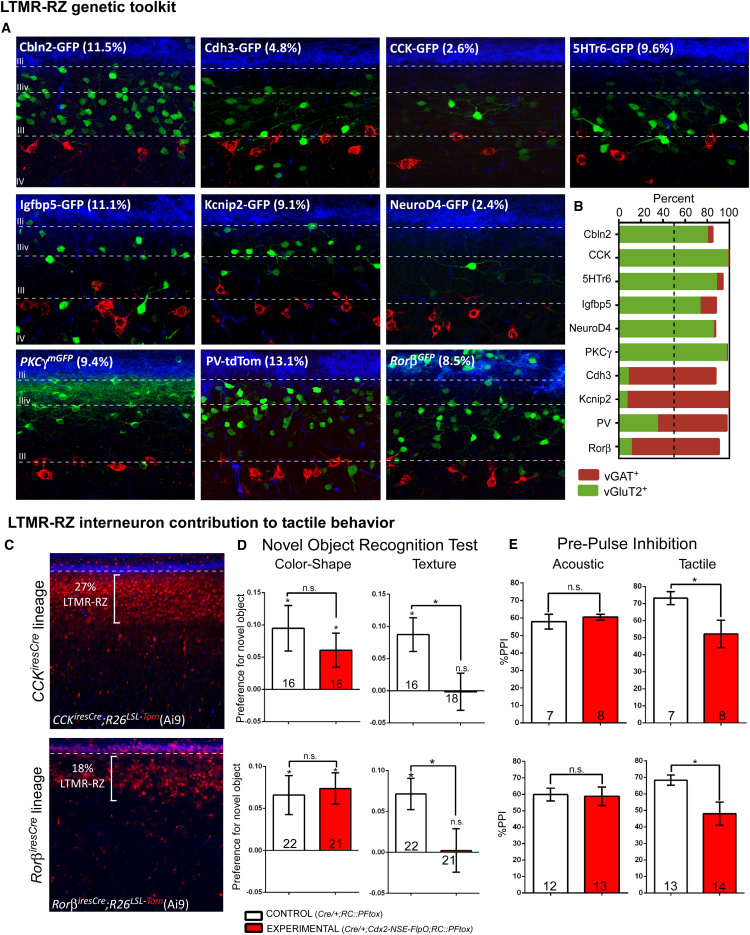
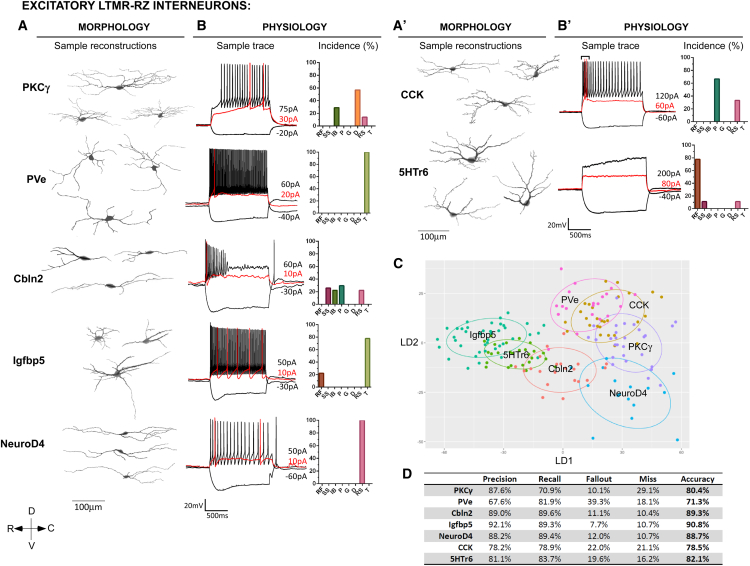
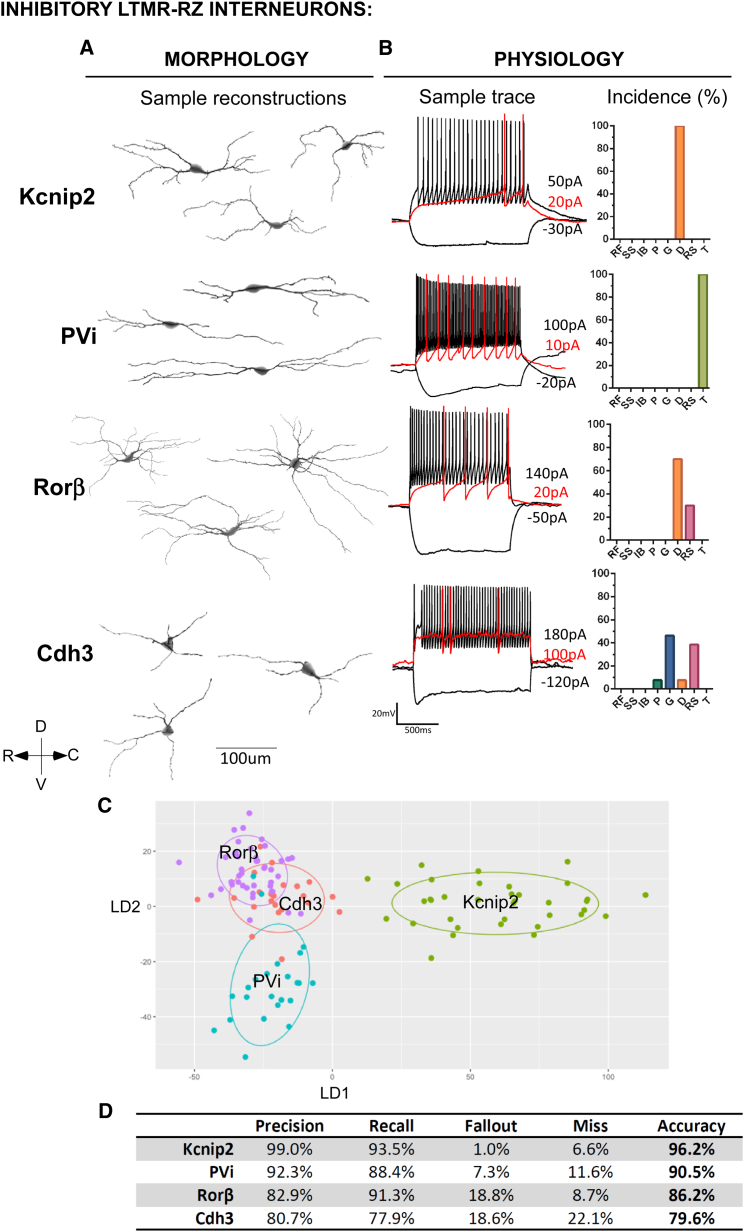
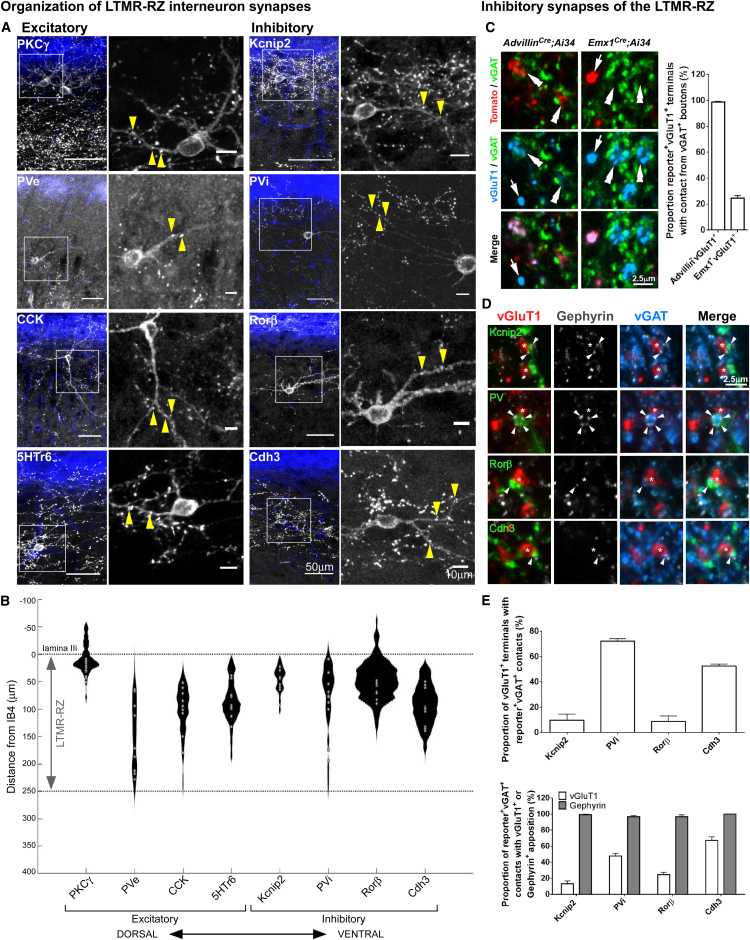
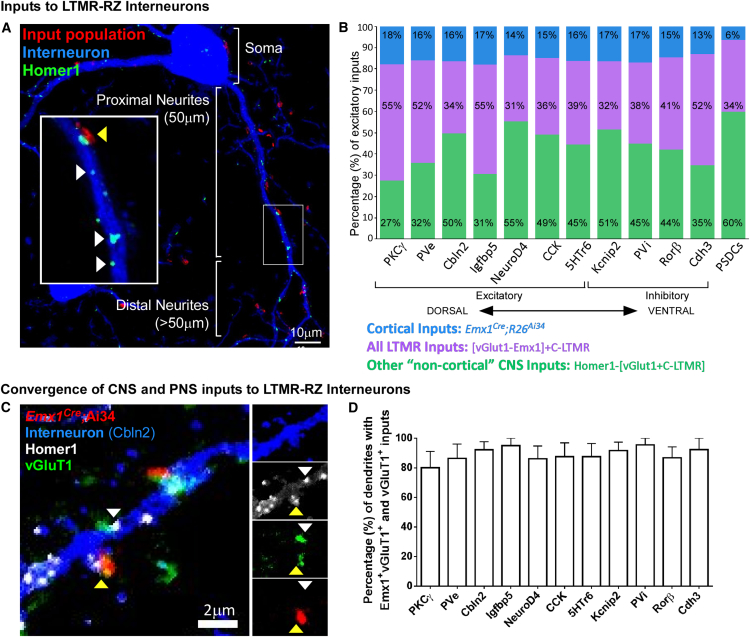
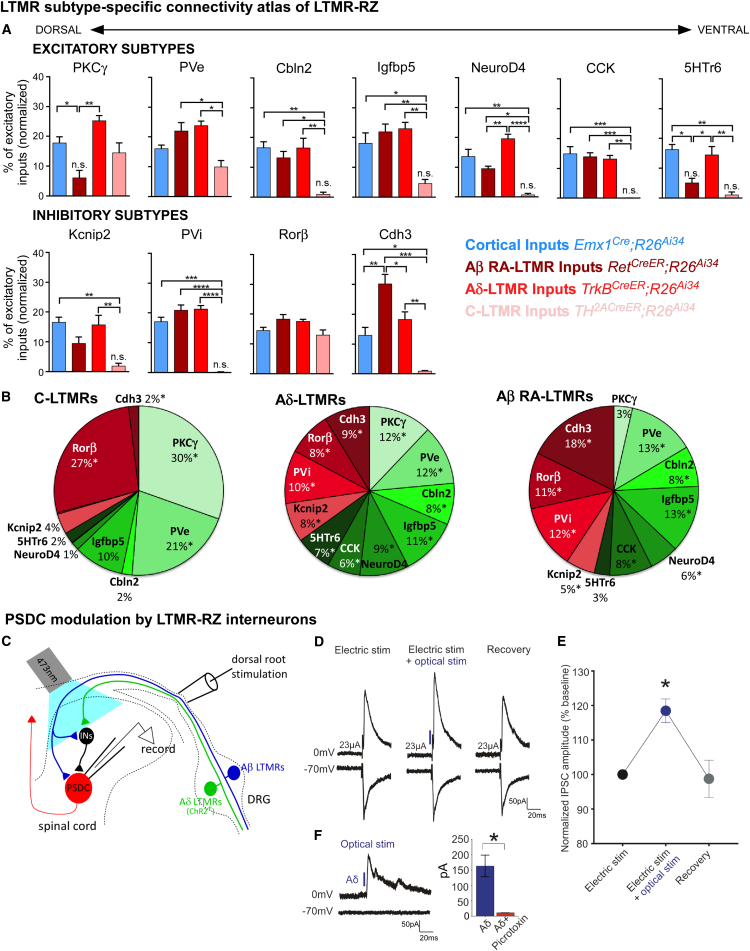
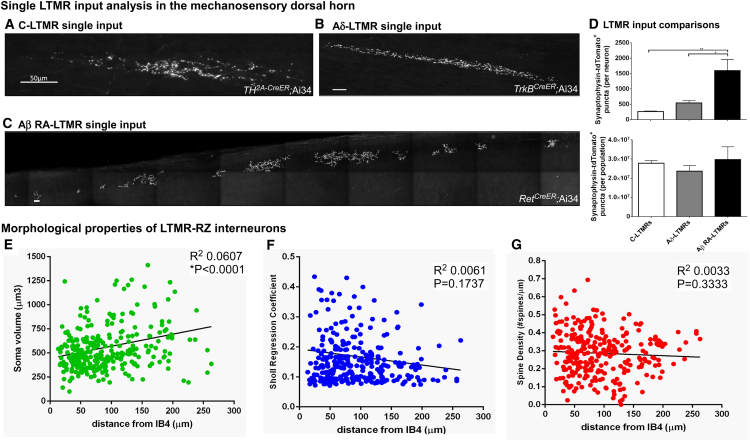
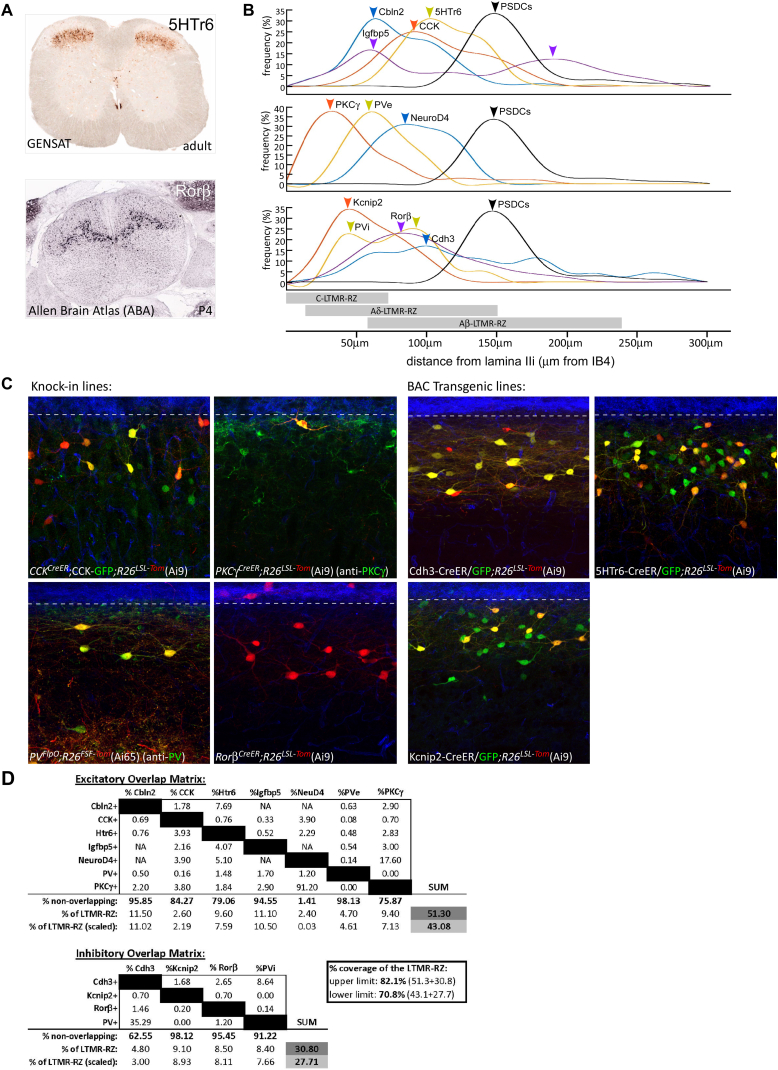
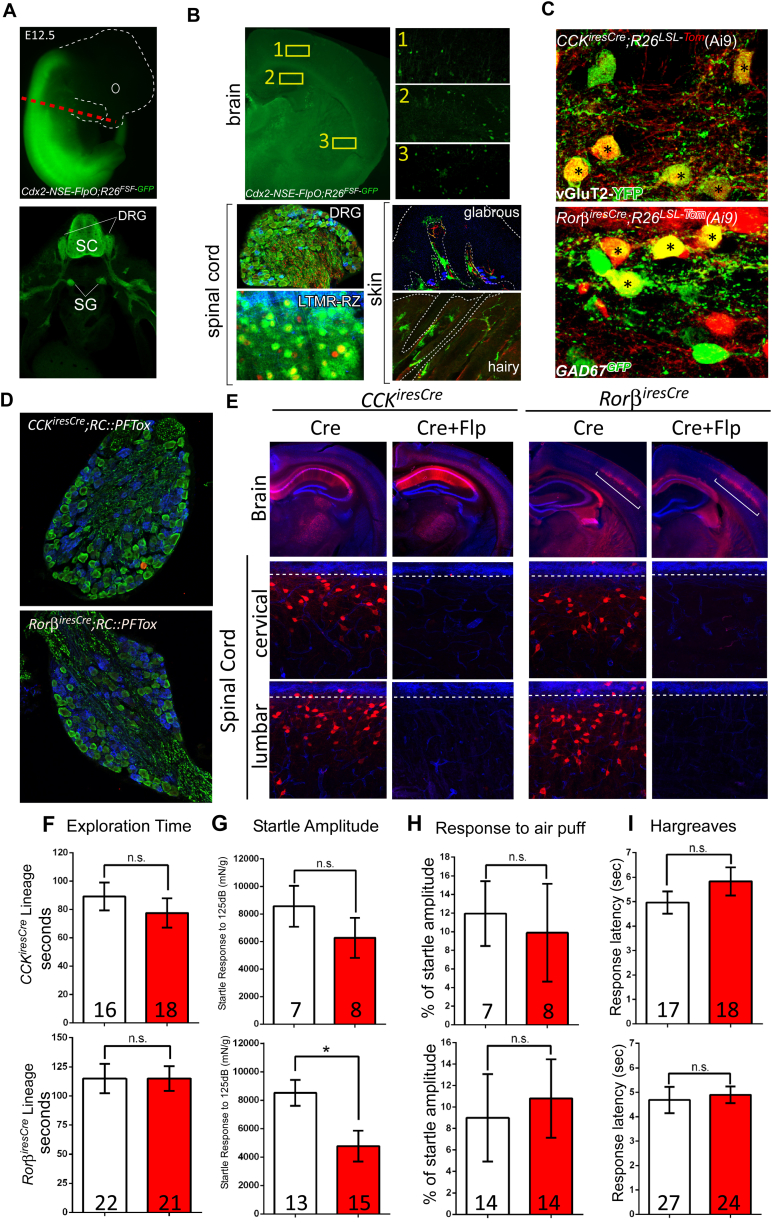
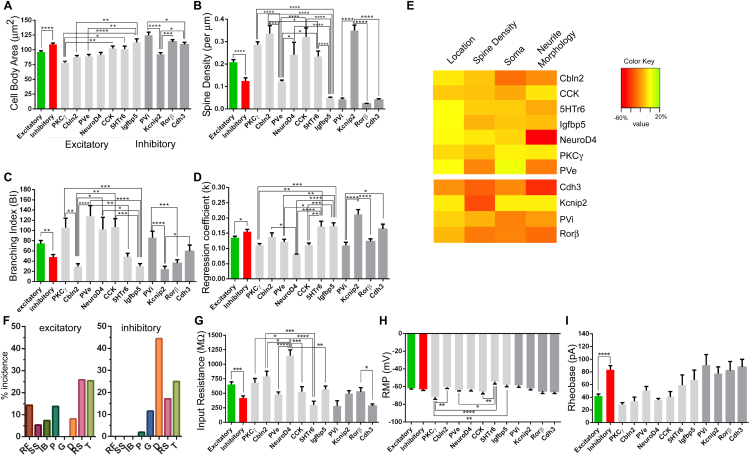
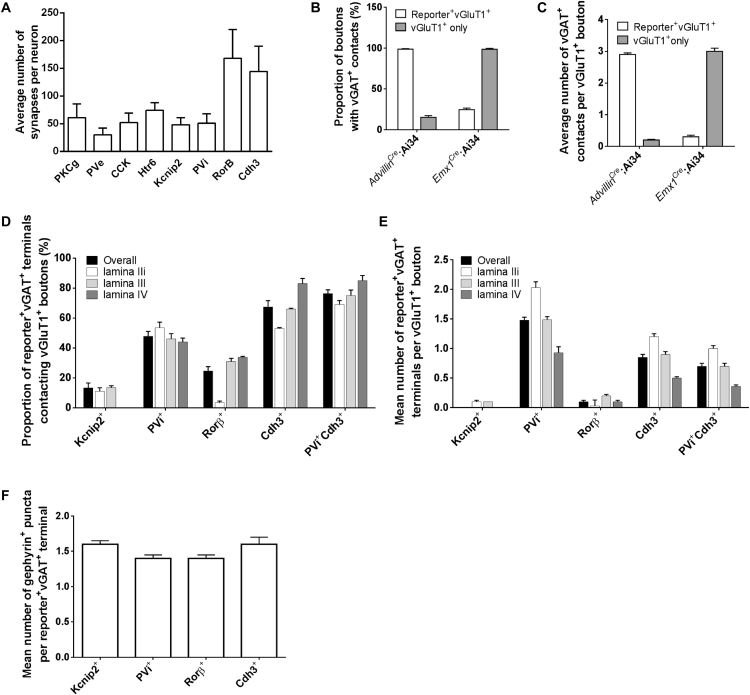
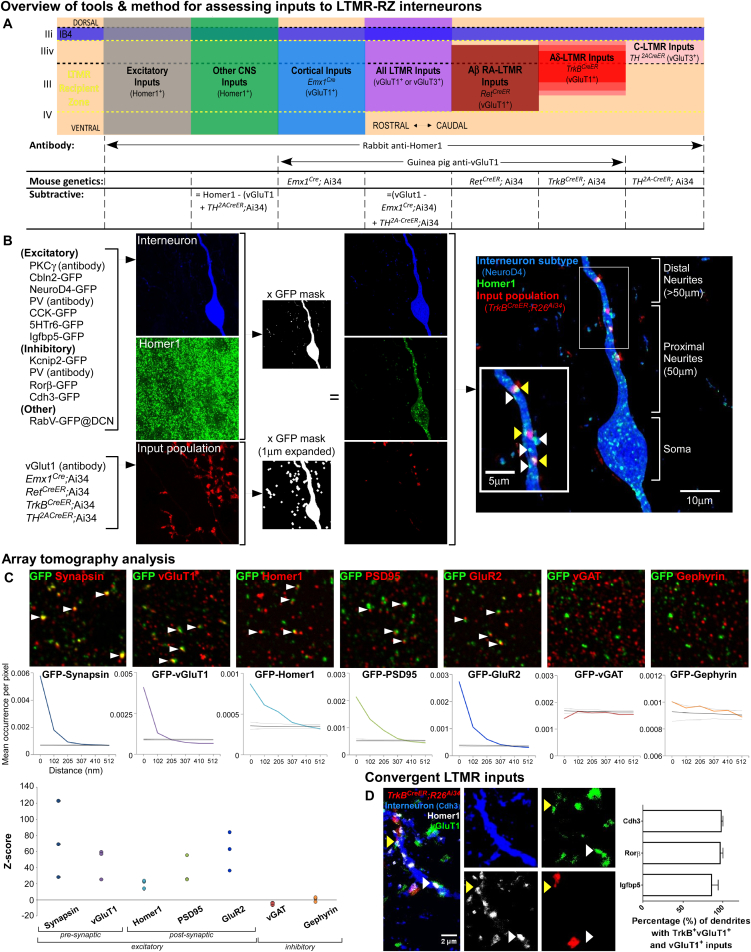
The deep dorsal horn is a poorly characterized spinal cord region implicated in processing low-threshold mechanoreceptor (LTMR) information. We report an array of mouse genetic tools for defining neuronal components and functions of the dorsal horn LTMR-recipient zone (LTMR-RZ), a role for LTMR-RZ processing in tactile perception, and the basic logic of LTMR-RZ organization. We found an unexpectedly high degree of neuronal diversity in the LTMR-RZ: seven excitatory and four inhibitory subtypes of interneurons exhibiting unique morphological, physiological, and synaptic properties. Remarkably, LTMRs form synapses on between four and 11 LTMR-RZ interneuron subtypes, while each LTMR-RZ interneuron subtype samples inputs from at least one to three LTMR classes, as well as spinal cord interneurons and corticospinal neurons. Thus, the LTMR-RZ is a somatosensory processing region endowed with a neuronal complexity that rivals the retina and functions to pattern the activity of ascending touch pathways that underlie tactile perception.

Keywords: low-threshold mechanoreceptors; mouse molecular genetics; somatosensation; spinal cord dorsal horn; spinal cord interneurons; synaptic connectivity.


Figures

None
Graphical abstract
Figure 1
Figure 1
The Mechanosensory Dorsal Horn Is Defined by Overlapping LTMR and Cortical Inputs and Comprises a Large Diversity of Locally Projecting Interneurons (A) Sagittal sections of adult mouse lumbar spinal cord dorsal horn at the level shown in the schematic (left) depicting inputs from all genetically defined classes of LTMRs, as well as cortical input. IB4 binding in blue labels lamina IIi. (B) Sagittal section of adult mouse spinal cord with post-synaptic dorsal column neurons (PSDCs) labeled in red. IB4 is labeled in blue. (C) Percentage of Homer1+ puncta within the LTMR-RZ opposed to synaptic inputs originating in the spinal cord, dorsal root ganglia, and cortex. (D) Percentage of vGluT1+ terminals within the LTMR-RZ that overlap with sensory, cortical, and proprioceptive inputs. (E) Schematic summarizing input modalities and anatomical depth of the LTMR-RZ. (F) Percentage of LTMR-RZ neurons that are excitatory, inhibitory, or projections neurons. (G) Sample Neurolucida reconstructions of LTMR-RZ interneurons labeled randomly. (H) Sample action potential discharge patterns of randomly recorded LTMR-RZ interneurons during somatic injection of hyperpolarizing and depolarizing current steps of increasing magnitude (black traces, rheobase trace in red, current step magnitude noted in pA). Bracket over phasic trace denotes the burst of action potentials (APs) at rheobase distinctive of this particular discharge pattern (n = 52). (I) Percentage of incidence of the seven LTMR-RZ interneuron firing properties depicted in (H). For further details on genetic crosses, see STAR Methods. See also Figure S1.
Figure 2
Figure 2
An LTMR-RZ Genetic Toolkit and Contributions of LTMR-RZ Interneurons to Tactile Perception (A) Sagittal sections of the LTMR-RZ from the interneuron GFP/Tomato mouse lines. Fluorescent reporters are in green, CTB-labeled PSDCs are in red, IB4 binding is in blue. Percentage of the LTMR-RZ is in parentheses. (B) Neurotransmitter quantification for the ten interneuron lines. Excitatory and inhibitory neurons labeled with vGluT2iresCre and vGATiresCre mouse lines, respectively. (C) Sagittal spinal cord section from a CCKiresCre;R26LSL-tdTom(Ai9) mouse and an RorβiresCre;R26LSL-TdTom(Ai9) mouse. IB4 lamina IIi in blue. (D) Discrimination indices for color-shape NORT (left) and texture NORT (right). CCKiresCre;Cdx2-NSE-FlpO;RC::PFTox animals (top), RorβiresCre;Cdx2-NSE-FlpO;RC::PFTox animals (bottom). Positive value indicates preference for the novel object compared to the familiar object. Values displayed as percentages. p < 0.05. (E) Percentage of inhibition of startle response to 125 dB noise in control and mutant littermates when the startle noise is preceded by an 80dB acoustic prepulse (left) or a light air puff of 1.5 PSI (right). CCKiresCre;Cdx2-NSE-FlpO; RC::PFTox animals (top), RorβiresCre;Cdx2-NSE-FlpO;RC::PFTox animals (bottom). p < 0.05. For further details and statistical methods used, see STAR Methods. See also Figures S2 and S3; Table S1.
Figure 3
Figure 3
Morphological and Physiological Characterization of Excitatory LTMR-RZ Interneurons (A and A′) Sample Neurolucida reconstructions from the seven excitatory LTMR-RZ interneuron lines. (B and B′) Sample action potential discharge patterns (left) during somatic injection of hyperpolarizing and depolarizing current steps of increasing magnitude (black traces, rheobase trace in red, current step magnitude noted in pA). Percentage of quantification of firing properties (right). (C) Representative plot of an excitatory interneuron training set chosen at random for linear discriminant analysis, demonstrating grouping of excitatory interneuron classes when described by the first two linear discriminants. Ellipses demarcate significant 95% confidence intervals for each interneuron subtype. (D) Performance of an excitatory interneuron classifier generated using linear discriminant analysis. Classifier predictive performance is quantified by precision (positive predictive value), recall (true positive value), fallout (false positive rate), miss (false negative rate), and accuracy (true positive and true negative rate). For further details, see STAR Methods. See also Figure S4.
Figure 4
Figure 4
Morphological and Physiological Characterization Inhibitory LTMR-RZ Interneurons (A) Sample Neurolucida reconstructions from the four inhibitory LTMR-RZ interneuron lines. (B) Sample action potential discharge patterns (left) during somatic injection of hyperpolarizing and depolarizing current steps of increasing magnitude. Percentage of quantification of firing properties (right). (C and D) See legend for Figures 3C and 3D. For further details, see STAR Methods. See also Figure S4.
Figure 5
Figure 5
LTMR-RZ Interneurons Make Synapses Largely within the LTMR-RZ and Contribute to Both Pre- and Post-synaptic Inhibition in This Region (A) Images showing synaptophysin-reporter expression driven by recombinase mouse lines to target each interneuron population. IB4 (blue) labels lamina IIi in large-scale view (left panels), with inset magnified in right panels. Arrowheads indicate synaptophysin-reporter+ puncta. (B) Violin plots depicting putative synaptic contact number and location by interneuron subtype, as determined by synaptophysin-reporter expression. (C) Images showing synaptophysin-tdTomato (Ai34) expression driven by AdvillinCre or Emx1Cre to label sensory or cortical inputs to the LTMR-RZ, respectively. Co-labeling with vGAT and vGluT1 is used to determine axoaxonic contacts onto these terminals, which were quantified across the LTMR-RZ (graph to right). Double arrowheads and arrows indicate vGluT1+ terminals with and without vGAT+ contacts, respectively. (D) Images showing labeling of PV+, Cdh3+, Rorβ+, and Kcnip2+ inhibitory neuron subtype terminals. Co-labeling with vGAT, vGluT1 (asterisks), and gephyrin (arrowheads) is used to determine axoaxonic and axodendritic contacts made by these boutons. (E) Quantification of vGluT1+ and gephyrin+ apposition to interneuron-reporter+vGAT+ boutons, representing axoaxonic and axodendritic contacts, respectively. Upper panel displays relative proportion of all vGluT1+ boutons in LTMR-RZ receiving axoaxonic contacts from each inhibitory interneuron population. Lower panel displays relative proportion of vGAT+ boutons from each inhibitory interneuron population in contact with vGlut1+ terminals or gephyrin+ puncta. For details of genetic crosses and numbers of cells analyzed, see STAR Methods. See also Figure S5.
Figure 6
Figure 6
All LTMR-RZ Interneuron Subtypes Receive Inputs from the Periphery, Cortex, and Other CNS Regions (A) Representative image used for anatomical input analysis (Figures 6 and 7). Yellow and white arrowheads indicate excitatory inputs (Homer1+ puncta) with and without input from the population of interest, respectively. (B) Compiled quantifications of excitatory inputs from cortex, all LTMRs, and non-cortical CNS onto the 11 interneuron populations and PSDC output neurons. (C) Image showing convergent inputs onto a single dendrite of an interneuron in the LTMR-RZ. Both cortical (Ai34+ vGluT1+, yellow arrowhead) and sensory (Ai34 vGluT1+, white arrowhead) inputs were verified by Homer1+ apposition. (D) Relative proportion of dendrites that receive such convergent inputs for all 11 interneuron populations. For further details, see STAR Methods. See also Figure S6.
Figure 7
Figure 7
LTMR-RZ Interneuron Subtypes Display Unique Patterns of Tactile Synaptic Inputs (A) Compiled quantifications of excitatory inputs from, left to right, cortex, Aβ RA-LTMRs, Aδ-LTMRs, and C-LTMRs onto each of the 11 interneuron populations (onto proximal+distal neurites). Two-way ANOVA with post hoc Tukey’s test: p < 0.05, ∗∗p < 0.01, ∗∗∗p < 0.0005, ∗∗∗∗p < 0.0001. (B) Compiled quantification of LTMR inputs onto the 11 interneuron populations, demonstrating how distinct LTMR subtypes allocate their anatomically defined synapses onto the 11 identified interneuron populations of the LTMR-RZ. p < 0.05. (C) Schematic of conditions for PSDC synaptic physiology. (D) Average of 12 consecutive traces showing Aβ-evoked synaptic responses with electrical stimulation of dorsal roots (23 μA) taken just before (left), during (middle), and after (right) optogenetic activation of Aδ-LTMR terminals (blue). (E) Normalized mean inhibitory postsynaptic current (IPSC) amplitude ± SEM; Student’s t test, p < 0.05. (F) Left: optical stimulation of Aδ-LTMRs evokes polysynaptic IPSCs onto PSDC neurons. Right: mean optical IPSC in the absence and presence of the GABAAR receptor antagonist picrotoxin (100 μM). Student’s t test, p < 0.05. For further details on statistical methods, see STAR Methods. See also Figure S6.
Figure S1
Figure S1
Additional Characterization of the LTMR-RZ, Related to Figure 1 (A) Whole mount labeling of a single C-LTMR input with TH2A-CreER;R26LSL-synaptophysin-tdTomato(Ai34) and 0.02mg of tamoxifen at P21. (B) Whole mount labeling of a single Aδ-LTMR input with TrkBCreER;Ai34 and 0.25mg of tamoxifen at P21. (C) Whole mount labeling of a single Aβ RA-LTMR input with RetCreER;Ai34 and 0.02mg of tamoxifen at E10.5. (D) LTMR single input comparisons. Top panel shows average number of synapses per neuron (n = 4 for each LTMR subtype). Published data citing an average of 10,000 neurons per mouse DRG (Gjerstad et al., 2002), and relative proportions of DRG neurons that comprise the C-, Aδ-, and Aβ RA-LTMR populations as 15%–20%, 7%, and 5%, respectively (Li et al., 2011, Rutlin et al., 2015, Luo et al., 2009) was used to subsequently calculate the approximate number of total synapses from each population (lower panel, see STAR Methods). For puncta per neuron: (one-way ANOVA: p = 0.0039, F(2,9) = 10.96). Post hoc Tukey’s test: p < 0.05, ∗∗p < 0.01. (E) Plot of soma volume as a function of distance from IB4 (Lamina IIiv/III boundary). (F) Plot of Sholl Regression Coefficient (k) as a function of distance from IB4. Sholl Regression Coefficient (k) is a Sholl-based measure that describes the change in dendrite density as a function of distance from the cell body. A low k value is often associated with a high neurite complexity. These results show that both simple and complex neurite morphologies can be found throughout the LTMR-RZ. (G) Plot of spine density as a function of distance from IB4. Spine density measurements can be an indicator of excitatory and inhibitory subtypes, with inhibitory neurons often having very low spine density counts. These results suggest that both excitatory and inhibitory interneurons can be found throughout the LTMR-RZ.
Figure S2
Figure S2
Additional Characterization of LTMR-RZ Genetic Toolbox, Related to Figure 2 (A) Examples of transverse spinal cord images from GENSAT (top, http://www.gensat.org/index.html) and Allen Brain Atlas (bottom, http://mousespinal.brain-map.org) websites depicting expression patterns screened for during in-silico screen. (B) Smoothened cell body histogram distribution of LTMR-RZ interneuron lines. Arrows indicate peak frequency of soma location within the LTMR-RZ. (C) Sagittal sections of the LTMR-RZ from CreER/FlpO knockin animals (left) and BAC-transgenic CreER lines (right). IB4 binding in blue. Animal genotype on the bottom left corner. Recombinase activity is depicted in red. Antibody binding, in the case for PKCγ and PV, or overlap with fluorescent reporter lines depicted in green. Also, see Table S1B. (D) Excitatory and inhibitory overlap matrix used to calculate the percent coverage of the LTMR-RZ represented by the eleven genetically labeled interneuron lines. Each box in the matrix represents a unique mouse cross to assess the amount of overlap between the two mouse lines. For each mouse line, the “% non-overlapping” is derived by adding the percent overlap (ie each matrix box in the column) and subtracting it from 100. The “% of the LTMR-RZ” are as depicted in Figure 2A for each individual line, the sum of which represents the coverage of the LTMR-RZ without consideration for potential overlap (51.3%+30.8% = 82.1%). The “% of LTMR-RZ (scaled)” represents the percentage of the LTMR-RZ that each line represents scaled for the overlapping population. The sum of this scaled percentage represents the coverage of the LTMR-RZ taking into consideration the amount of overlap across each mouse line (43.1%+27.7% = 70.8%). See STAR Methods for mouse crosses, at least 100 GFP+ neurons counted per animal, at least 3 animals per cross. Percent overlap with PVe and PVi is calculated as 36% excitatory and 64% inhibitory. NA: mouse lines not available for compatible crosses.
Figure S3
Figure S3
Characterization of Intersectional Inactivation and Additional Behavioral Assays, Related to Figure 2 (A) Cdx2-NSE-FlpO;R26FSF-GFP E12.5 embryo depicting caudal expression of FlpO (top). Cross section at red dotted line (bottom). Early in development Cdx2-NSE-FlpO recombination is restricted to posterior neural plate, prospective spinal cord territory. See STAR Methods and (Coutaud and Pilon 2013). Note specific FlpO expression in caudal neuronal tissues (spinal cord, SC; dorsal root ganglia, DRG; sympathetic ganglia, SG) but not in brain, internal organs or skin. (B) Adult characterization of brain, spinal cord, and skin tissue from a Cdx2-NSE-FlpO; R26FSF-GFP animal. Adult brain characterization reveals very sparse FlpO activity in the brain (top). Yellow insets show very low levels of recombination in the cortex (1), hippocampus (2), and striatum (3). Adult DRG and spinal tissue show near complete FlpO recombination (bottom left, IB4 binding in blue). Adult glabrous and hairy skin sections (bottom right) show no FlpO activity in skin cells (outlined in white dotted lines) including Troma1+ merkel cells depicted in blue for the glabrous skin inset. Neurofilament 200 staining in red, GFP staining in green. (C) Neurotransmitter characterization of CCKiresCre and RorβiresCre lineages in the LTMR-RZ. Asterisk denotes overlap. (D) DRG cross-sections from CCKiresCre;RC::PFtox (top) and RorβiresCre;RC::PFtox (bottom) animals. Cre recombination of RC::PFtox results in mCherry expression, depicted in red. Note very minimal DRG Cre recombination of CCKiresCre (top) and no DRG Cre recombination of RorβiresCre (bottom). IB4 binding in blue, Neurofilament-200 staining in green. (E) Cross-sections through brain and cervical/lumbar spinal cords from CCKiresCre;RC::PFtox, CCKiresCre;Cdx2-NSE-FlpO;RC::PFtox, RorβiresCre;RC::PFtox and RorβiresCre;Cdx2-NSE-FlpO;RC::PFtox animals (left to right). Cre recombination of RC::PFtox results in mCherry expression in brain and spinal cord, depicted in red. Combined Cre and Flp recombination from Cdx2-NSE-FlpO of RC::PFtox results in loss of mCherry expression and expression of Tetanus Toxin specifically in spinal cord but not in the brain. For brain sections NeuN is depicted in blue, for spinal cord sections IB4 binding is depicted in blue. (F–H) Additional behavior assays CCKiresCre;Cdx2-NSE-FlpO;RC::PFtox (top panels), RorβiresCre;Cdx2-NSE-FlpO;RC:;PFtox (bottom panels). (F) Exploration time during texture NORT. (G) Startle amplitude to 125dB noise during PPI test. RorβiresCre;Cdx2-NSE-FlpO;RC::PFtox mutant animals display a much lower startle response than control littermates, indicating some motor deficits (p < 0.05). (H) Response to a light air puff stimulus alone. Responses are expressed as a percent of startle response to a 125-dB noise. (I) Hargreaves temperature sensitivity assay.
Figure S4
Figure S4
Additional Morphometric and Physiological Characterization of 11 Interneurons of the LTMR-RZ, Related to Figures 3 and 4 (A) Cell body area summary for excitatory and inhibitory subtypes. For excitatory versus inhibitory comparison: (unpaired t test ∗∗∗∗p < 0.0001). For excitatory group: (one-way ANOVA: p < 0.0001, F[6,201] = 6.562). For inhibitory group: (one-way ANOVA: p < 0.0001, F[3,142] = 12.47). Post hoc Tukey’s test: p < 0.05, ∗∗p < 0.01, ∗∗∗p < 0.0005, ∗∗∗∗p < 0.0001. (B) Spine density measurements for excitatory and inhibitory subtypes. For excitatory versus inhibitory comparison: (unpaired t test ∗∗p < 0.0001). For excitatory group: (one-way ANOVA: p < 0.0001, F[6,187] = 24.39). For inhibitory group: (one-way ANOVA: p < 0.0001, F[3,125] = 132.1). Post hoc Tukey’s test: p < 0.05, ∗∗∗∗p < 0.0001. (C) Branching index (BI) summary describing ramification patterns for excitatory and inhibitory subtypes. BI values are positively correlated to branching complexity. For excitatory versus inhibitory comparison: (unpaired t test ∗∗p < 0.005). For excitatory group: (one-way ANOVA: p < 0.0001, F[6,194] = 9.207). For inhibitory group: (one-way ANOVA: p < 0.0001, F[3,138] = 8.952). Post hoc Tukey’s test: p < 0.05, ∗∗p < 0.005, ∗∗∗p < 0.0005, ∗∗∗∗p < 0.0001. (D) Regression Coefficient (k) summary for excitatory and inhibitory cohorts describing one sholl-based metric of neurite complexity. k values are negatively correlated to branching complexity. For excitatory versus inhibitory comparison: (unpaired t test p < 0.05). For excitatory group: (one-way ANOVA: p < 0.0001, F[6,194] = 9.28). For inhibitory group: (one-way ANOVA: p < 0.0001, F[3,138] = 13.17). Post hoc Tukey’s test: p < 0.05, ∗∗p < 0.005, ∗∗∗p < 0.0005, ∗∗∗∗p < 0.0001. (E) Heatmap of changes in classifier accuracy for excitatory and inhibitory interneurons when metrics related to cell location, soma morphology, dendritic spines, or dendrite morphology are omitted from LDA (see STAR Methods for detailed metric membership in each category). Heatmap quantities are displayed as percent change in accuracy (true positive and true negative rate) when one of these categories are omitted, as compared to when all metrics are used to train the linear discriminant model. (F) Percent quantification of action potential discharge patterns for excitatory (left) and inhibitory (right) cohorts. RF = Reluctant Firer, SS = single spiking, IB = Initial Bursting, p = Phasic, G = Gap, D = Delayed, RS = Regular Spiking; T = Tonic. (G) Input Resistance for excitatory and inhibitory subtypes. For excitatory versus inhibitory cohort comparison: (unpaired t test ∗∗∗p < 0.0005). For excitatory group: (one-way ANOVA: p < 0.0001, F[6,70] = 9.516). For inhibitory group: (one-way ANOVA: p < 0.05, F[3,39] = 3.950). Post hoc Tukey’s test: p < 0.05, ∗∗p < 0.005, ∗∗∗p < 0.0005, ∗∗∗∗p < 0.0001. (H) Resting membrane potential for excitatory and inhibitory subtypes. For excitatory versus inhibitory cohort comparison: (unpaired t test: n.s.). For excitatory group: (one-way ANOVA: p < 0.001, F[6,10] = 5.966). For inhibitory group: (one-way ANOVA: p = 0.1918, F[3,39] = 1.658). Post hoc Tukey’s test: p < 0.05, ∗∗p < 0.01, ∗∗∗∗p < 0.0001. (I) Rheobase currents for excitatory and inhibitory subtypes. For excitatory versus inhibitory cohort comparison: (unpaired t test ∗∗∗∗p < 0.0001). For excitatory group: (one-way ANOVA: p = 0.0497, F[6,61] = 2.255). For inhibitory group: (one-way ANOVA: p = 0.9032, F[3,37] = 0.1891).
Figure S5
Figure S5
Additional Quantifications of LTMR-RZ Interneuron Synapses, Related to Figure 5 (A) Average number of synapses per neuron for 8/11 LTMR-RZ interneuron populations (n = 3 per population with a minimum of 10 cells per animal). Counts are the same as those used for analysis displayed in Figure 5B. (B) Proportion of Tomato+vGluT1+ and vGluT1+ only terminals receiving vGAT+ contacts in AdvillinCre;R26LSL-synaptophysin-tdTomato(Ai34) and Emx1Cre;Ai34 animals (n = 4 for each population). (C) Average number of vGAT+ contacts to Tomato+vGluT1+ and vGluT1+ only terminals in AdvillinCre;Ai34 and Emx1Cre;Ai34 animals (n = 4 for each population). (D) Proportion of Reporter+vGAT+ contacts to vGluT1+ boutons as a function of LTMR-RZ lamina (n = 4 for each population). (E) Average number of Reporter+vGAT+ contacts to individual vGluT1+ boutons as a function of LTMR-RZ lamina (n = 4 for each population). (F) Average number of gephyrin+ puncta per Reporter+vGAT+ bouton (n = 3 for each population).
Figure S6
Figure S6
Tools, Approach, and Validation of Anatomically Defined Synapses for Input Analysis, Related to Figures 6 and 7 (A) Overview of genetic tools, antibodies, and subtractive methods used to identify and dissect the relative contributions of various input populations to each interneuron population’s excitatory connectome. Schematic shows relative location of these input populations to the SC DH (sagittal view). Tamoxifen regimens for labeling input populations were as follows: 0.4mg at P21 for TH2A-CreER;R26LSL-synaptophysin-tdTomato(Ai34), 2mg at P21 for TrkBCreER;Ai34, and 2.5mg at E10.5-11.5 for RetCreER;Ai34. All animals used in this analysis were collected at P30-P40 and lumbar SC was used for analysis. (B) Outline of methods used for quantifying anatomically defined synapses. IHC images were collected and the interneuron channel was used to generate two masks (one containing only interneuron label and the other containing this same region expanded in all directions by 1 μm) that could then be used to isolate only post-synaptic labeling within the interneuron mask and pre-synaptic labeling within the expanded mask. When recombined, counts of inputs with (yellow arrows) and without (white arrows) contacts from the input population of interest were quantified according to cellular compartment (soma, proximal neurite, distal neurite). See STAR Methods. (C) Co-localization analysis of genetically labeled sensory presynaptic axon terminals (AdvillinFlpO;R26FSit) using array tomography. Single planes of IHC labeling show association of synaptic markers with GFP+ terminals (arrows). Quantifications show mean occurrence of GFP-immunolabeling co-localization per pixel as a function of distance from the center of GFP+ boutons. Colored lines represent real data; black and gray lines represent the mean ± standard deviation of randomized data. Z scores for mean marker densities within GFP+ terminals for real (n = 3 animals) versus randomized data (n = 4 stacks) indicate higher densities in the real data. (D) IHC image illustrating convergent inputs onto a single dendrite of an interneuron in the LTMR-RZ. Both Aδ-LTMRs (Ai34+vGluT1+) and other sensory or cortical (Ai34vGluT1+) inputs were verified by Homer1+ apposition. Quantification shows the relative proportion of dendrites that receive convergent LTMR inputs for three interneuron populations (n = 3 for each interneuron population).

Comment in

References

    1. Abraira V.E., Ginty D.D. The sensory neurons of touch. Neuron. 2013;79:618–639. - PMC - PubMed
    1. Andersen P., Eccles J.C., Sears T.A. Presynaptic inhibitory action of cerebral cortex on the spinal cord. Nature. 1962;194:740–741. - PubMed
    1. Bai L., Lehnert B.P., Liu J., Neubarth N.L., Dickendesher T.L., Nwe P.H., Cassidy C., Woodbury C.J., Ginty D.D. Genetic Identification of an Expansive Mechanoreceptor Sensitive to Skin Stroking. Cell. 2015;163:1783–1795. - PMC - PubMed
    1. Bourane S., Grossmann K.S., Britz O., Dalet A., Del Barrio M.G., Stam F.J., Garcia-Campmany L., Koch S., Goulding M. Identification of a spinal circuit for light touch and fine motor control. Cell. 2015;160:503–515. - PMC - PubMed
    1. Burgess P.R., Petit D., Warren R.M. Receptor types in cat hairy skin supplied by myelinated fibers. J. Neurophysiol. 1968;31:833–848. - PubMed

LinkOut - more resources