. 2017 Jan 18;93(2):291-298.
doi: 10.1016/j.neuron.2016.11.043. Epub 2016 Dec 29.

Dynamic, Cell-Type-Specific Roles for GABAergic Interneurons in a Mouse Model of Optogenetically Inducible Seizures

Affiliations

Dynamic, Cell-Type-Specific Roles for GABAergic Interneurons in a Mouse Model of Optogenetically Inducible Seizures

Sattar Khoshkhoo et al. Neuron. .

Abstract

GABAergic interneurons play critical roles in seizures, but it remains unknown whether these vary across interneuron subtypes or evolve during a seizure. This uncertainty stems from the unpredictable timing of seizures in most models, which limits neuronal imaging or manipulations around the seizure onset. Here, we describe a mouse model for optogenetic seizure induction. Combining this with calcium imaging, we find that seizure onset rapidly recruits parvalbumin (PV), somatostatin (SOM), and vasoactive intestinal peptitde (VIP)-expressing interneurons, whereas excitatory neurons are recruited several seconds later. Optogenetically inhibiting VIP interneurons consistently increased seizure threshold and reduced seizure duration. Inhibiting PV+ and SOM+ interneurons had mixed effects on seizure initiation but consistently reduced seizure duration. Thus, while their roles may evolve during seizures, PV+ and SOM+ interneurons ultimately help maintain ongoing seizures. These results show how an optogenetically induced seizure model can be leveraged to pinpoint a new target for seizure control: VIP interneurons. VIDEO ABSTRACT.


Figures

FIGURE 1
FIGURE 1. Simultaneous EEG recording and bulk calcium imaging in a mouse model for optogenetically-inducible seizures
A: Schematic illustrating the experimental design for optogenetic seizure induction as well as simultaneous EEG recording and photometry. For seizure induction, blue light was delivered through cannula a. For photometry, bulk fluorescence from neurons expressing GCaMP6f was captured through cannula b. Bilateral EEG was recorded via skull screws. B: Example of simultaneous EEG and photometry recordings during a seizure in a SOM-Cre mouse. Time 0 marks the onset of the stimulus immediately preceding the seizure. C: Example of simultaneous EEG and photometry recordings from panel B, zoomed in to illustrate the high correlation between the electrographic seizure activity and photometry signals. D: Example of simultaneous EEG and photometry recordings from panel B, zoomed in to illustrate the temporal limitation of photometry in discerning individual epileptiform discharges at high frequencies. See also Figure S1.
FIGURE 2
FIGURE 2. Interneurons and excitatory neurons exhibit distinct patterns of activity during seizures
A: (i) Mean EEG power—normalized to the peak EEG power during each seizure—and photometry signals—normalized to the peak photometry signal during each seizure—in PV Cre mice. Both recordings are aligned to the time of seizure onset (indicated by the dotted red line). (ii) Normalized photometry signals 5s before and after seizure onset. (iii) EEG power and photometry signals with compressed time, aligned to the time of seizure onset and seizure termination. Seizure onset and termination are indicated by the dotted red lines. (iv) Scatterplots showing photometry signals from individual seizures immediately after seizure onset (onset), at the peak —the same data point for all seizures— of the mean photometry trace (peak), one data point prior to seizure termination (termination), and 1s after seizure termination (post-termination). B: Same as A, but for SOM-Cre mice. C: Same as A, but for VIP-Cre mice. D: Same as A, but for Emx1-Cre mice. All data show means ± SEM and are analyzed using the two-tailed paired-sample t-test. Shading in the traces are ± SEM. Not significant (n.s.), p<0.05 (*), p<0.01 (**), p<0.001 (***). See also Figures S2 and S3.
FIGURE 3
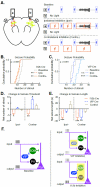
FIGURE 3. Cell type-specific optogenetic inhibition reveals different roles for DlxI12b+ and VIP+ interneurons in seizure initiation and maintenance
A: Schematic illustrating the design of experiments using optogenetic inhibition of interneurons. For seizure induction, 445nm light was delivered through cannula a using the same protocol shown in Figure 1. Interneuron inhibition was achieved by delivering a constant 594nm amber light through cannula a or b. Experiments were performed on three consecutive days using three different conditions, as shown. Bilateral EEG was recorded via skull screws. B–C: Cumulative probability for seizure induction as a function of the number of optogenetic stimuli delivered, in DlxI12b-Cre (B) and VIP-Cre (C) mice. “ipsi” and “contra” refer to inhibition of ipsilateral or contralateral interneurons, respectively, as shown in A. D: Change in the number of stimuli required to induce the first seizure (seizure threshold) relative to baseline. E: Change in seizure duration relative to baseline. F: Schematic illustrating a simplified model for cortical microcircuits comprising interneurons and excitatory neurons during the pre-ictal stage. Arrows and flat lines symbolize excitatory and inhibitory synapses, respectively. Yellow boxes illustrate optogenetic inhibition. All data show means ± SEM. Data in panels B and C are analyzed using one-way ANOVA and multiple comparisons test and data in panels D and E are analyzed using two-tailed student's t-test. In panels D and E, unless marked on the figure, there are no significant changes. Not significant (n.s.), p<0.05 (*), p<0.01 (**), p<0.001 (***).
FIGURE 4
FIGURE 4. Cortical spreading depression (CSD)-like events associated with seizures
A: Example of simultaneous EEG and photometry recordings in a PV-Cre mouse demonstrating a CSD-like event during the post-ictal period. Time 0 marks the onset of the stimulus immediately preceding the seizure. B: Mean photometry recordings—normalized to the peak of each CSD-like event—aligned to the onset of the CSD-like events. C: Mean EEG power aligned to the onset of the CSD-like events. D: Time of onset of each CSD-like event, relative to the time of termination of each seizure. Each data point is derived from a single seizure. E: Duration of CSD-like events. Each data point is derived from a single seizure. F: Time from the onset to the peak of each CSD-like event. Each data point is derived from a single seizure. All data show means ± SEM and are analyzed using one-way ANOVA and multiple comparisons test. Shading in the traces and error bars in the scatter plots are ± SEM. In panels D through G, unless marked on the figure, there are no significant differences between different genotypes. p<0.01 (**), p<0.001 (***). See also Figure S4.

Comment in

References

    1. Alger BE, Nicoll RA. GABA-mediated biphasic inhibitory responses in hippocampus. Nature. 1979;281:315–317. - PubMed
    1. Alvarado-Rojas C, Lehongre K, Bagdasaryan J, Bragin A, Staba R, Engel J, Navarro V, Le Van Quyen M. Single-unit activities during epileptic discharges in the human hippocampal formation. Front. Comput. Neurosci. 2013;7:140. - PMC - PubMed
    1. Andersen P, Dingledine R, Gjerstad L, Langmoen IA, Laursen AM. Two different responses of hippocampal pyramidal cells to application of gamma-amino butyric acid. J. Physiol. 1980;305:279–296. - PMC - PubMed
    1. Arellano JI, Muñoz A, Ballesteros-Yáñez I, Sola RG, DeFelipe J. Histopathology and reorganization of chandelier cells in the human epileptic sclerotic hippocampus. Brain J. Neurol. 2004;127:45–64. - PubMed
    1. Bower MR, Buckmaster PS. Changes in granule cell firing rates precede locally recorded spontaneous seizures by minutes in an animal model of temporal lobe epilepsy. J. Neurophysiol. 2008;99:2431–2442. - PubMed

Publication types