. 2017 Mar 2;20(3):303-314.e5.
doi: 10.1016/j.stem.2016.11.004. Epub 2016 Dec 29.

Lipid Desaturation Is a Metabolic Marker and Therapeutic Target of Ovarian Cancer Stem Cells

Affiliations

Lipid Desaturation Is a Metabolic Marker and Therapeutic Target of Ovarian Cancer Stem Cells

Junjie Li et al. Cell Stem Cell. .

Abstract

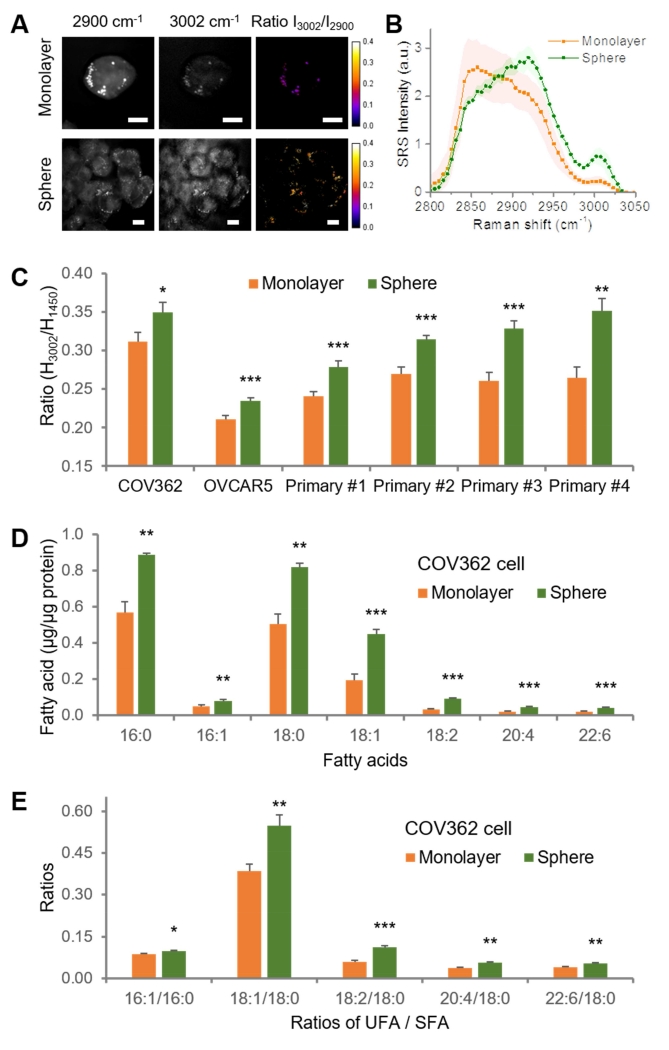
Lack of sensitive single-cell analysis tools has limited the characterization of metabolic activity in cancer stem cells. By hyperspectral-stimulated Raman scattering imaging of single living cells and mass spectrometry analysis of extracted lipids, we report here significantly increased levels of unsaturated lipids in ovarian cancer stem cells (CSCs) as compared to non-CSCs. Higher lipid unsaturation levels were also detected in CSC-enriched spheroids compared to monolayer cultures of ovarian cancer cell lines or primary cells. Inhibition of lipid desaturases effectively eliminated CSCs, suppressed sphere formation in vitro, and blocked tumor initiation capacity in vivo. Mechanistically, we demonstrate that nuclear factor κB (NF-κB) directly regulates the expression levels of lipid desaturases, and inhibition of desaturases blocks NF-κB signaling. Collectively, our findings reveal that increased lipid unsaturation is a metabolic marker for ovarian CSCs and a target for CSC-specific therapy.

Keywords: NF-κB; Raman spectroscopic imaging; SCD1; cancer stem cells; lipid desaturation; ovarian cancer.


Figures

Figure 1
Figure 1. Increased lipid unsaturation level in sorted ALDH+/CD133+ ovarian cancer cells
(A) Representative hyperspectral SRS images of flow-sorted ALDH/CD133 and ALDH+/CD133+ COV362 cells. Images at 2900 cm−1, 3002 cm−1 and the intensity ratio image between 3002 and 2900 cm−1 are shown. Scale bars: 10 μm. (B) Average SRS spectra from the lipid droplets in ALDH/CD133 (n=3) and ALDH+/CD133+ cells (n=8). Shaded area indicates the standard deviation (SD) of SRS spectral measurement from different cells. (C) Spontaneous Raman spectra taken from LDs in ALDH/CD133 and ALDH+/CD133+ sorted COV362 cells. The spectra were normalized by the height of the Raman peak at 1450 cm−1. The differences at 1264 cm−1, 1660 cm−1, and 3002 cm−1 were highlighted in gray. (D) Scatter plot of Raman spectra height ratio between the peaks at 3002 cm−1 and 1450 cm−1 in ALDH/CD133 and ALDH+/CD133+ COV362 cells. Each dot represents a single cell, and the bars indicate means ± SEM; P = 0.0005. (E) Raman spectra taken from LDs in ALDH/CD133 and ALDH+/CD133+ OVCAR5 cells. The spectra were normalized by the height of peak at 1450 cm−1. The differences at 1264 cm−1, 1660 cm−1, and 3002 cm−1 were highlighted in gray. (F) Scatter plot of Raman spectra height ratio between the peaks at 3002 cm−1 and 1450 cm−1 in ALDH/CD133 and ALDH+/CD133+ OVCAR5 cells. Each dot represents a single cell, and the bars indicate means ± SEM; P = 0.0012. See also Figure S1, Movie S1, and Movie S2.
Figure 2
Figure 2. Increased lipid unsaturation level in spheres compared to monolayer cultures
(A) Representative hyperspectral SRS images of COV362 cells grown as monolayers and spheres. Images at 2900 cm−1, 3002 cm−1 and the intensity ratio between 3002 cm−1 and 2900 cm−1 are shown. Scale bars: 10 μm. (B) Average SRS spectra from the lipid droplets in COV362 monolayer (n=6) and spheres (n=6). Shaded area indicates the standard deviation of SRS spectral measurement from different cells. (C) Quantitation of the height ratio between the =C-H peak at 3002 cm−1 and the C-H bending peak at 1450 cm−1 based on Raman spectral measurements in monolayers and spheres derived from COV362, OVCAR5 and primary cells isolated from malignant OC ascites of four patients. The data are shown as means + SEM; n ≥ 10. (D) LC-MS measurement of fatty acids saponfied from all lipids extracted from OVCAR5 monolayer cultures and spheres. Fatty acids levels were normalized by total protein amount extracted from an equal number of cells. (E) Quantitation of the ratios of unsaturated fatty acid (UFA) to saturated fatty acid (SFA) in OVCAR5 monolayer and spheres. The data are shown as means + SD; n = 3. * P < 0.05, ** P < 0.01, *** P < 0.001. See also Figure S2, Table S1, Movie S3, and Movie S4.
Figure 3
Figure 3. Increased desaturation in CSCs is due to lipid desaturases
(A, B) Quantitative RT-PCR measurement of SCD1 expression levels in ALDH/CD133 and ALDH+/CD133+ OVCAR5 and COV362 cells. The data are shown as means + SEM; n = 3. (C, D) Raman spectral measurement of lipid unsaturation level in primary spheres treated with the SCD1 inhibitor CAY10566 or Δ6 inhibitor SC-26196 at 1.0 μM for 6 days. The data are shown as means + SEM; n ≥ 10. (E-H) LC-MS analysis of relative abundance of 13C incorporation into fatty acids 16:0, 16:1, 18:0 and 18:1 saponified from all lipids in OVCAR5 spheroids treated with DMSO or 1 μM CAY10566 for 6 days. The data are shown as means + SD; n = 3. * P < 0.05, ** P < 0.01, *** P < 0.001. See also Figure S3.
Figure 4
Figure 4. Inhibition of lipid desaturation impairs ovarian cancer cell stemness
(A) RT-PCR measurement of ALDH1A1 mRNA expression level in OVCAR5, COV362, and primary spheroids. (B) RT-PCR measurement of Sox2 mRNA expression level in OVCAR5, COV362, and primary spheroids. Treatment with CAY10566 or SC-26196 in spheroids was done at a concentration of 1.0 μM for 6 days. (C, D) RT-PCR measurement of SCD1, ALDH1A1 mRNA expression level in OVCAR5, COV362 cells stably transfected with scrambled control shRNA (shCtr) or SCD1 shRNA (shSCD). The data were shown as means + SEM; n = 3. * P < 0.05, ** P < 0.01, *** P < 0.001. (E) Flow cytometry analysis of ALDH+ cells sorted from OVCAR5, COV362 and primary cells after CAY10566 or SC-26196 treatment at a concentration of 1.0 μM for 6 days. DEAB was used as negative control. See also Figure S4.
Figure 5
Figure 5. Inhibition of lipid desaturation prevents sphere growth in vitro and tumor formation in vivo
(A, B) Representative images of OVCAR5, COV362 and primary spheres treated with CAY10566 or SC-26196 at indicated concentrations for 6 days. (C, D) Sphere proliferation of COV362 cells supplemented with fatty acid (C) 18:0 and (D) 18:1 at indicated concentrations and treated with CAY10566 or SC-26196 at 1 μM for 6 days. Comparisons were performed between inhibitors treated group and DMSO treated group under the same concentrations of fatty acid supplementation (P value indicated by *), or between DMSO groups under different concentrations of fatty acid supplementation (P value indicated by #). The data are normalized to the blank control (no fatty acid supplementation and treated with DMSO) and shown as means + SEM; n = 4. (E, F) Growth curves of xenografts derived from (E) DMSO (n = 7) or CAY10566 (n = 6), and (F) DMSO (n = 8) or SC-26196 (n = 8) pretreated OVCAR5 cells grown in spheroids. The data are presented as means + SEM. Inset: tumor size comparison at the end of study (42 days after tumor cells inoculation). Upper: DMSO; lower: treated. * P < 0.05, ** P < 0.01, *** P < 0.001. (G) Tumor initiation assay using serial dilution of OVCAR5 cells pretreated with DMSO or CAY10566 at 1 μM. Cells were counted and then cultured for 6 days with the presence of DMSO or CAY10566 to allow sphere formation before injected into the mice. 5 mice were used for each group. See also Figure S5, Figure S6, and Table S2.
Figure 6
Figure 6. Inhibition of lipid desaturation down-regulates the NF-κB pathway
CSC genes preferentially down-regulated by (A) CAY10566 treatment compared to control (DMSO) (> 2.0 fold) or (B) SC-26196 treatment compared to control (DMSO) (> 2.0 fold) were quantified by RT2 Profiler PCR array in OVCAR5 spheroids treated with CAY10566 at 1 μM for 6 days. Pie chart analysis showing the downregulated genes (% of total) for each represented pathway in control vs. treated spheres. (C) NF-κB promoter activity measured by gene reporter assay in OVCAR5, COV362 and primary OC cells spheroids treated with CAY10566 or SC-26196 at 1 μM for 6 days. (D) Proliferation of OVCAR5 and COV362 cells stably transduced with empty vector (pQCXIP) or with pQCXIP/p65 and grown as spheroids. The data are shown as means + SEM; n = 4. (E) RT-PCR measurement of ALDH1A1 in COV362 spheroids stably transduced with empty vector (pQCXIP) or with pQCXIP/p65. (F) RT-PCR measurement of ALDH1A1 mRNA levels in primary OC spheroids treated with NF-κB inhibitor, DMAPT, at indicated concentrations. The data are shown as means + SEM; n = 3. * P < 0.05, ** P < 0.01, *** P < 0.001. See also Figure S7A-B.
Figure 7
Figure 7. NF-κB and ALDH1A1 promote lipid unsaturation
(A) Raman spectral measurement of lipid unsaturation level in OC spheroids treated with the NF-κB inhibitor, DMAPT, at indicated concentrations. n ≥ 10. (B) RT-PCR measurement of SCD1 mRNA levels in primary OC spheroids treated with DMAPT at indicated concentrations. n = 3. (C) ChIP demonstrates that p65 binds the SCD1 promoter region. Immunoprecipitated chromatin with an antibody against p65 was used for quantitative PCR amplification. Primers flanking two predicted p65-binding regions of the SCD1 promoter (−215 to −206 and +179 to +188 bp) were used. Positive control was p65 antibody-immunoprecipitated chromatin amplified with primers for the IL8 promoter, a known p65 target. Negative controls were chromatin immunoprecipitated with IgG and amplified with SCD1 promoter primers and chromatin immunoprecipitated with p65 antibody and amplified with primers to a region in the SCD1 promoter located upstream of the predicted p65 binding sites. (D) Quantitative RT-PCR measured SCD1 mRNA expression levels in COV362 spheroids transfected with pQCXIP vector or pQCXIP/p65. The data are shown as means + SEM; n = 3. (E) Raman spectral measurement of lipid unsaturation level in COV362 spheroids treated with ALDH1A1 inhibitor, CM037, or CM037 and retinoic acid for 6 days. The data are shown as means + SEM; n ≥ 10. * P < 0.05, ** P < 0.01, *** P < 0.001, n.s: not significant. (F) The proposed mechanism by which lipid desaturation is linked to cancer cell stemness. See also Figure S7C-H.

Comment in

References

    1. Bjerkvig R, Tysnes BB, Aboody KS, Najbauer J, Terzis AJA. The origin of the cancer stem cell: current controversies and new insights. Nat Rev Cancer. 2005;5:995–995. - PubMed
    1. Camandola S, Leonarduzzi G, Musso T, Varesio L, Carini R, Scavazza A, Chiarpotto E, Baeuerle PA, Poli G. Nuclear factor kB is activated by arachidonic acid but not by eicosapentaenoic acid. Biochem Biophys Res Commun. 1996;229:643–647. - PubMed
    1. Camp CH, Yegnanarayanan S, Eftekhar AA, Sridhar H, Adibi A. Multiplex coherent anti-Stokes Raman scattering (MCARS) for chemicallysensitive, label-free flow cytometry. Opt Express. 2009;17:22879–22889. - PubMed
    1. Camp JCH, Yegnanarayanan S, Eftekhar AA, Adibi A. Label-free flow cytometry using multiplex coherent anti-Stokes Raman scattering (MCARS) for the analysis of biological specimens. Opt Lett. 2011;36:2309–2311. - PubMed
    1. Cheng J-X, Xie XS. Vibrational spectroscopic imaging of living systems: An emerging platform for biology and medicine. Science. 2015;350:1054. - PubMed

Publication types

MeSH terms