. 2017 Jan 23;40(2):168-184.
doi: 10.1016/j.devcel.2016.12.004. Epub 2016 Dec 29.

Polarity Reversal by Centrosome Repositioning Primes Cell Scattering during Epithelial-to-Mesenchymal Transition

Affiliations

Polarity Reversal by Centrosome Repositioning Primes Cell Scattering during Epithelial-to-Mesenchymal Transition

Mithila Burute et al. Dev Cell. .

Abstract

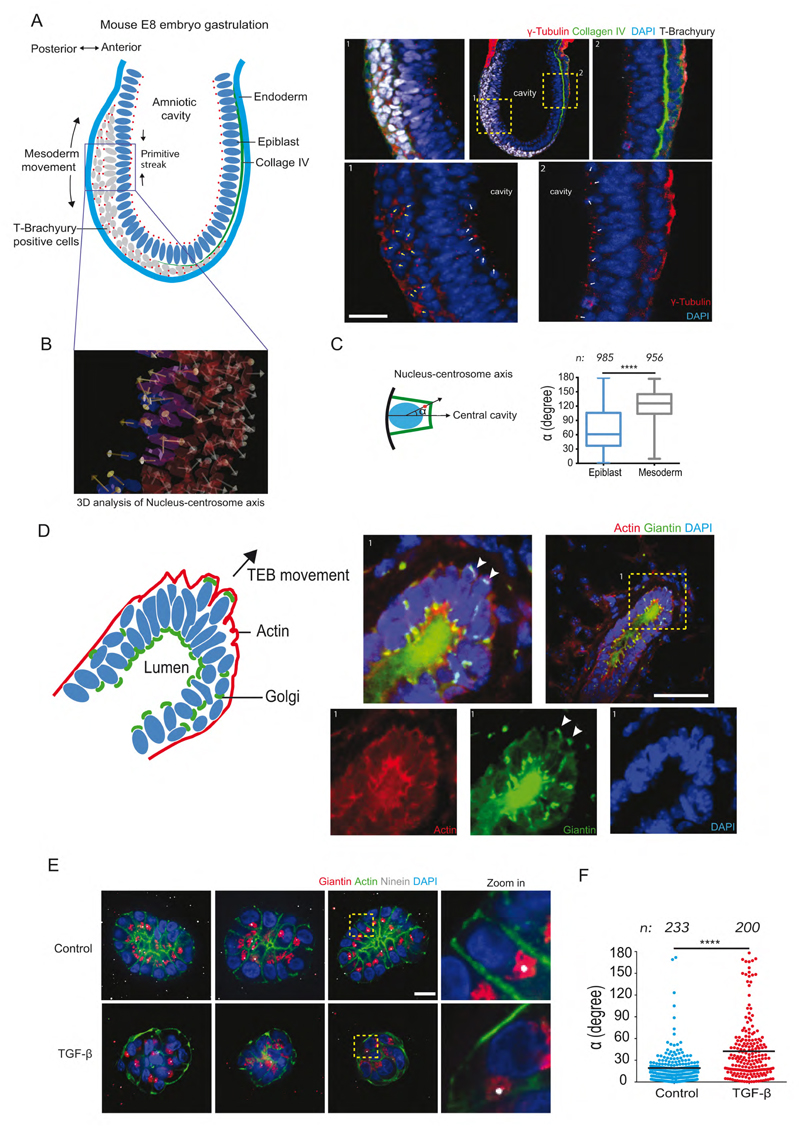
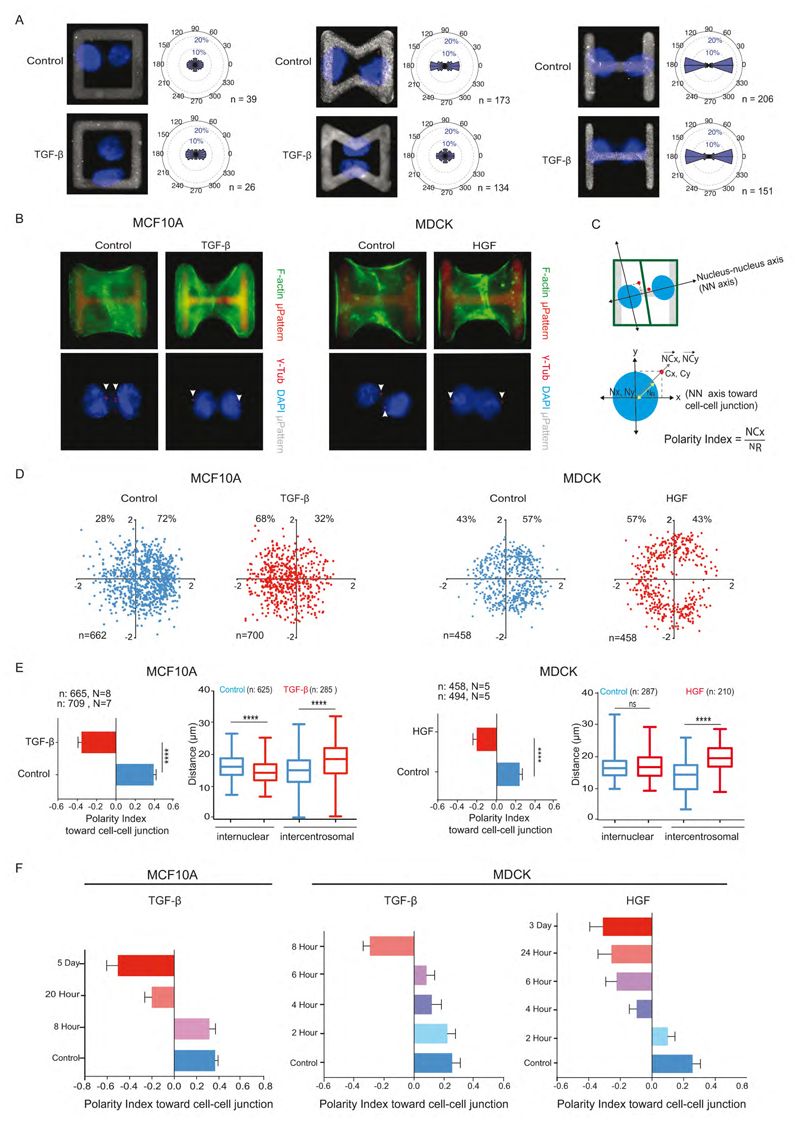
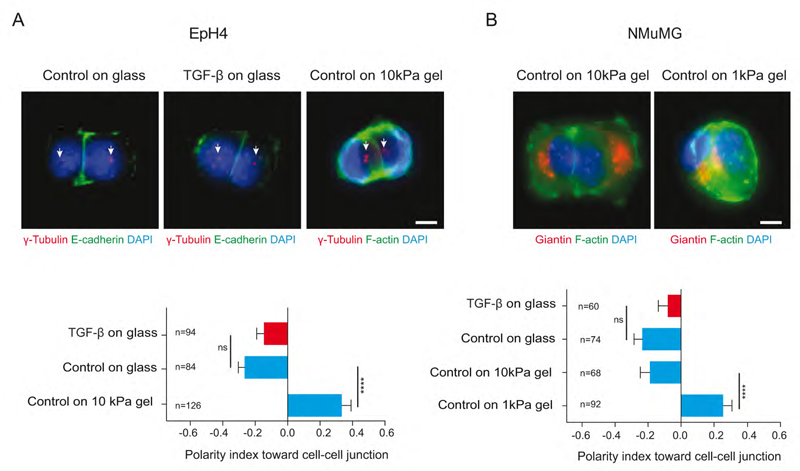
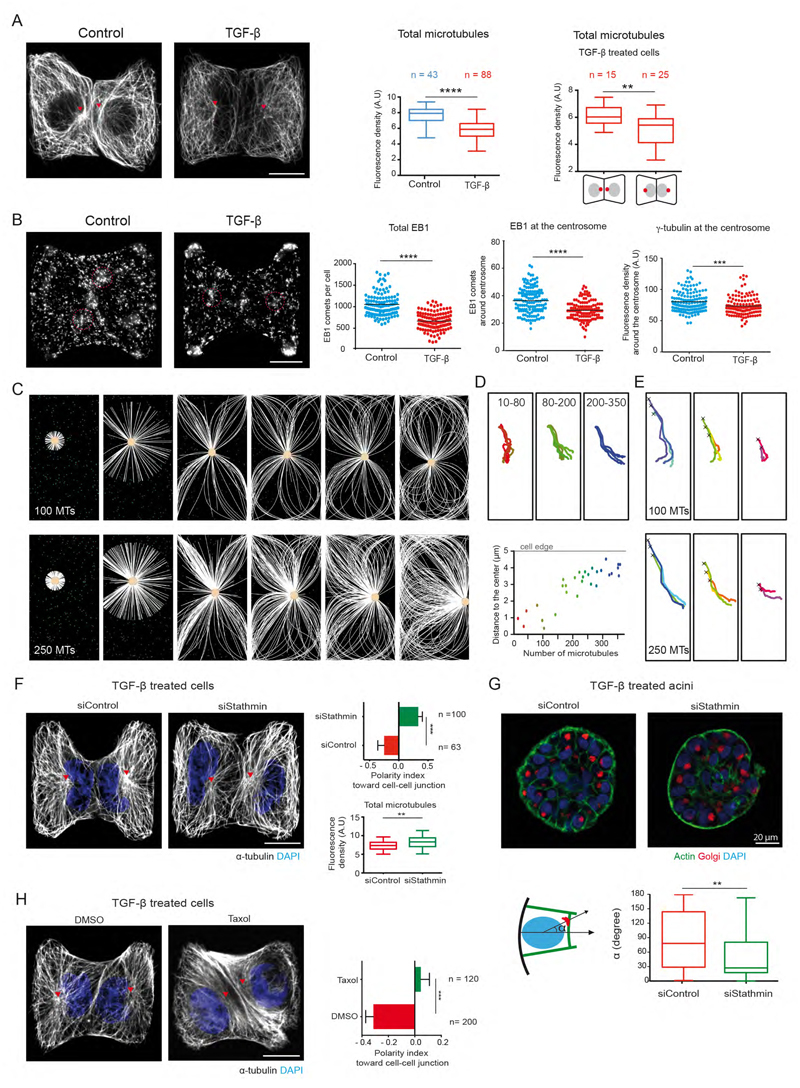
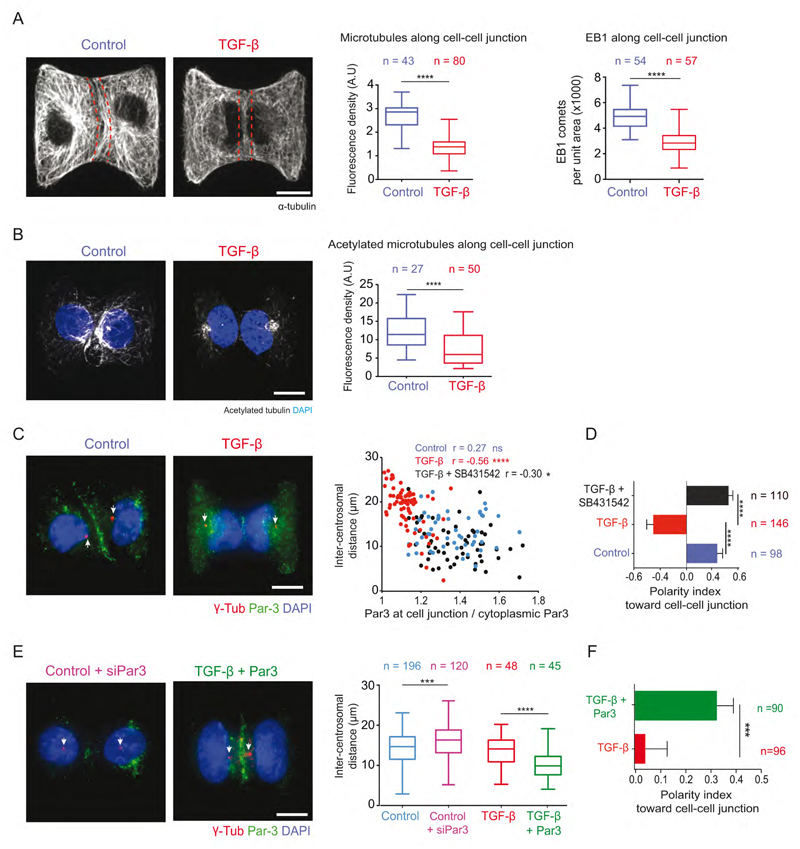
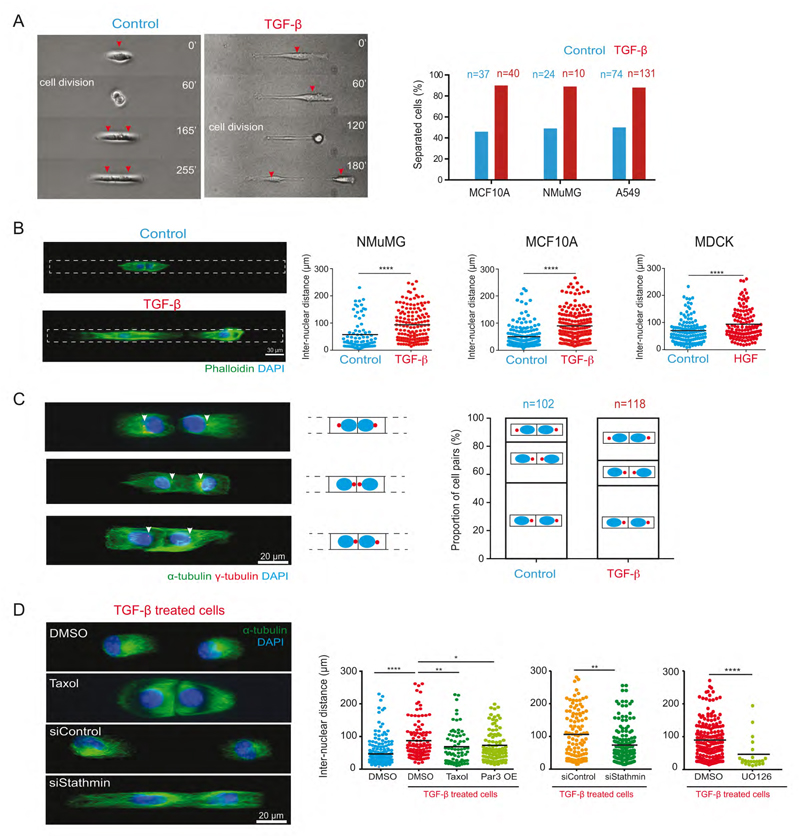
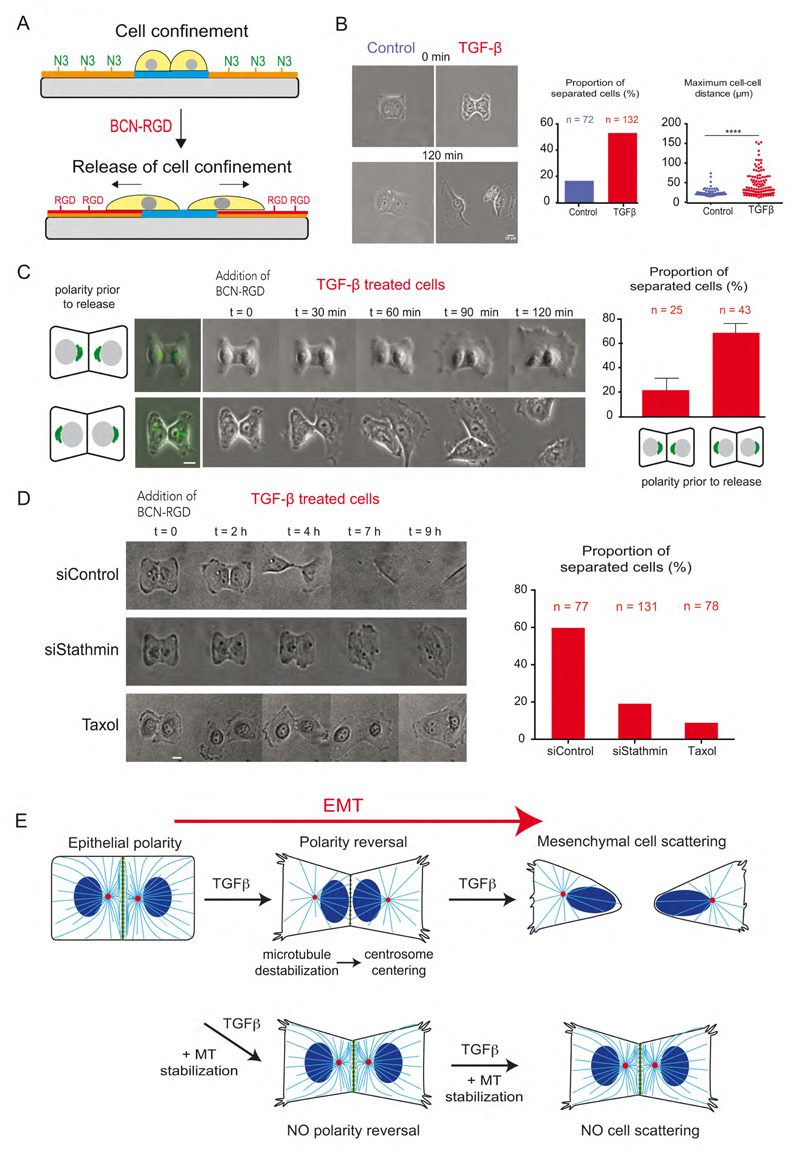
During epithelial-to-mesenchymal transition (EMT), cells lining the tissue periphery break up their cohesion to migrate within the tissue. This dramatic reorganization involves a poorly characterized reorientation of the apicobasal polarity of static epithelial cells into the front-rear polarity of migrating mesenchymal cells. To investigate the spatial coordination of intracellular reorganization with morphological changes, we monitored centrosome positioning during EMT in vivo, in developing mouse embryos and mammary gland, and in vitro, in cultured 3D cell aggregates and micropatterned cell doublets. In all conditions, centrosomes moved from their off-centered position next to intercellular junctions toward extracellular matrix adhesions on the opposite side of the nucleus, resulting in an effective internal polarity reversal. This move appeared to be supported by controlled microtubule network disassembly. Sequential release of cell confinement using dynamic micropatterns, and modulation of microtubule dynamics, confirmed that centrosome repositioning was responsible for further cell disengagement and scattering.

Keywords: EMT; centrosome; cytoskeleton; intercellular junctions; micropatterning; microtubule; migration; polarity; stathmin.


Figures

Figure 1
Figure 1. Evidence of polarity reversal at various stages of mouse development and within 3D organotypic cell culture
(A) Scheme representing germ layers of E8 mouse embryo, site of primitive streak formation and deduced nucleus-centrosome orientations from images in inset 1,2. Inset 1: Posterior end of embryo stained for T-Brachyury (white), γ-tubulin (red) and DAPI (blue). Arrows indicate cells expressing T-Brachyury with nucleus-centrosome axis (white arrows) orientated away from amniotic cavity (marked c). Inset2: Anterior end of E8 mouse showing cells without T-Brachyury and nucleus-centrosome axis pointing toward the amniotic cavity. Scale bar represents 20 μm. (B) 3D analysis of nucleus-centrosome vectors in embryo using 3D image analysis software. (C) Quantification of angle α contained by normal to cell base and nucleus-centrosome vector in mesoderm (T-brachyury positive) and Epiblast (T-brachyury negative) cells. (D) Scheme representing nucleus-Golgi apparatus axis of cells in growing terminal end bud of female mouse mammary gland at 6-7 weeks of age. Inset 1: Merged image of terminal end bud stained for Golgi apparatus (green), F-actin (red) and nucleus (blue). Images of separate channels are below. Scale bar represents 50 μm. (E) Examples of control and TGF-β treated MCF10A 3D cultures (Day7) labeled for Golgi apparatus (green), centrosome (white), F-actin (green) with zoomed and cropped image showing nucleus-centrosome orientation on the right. Scale bar represents 20 μm. (F). Scatter plots show quantification of angle α for control and TGF-β treated MCF10A cells. n represents total number of cells quantified from Control (N=23) and TGF-β (N=25) acini. Two tailed-non-parametric Mann-Whitney test was used, ****: p<0.0001.
Figure 2
Figure 2. Polarity reversal is an early feature of EMT
(A) Images of nuclei (blue) of MCF10A cell doublets on square (i), bowtie (ii) and H-shaped (iii) microcropatterns (grey). Graphs represent angular distribution of nucleus-nucleus axis (NN axis) orientation of cell doublets. n indicates number of cells. (B) MCF10A and MDCK cell doublets on H-shaped micropattern were stained for F-actin (green) (top) or centrosome (red) and DNA (blue) (bottom). (C) Axes system defined by NN axis (X axis) passing through center of nuclei of cell doublets and an axis perpendicular to NN axis (Y axis). Normalized nucleus-centrosome vector coordinates (NCx, NCy) were calculated by subtracting coordinates of centrosome (Cx, Cy) from Nucleus (Nx, Ny) and normalized by the nucleus distance (NR). (D) Scatter plot of normalized NC vector. The total number of cells and the respective proportions (%) on positive and negative x-axis are indicated. (E) Horizontal histograms show the quantification of polarity index, i.e normalized X coordinate of NC vector. N indicates the number of independent experiments, whereas n indicates the total number of single cells. Vertical box plots show the quantification of inter-nuclear and inter-centrosome distance. (F) Polarity index toward cell-cell junction in control (blue) after varying the duration of TGF-β treatment and HGF treatment to MCF10A and MDCK cells. Two tailed-non-parametric Mann-Whitney tests were used. ****: p<0.0001. Error bars indicate SEM. See also Figure S2 and S3.
Figure 3
Figure 3. Matrix stiffness promotes polarity reversal
(A) Images of control and TGF-β treated EpH4 cell doublets on H-shaped glass micropattern stained for E-cadherin (green), centrosome (red and white arrows) and DNA (blue). Cell doublets on Polyacrylamide gel were labeled for F-actin (green). (B) Control NMuMG cells on glass and polyacrylamide gels are stained for Giantin (Golgi apparatus marker) (red), F-actin(green) and DNA (blue). Horizontal histograms show quantification of polarity index toward cell-cell junction. Scale bars represent 5 μm. Errors bar indicate SEM. Two tailed-non-parametric Mann-Whitney tests were used. ****: p<0.0001. Error bars indicate SEM.
Figure 4
Figure 4. Microtubule network remodeling accompanies centrosome re-centering during EMT
(A) Images of control and TGF-β treated MCF10A cell-doublets on H-shaped micropattern stained for a-tubulin. Box plot shows quantification of total microtubule density on left. Microtubule density in two populations TGF-β treated cells with different nucleus-centrosome axis polarity on right. (AU is arbitrary fluorescence units). (B) Images of MCF10A cell-doublets stained for EB1. Scatter plots show quantification of total EB1 comets, EB1 comets at the centrosome and γ-tubulin at the centrosome. A circular region of interest of 1.5 μm radius (red dotted circle) was used to count EB1 comets and γ-tubulin intensity at the centrosome. (C) Numerical simulation showing microtubules (white) and centrosome (yellow) motion in response to varying microtubules number in a rectangular cell. Green dots correspond to cytoplasmic dynein (green). (D) Effect of varying microtubule number on centrosome trajectory to final position. Different colors represent different microtubule number. Graph represents relationship between number of microtubules and the final position of the centrosome relative to cell center. (E) Centrosome trajectories when starting from various initial positions (marked by cross) for either 100 (top) or 250 (bottom) microtubules. (F) Images of TGF-β treated and stathmin knocked down cells with microtubules (white), nuclei (blue). Total Microtubule density (Arbitrary units) of stathmin knocked down cells. Scale bar (A-F) is 10 μm (G) Images of TGF-β treated acini transfected with siRNA. Nucleus-golgi axis orientation (α) with respect to normal to the base of acini is quantified. (H) Images of TGF-β treated cells with 5 hours of Taxol treatment. Polarity index is quantified on right. Scale bar is 10 μm. Two tailed-non-parametric Mann-Whitney tests were used. ***: p<0.001, ****: p<0.0001.
Figure 5
Figure 5. Par3 regulates centrosome position during EMT
(A) Microtubule density and EB1 comets at the cell-cell junction are measured within the area indicated by red dotted lines of MCF10A cells on H-micropattern. AU is arbitrary units. (B) Density of acetylated microtubules was measured at the cell-cell junction in the area marked by red dotted lines in panel (A). (C) Par3 (green), γ-tubulin (red) and DNA (blue) staining of MCF10A cells. Central graph shows the relationship between Par3 enrichment at cell-cell junction and inter-centrosome distance. Pearson's correlation test r, ****: p<0.001, *: p<0.1, ns>0.1. (D) Vertical histograms show measurement of polarity index toward cell-cell junction. (E) Image of Par3 siRNA treated control cells and TGF-β treated cells with Par3 overexpression, labeled for Par3 (green), centrosome (red) and DNA (blue). Box plots show quantification of inter-centrosome distance. (F) Horizontal histogram shows quantification of cell polarity index toward cell-cell junction. Arrows point at centrosomes. Scale bars represent 10 μm. Errors bar indicate SEM. Two tailed-non-parametric Mann-Whitney test were used ***:p<0.001, ****:p<0.0001.
Figure 6
Figure 6. Centrosome repositioning promotes cells scattering during EMT
(A) Time-lapse sequence NMuMG cells (red arrows) on micro-patterned lines. Quantification of the proportion of cell separation in control and TGF-β treated cells for various cell types. n indicates number events measured for cell separation. (B) Images of fixed NMuMG cells labeled for F-actin (green) and nucleus (blue) on micropatterned tracks of 300 μm. Histograms show the quantification of inter-nuclear distance between cell pairs of different cell lines. (C) Images of TGF-β treated MCF10A cell-pairs on micropatterned tracks in different configurations of nucleus-centrosome axis orientation. Arrows indicate centrosomes. The proportion of each configuration is quantified on right. (D) Images of TGF-β treated MCF10A cell-pairs in the presence of DMSO or Taxol (5 hours of treatment) and cells transfected with control or stathmin siRNA. On the right inter-nuclear distances between the cell-pairs are quantified.
Figure 7
Figure 7. Polarity reversal is necessary for cell scattering
(A) Schematic depicting principle of dynamic micropatterning with azide-PLL-PEG (orange) and cell motion on BCN-RGD modified substrate (red). (B) Images of cells on H-shaped micropattern before and after modification of BCN-RGD modified substrate. Histograms show measurement of the proportion of cell separation and maximum inter-nuclear distance between the MCF10A cells two hours after addition of BCN-RGD. (C) Time-lapse sequence images of TGF-β treated MCF10A cells expressing Golgi apparatus markers (visualized in green at t=0) in response to the addition of BCN-RGD. Histogram shows measurement of the proportion of cell separation depending on their initial polarity orientation. Scale bar is 10 μm. (D) Time-lapse image sequence of TGF-β treated MCF10A cells with stathmin knockdown or Taxol treatment. Their cell separation post 20 hours of BCN-RGD addition was quantified on right. Scale bar is 10 μm. (E) Schematic description of microtubule reorganization and centrosome repositioning that causes polarity reversal and finally cell separation during the course of EMT.

Similar articles

Cited by

References

    1. Acloque H, Adams MS, Fishwick K, Bronner-Fraser M, Nieto MA. Epithelial-mesenchymal transitions: the importance of changing cell state in development and disease. J Clin Invest. 2009;119:1438–1449. - PMC - PubMed
    1. Akhmanova A, Stehbens SJ, Yap AS. Touch, grasp, deliver and control: functional cross-talk between microtubules and cell adhesions. Traffic. 2009;10:268–274. - PubMed
    1. Akhtar N, Streuli CH. An integrin-ILK-microtubule network orients cell polarity and lumen formation in glandular epithelium. Nat Cell Biol. 2013;15:17–27. - PMC - PubMed
    1. Anstrom JA, Raff RA. Sea urchin primary mesenchyme cells: Relation of cell polarity to the epithelial-mesenchymal transformation. Dev Biol. 1988;130:57–66. - PubMed
    1. Azioune A, Carpi N, Tseng Q, Théry M, Piel M. Protein micropatterns: A direct printing protocol using deep UVs. Methods Cell Biol. 2010;97:133–146. - PubMed

Substances