. 2017 Feb 7;25(2):412-427.
doi: 10.1016/j.cmet.2016.11.009. Epub 2016 Dec 29.

SREBP1 Contributes to Resolution of Pro-inflammatory TLR4 Signaling by Reprogramming Fatty Acid Metabolism

Affiliations

SREBP1 Contributes to Resolution of Pro-inflammatory TLR4 Signaling by Reprogramming Fatty Acid Metabolism

Yumiko Oishi et al. Cell Metab. .

Abstract

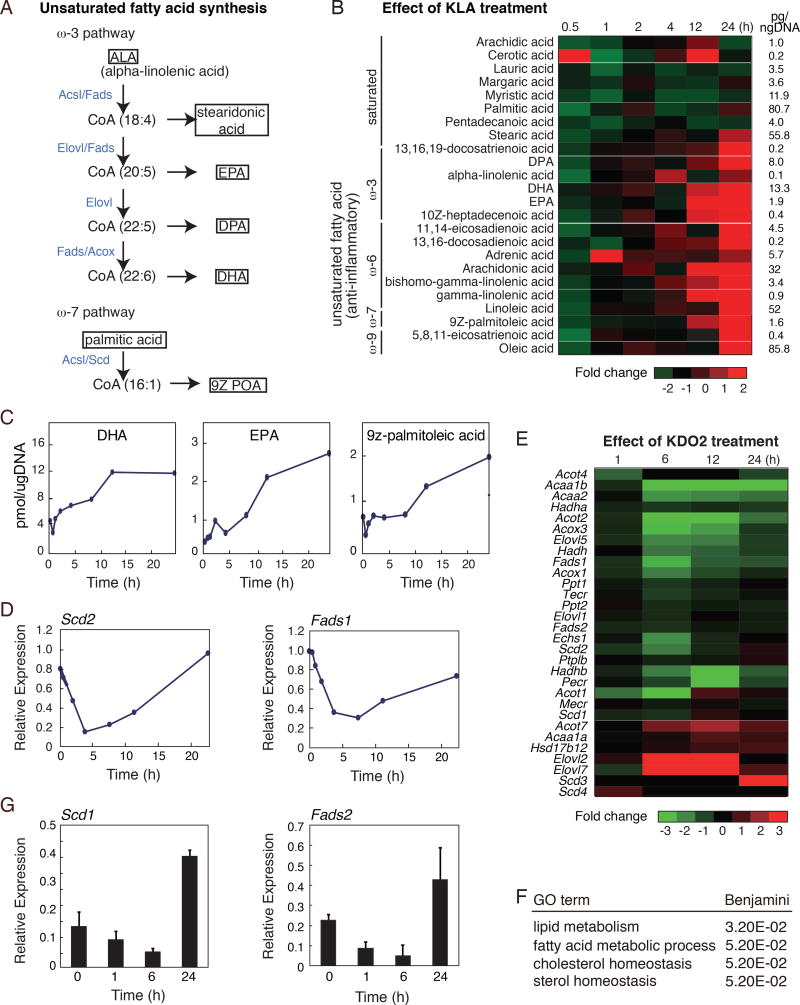
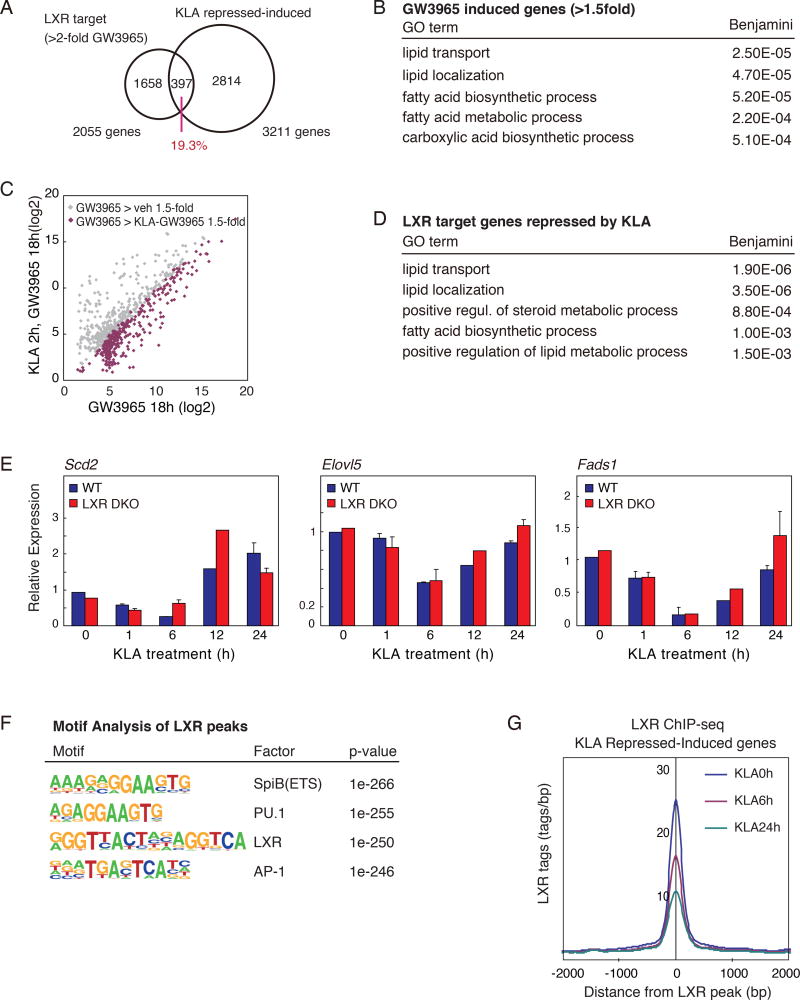
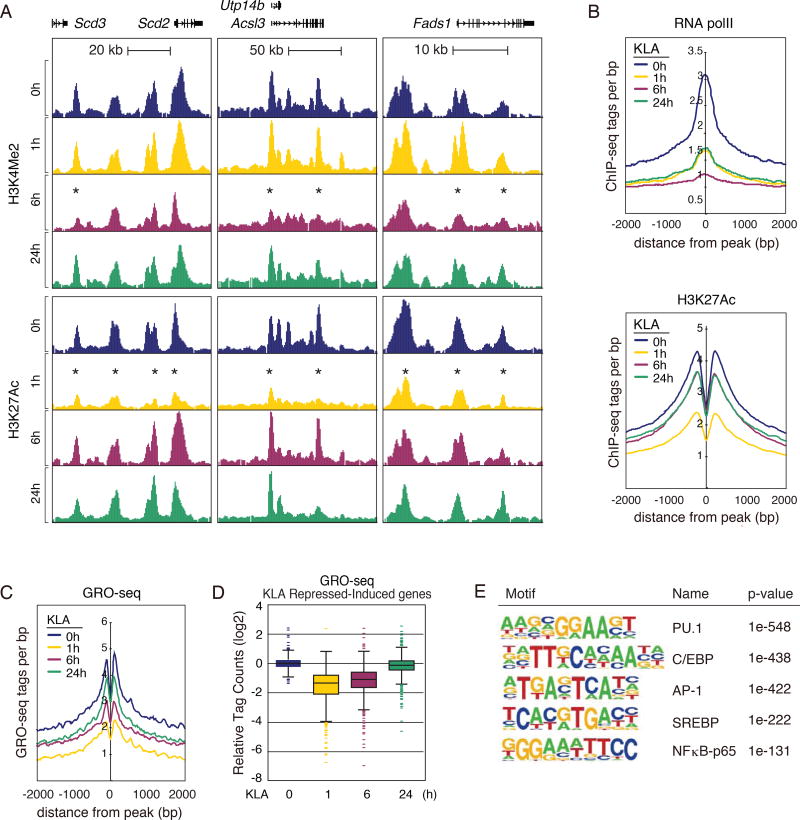
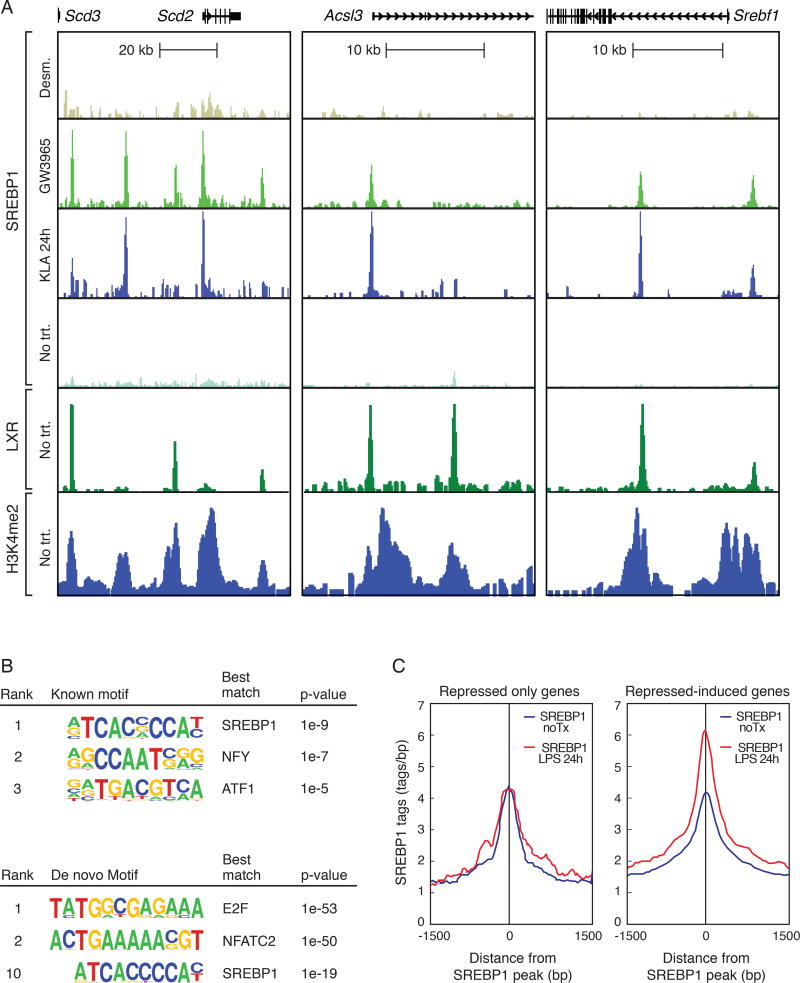
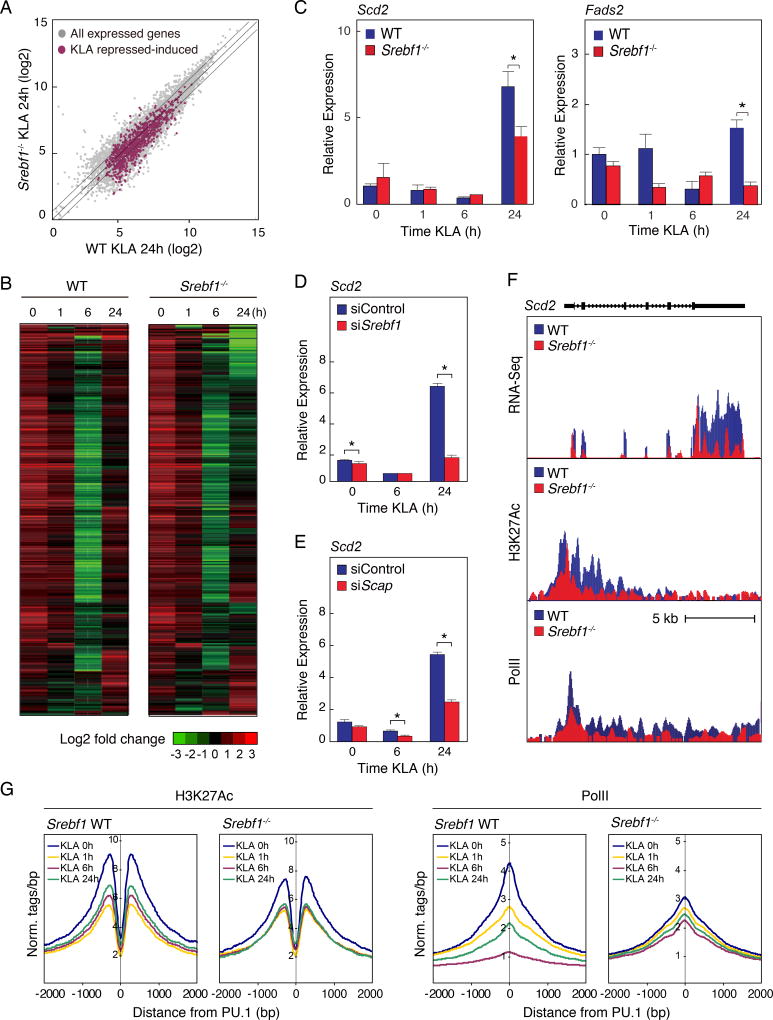
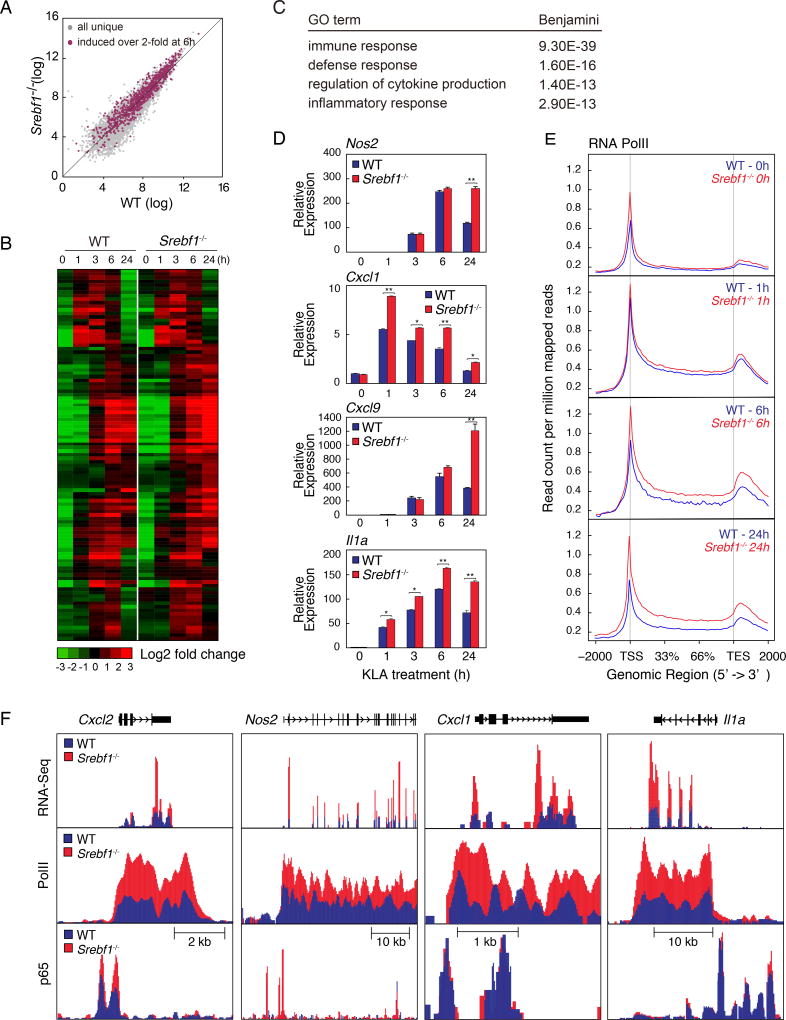
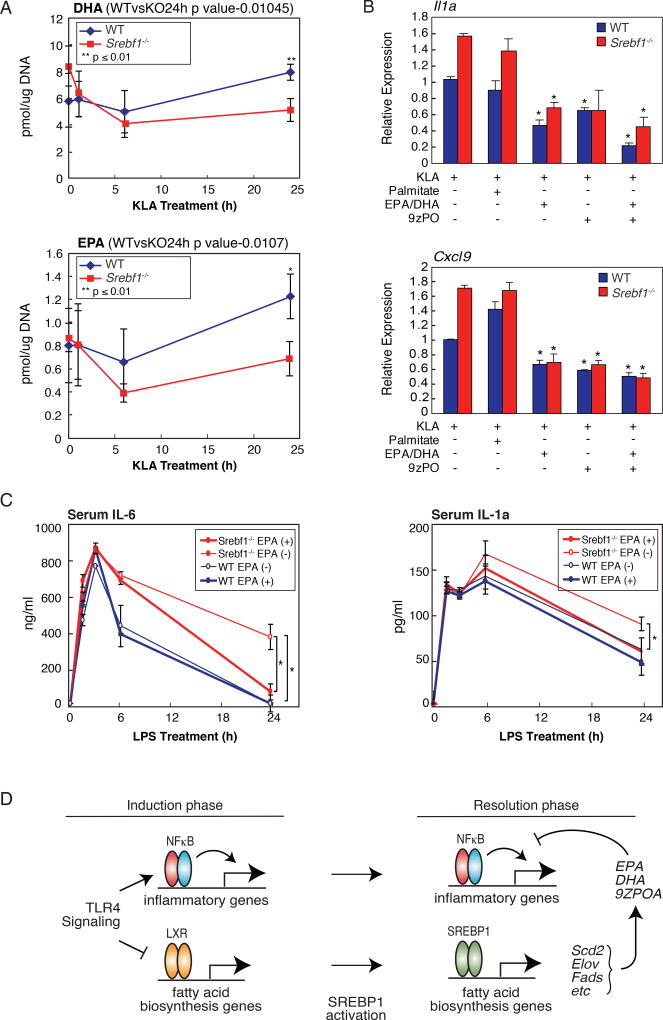
Macrophages play pivotal roles in both the induction and resolution phases of inflammatory processes. Macrophages have been shown to synthesize anti-inflammatory fatty acids in an LXR-dependent manner, but whether the production of these species contributes to the resolution phase of inflammatory responses has not been established. Here, we identify a biphasic program of gene expression that drives production of anti-inflammatory fatty acids 12-24 hr following TLR4 activation and contributes to downregulation of mRNAs encoding pro-inflammatory mediators. Unexpectedly, rather than requiring LXRs, this late program of anti-inflammatory fatty acid biosynthesis is dependent on SREBP1 and results in the uncoupling of NFκB binding from gene activation. In contrast to previously identified roles of SREBP1 in promoting production of IL1β during the induction phase of inflammation, these studies provide evidence that SREBP1 also contributes to the resolution phase of TLR4-induced gene activation by reprogramming macrophage lipid metabolism.

Keywords: DHA; EPA; SREBP1; fatty acid metabolism; inflammation; innate immunity; lipid metabolism; resolution; transcriptional regulation; unsaturated fatty acids.


Figures

Figure 1
Figure 1. Activation of TLR4 reprograms macrophage fatty acid metabolism
A. Pathway maps illustrating omega-3 and −9 pathways. Enzymes catalyzing each step are highlighted in blue. B. Lipidomic analysis of saturated and unsaturated fatty acids (omega-3, −6, −7 and −9) in thioglycollate-elicited macrophages treated with KLA for 0, 1, 6, 12, 24 hours. C. Cellular content of omega-3 (DHA and EPA) and omega-7 (9Z-POA) fatty acids in thioglycollate-elicited macrophages treated with KLA for 0, 1, 6, 12, 24 hours. D. Relative mRNA expression levels for Scd2 and Fads1 determined by microarray analysis of RNA from thioglycollate-elicited macrophages treated with KLA for 0, 1, 6, 24 hours. E. Heat map of mRNA expression levels determined by RNA-Seq analysis of bone marrow-derived macrophages with KLA for 0, 1, 6, 24 hours (FDR < 0.01, RPKM > 0.5). F. Functional annotations associated with genes exhibiting KLA repressed-induced temporal expression patterns. G. Relative mRNA expression of Scd2 and Fads2 in human monocyte-derived macrophages treated with KLA for 0, 1, 6, and 24 hours. Values are expressed as mean ± SEM. *p<0.05, **p<0.01. See also Figure S1.
Figure 2
Figure 2. Genes required for anti-inflammatory fatty acid synthesis demonstrate biphasic temporal expression patterns following TLR4 ligation
A. Venn diagram of overlap between LXR target genes (GW3965 induced genes >2-fold vs untreated) and KLA repressed-induced genes. B. Functional annotations associated with LXR target genes induced by GW3965 treatment. C. Scatter plot depicting the relationship between fold change of LXR target genes (GW3965 > 1.5-fold vs. untreated) comparing RNA-Seq data from thioglycollate-elicited macrophages treated with GW3965 (18 hours), with or without KLA pretreatment (100ng/ml for 2 hours). D. Functional annotations associated with LXR target genes repressed by KLA treatment. E. Scd2, Elovl5 and Fads1 mRNA expression in LXRα/β−/− and WT thioglycollate-elicited macrophages treated with KLA for 0, 1, 6, 12, and 24 hours. F. De novo motif analysis of LXR peaks in WT thioglycollate-elicited macrophages. G. Normalized distribution LXR ChIP-Seq tag density, at enhancers vicinal to KLA repressed-induced genes, in thioglycollate-elicited macrophages treated with KLA for 0, 1, 6, 24 hours. See also Figure S2.
Figure 3
Figure 3. Temporal dynamics of cis-reglatory elements associated with KLA repressed-induced genes
A. UCSC genome browser images illustrating normalized tag counts for H3K4Me2 and H3K27Ac, at the LXR target genes in bone marrow-derived macrophages treated with KLA for 0, 1, 6 and 24 hours. B. Distribution of RNA Pol II and H3K27Ac tag densities in vicinity of KLA repressed-induced enhancers in bone marrow-derived macrophages treated with KLA for 0, 1, 6, 24 hours. C. Distribution of GRO-Seq tags at KLA repressed-induced enhancers in thioglycollate-elicited macrophages treated with KLA for 0, 1, 6, 24 hours. D. Relative distribution of GRO-Seq tags at gene bodies of KLA repressed-induced genes in thioglycollate-elicited macrophages treated with KLA for 0, 1, 6, 24 hours. E. Sequence motifs enriched at enhancers associated with KLA repressed-induced genes.
Figure 4
Figure 4. SREBP1 is recruited to repressed-induced enhancers during the resolution phase of the inflammatory response
A. UCSC genome browser images illustrating normalized tag counts for SREBP1, LXR and H3K4Me2, at indicated loci, in thioglycollate-elicited macrophages treated with vehicle, KLA, GW3965, or desmosterol for 24 hours. B. Known and de novo motifs identified in regions bound by SREBP1 in the late inflammatory response. For ChIP-seq peaks used in motif analysis, peaks for each SREBP ChIP were identified using Homer and calculated the Irreproducible Discovery Rate (IDR) to measure the consistency between replicate experiments for the strength of binding at each loci and retained SREBP1 peaks with IDR < 0.05. C. Distribution of SREBP1 tag densities, at enhancers associated with genes exhibiting either repressed-repressed or repressed-induced temporal expression patterns, in thioglycollate-elicited macrophages treated with KLA for 24 hours. See also Figure S3.
Figure 5
Figure 5. Srebf1−/− macrophages exhibit reduced fatty acid biosynthetic gene expression during the resolution phase of the TLR4 response
A. Scatter plot depicting the relationship between fold change of KLA repressed-induced genes, comparing RNA-seq from wild-type (WT) versus Srebf1−/− bone marrow-derived macrophages treated with KLA for 24 hours. Gray dots show all expressed genes. Red dots represent all KLA repressed-induced genes. B. Hierarchical clustering and heatmap of the fold change in expression levels of KLA repressed-induced genes in WT and Srebf1−/− bone marrow-derived macrophages treated with KLA for the indicated times (FDR < 0.01, RPKM > 0.5). C. Relative mRNA expression of Scd2 and Fads2 in WT and Srebf1−/− bone marrow-derived macrophages treated with KLA for the indicated times. D. Relative mRNA expression of Scd2 mRNA KLA-treated thioglycollate-elicited macrophages, transfected with siRNA control or targeting Srebf1. E. Relative mRNA expression of Scd2 mRNA KLA-treated thioglycollate-elicited macrophages, transfected with siRNA control or targeting Scap. F. Distribution of RNA-Seq, H3K27ac and RNA Pol II tag densities at the Scd2 locus in WT and Srebf1−/− bone marrow-derived macrophages treated with KLA for 24 hours. G. Distribution of H3K27Ac and RNA Pol II tag densities in the vicinity of enhancers associated with KLA repressed-induced genes in WT and Srebf1−/− bone marrow-derived macrophages treated with KLA for the indicated times. Values are expressed as mean ± SEM. *p<0.05, **p<0.01. See also Figure S4.
Figure 6
Figure 6. Srebf1−/− macrophages exhibit a hyper-inflammatory phenotype
A. Scatter plot depicting the relationship between fold change of KLA induced-repressed genes, comparing RNA-seq from wild-type versus Srebf1−/− bone marrow-derived macrophages treated with KLA for 24 hours. Gray dots show all uniquely expressed genes. Red dots represent all KLA induced-repressed genes. B. Hierarchical clustering and heatmap of the fold change in expression levels of KLA induced-repressed genes, comparing RNA-seq data from WT and Srebf1−/− bone marrow-derived macrophages treated with KLA for 24 hours (FDR < 0.01, RPKM > 0.5). C. Functional annotations associated with KLA induced-repressed genes. D. Relative mRNA expression of inflammatory genes in WT and Srebf1−/− bone marrow-derived macrophages treated with KLA for the indicated times. E. Distribution of RNA pol II tag densities at loci of KLA induced-repressed genes WT and Srebf1−/− bone marrow-derived macrophages treated with KLA for indicated times. F. UCSC genome browser image illustrating normalized tag counts for RNA-seq, RNA Pol II and p65 ChIP-seq at loci of inflammatory genes in WT and Srebf1−/− bone marrow-derived macrophages treated with KLA for the indicated times. Values are expressed as mean ± SEM. *p<0.05, **p<0.01. See also Figure S5.
Figure 7
Figure 7. SREBP1 is necessary for resolution of inflammation by driving appropriate macrophage production of anti-inflammatory unsaturated fatty acids in late inflammatory response
A. Lipidomics analysis of unsaturated fatty acid (EPA and DHA 9Z–PO) levels in KLA treated WT and Srebf1−/− bone marrow-derived macrophages. B. Relative mRNA expression of inflammatory genes in WT and Srebf1−/− bone marrow-derived macrophages treated with KLA for 24 hours, with or without supplementation with the indicated exogenous fatty acids (20µM) at 12h post KLA treatment. C. Serum levels of cytokines IL-6 and IL-1a, as quantified by ELISA, in WT and Srebf1−/− mice treated with 5mg/kg LPS for 0, 1, 3, 6, 24 hours, with or without EPA supplementation as indicated. D. Model for integrated actions of NFκB, LXRs and SREBP1 during the induction and resolution phases of the TLR4 response. Values are expressed as mean ± SEM. *p<0.05, **p<0.01. See also Figure S6.

References

    1. Calkin AC, Tontonoz P. Transcriptional integration of metabolism by the nuclear sterol-activated receptors LXR and FXR. Nat Rev Mol Cell Biol. 2012;13:213–224. - PMC - PubMed
    1. Cao H, Gerhold K, Mayers JR, Wiest MM, Watkins SM, Hotamisligil GS. Identification of a lipokine, a lipid hormone linking adipose tissue to systemic metabolism. Cell. 2008;134:933–944. - PMC - PubMed
    1. Castrillo A, Joseph SB, Vaidya SA, Haberland M, Fogelman AM, Cheng G, Tontonoz P. Crosstalk between LXR and toll-like receptor signaling mediates bacterial and viral antagonism of cholesterol metabolism. Mol Cell. 2003;12:805–816. - PubMed
    1. Cildir G, Akincilar SC, Tergaonkar V. Chronic adipose tissue inflammation: all immune cells on the stage. Trends Mol Med. 2013;19:487–500. - PubMed
    1. Creyghton MP, Cheng AW, Welstead GG, Kooistra T, Carey BW, Steine EJ, Hanna J, Lodato MA, Frampton GM, Sharp PA, et al. Histone H3K27ac separates active from poised enhancers and predicts developmental state. Proc Natl Acad Sci U S A. 2010;107:21931–21936. - PMC - PubMed

Publication types

MeSH terms