. 2017 Jan 1;7(1):180-195.
doi: 10.7150/thno.17133. eCollection 2017.

Exosomes derived from miR-140-5p-overexpressing human synovial mesenchymal stem cells enhance cartilage tissue regeneration and prevent osteoarthritis of the knee in a rat model

Affiliations

Exosomes derived from miR-140-5p-overexpressing human synovial mesenchymal stem cells enhance cartilage tissue regeneration and prevent osteoarthritis of the knee in a rat model

Shi-Cong Tao et al. Theranostics. .

Abstract

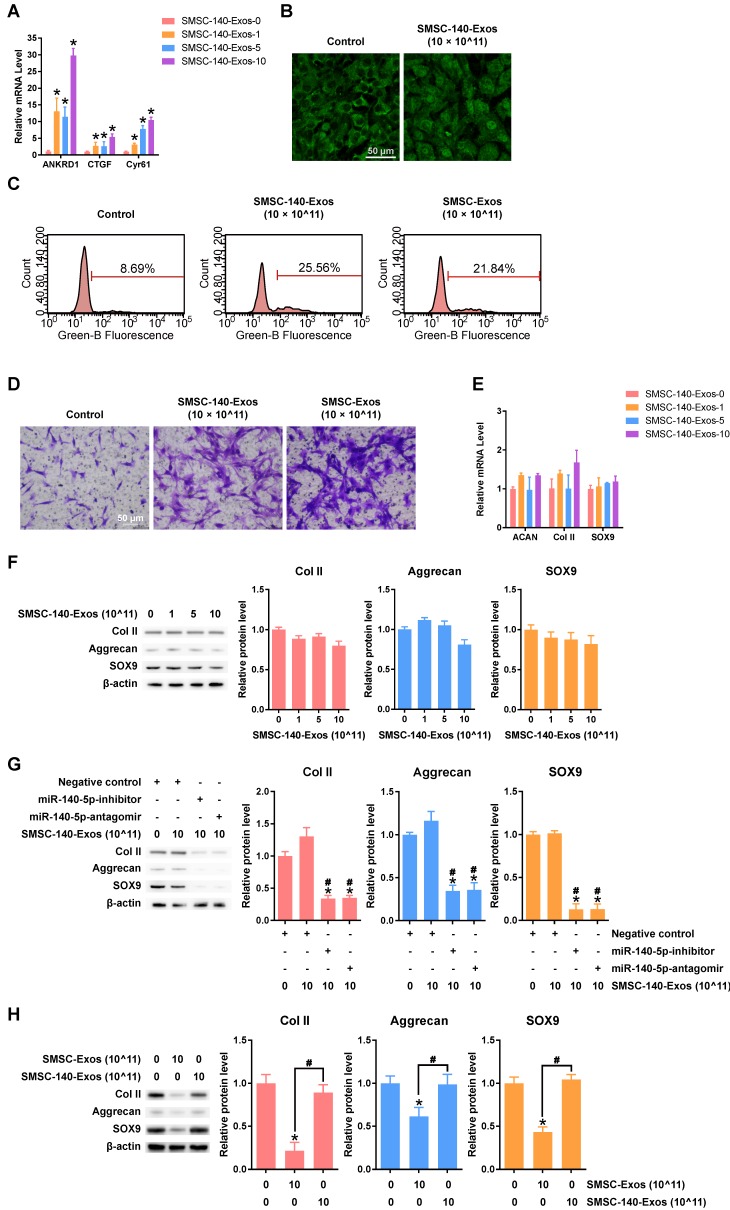
Objectives: Osteoarthritis (OA) is the most common joint disease throughout the world. Exosomes derived from miR-140-5p-overexpressing synovial mesenchymal stem cells (SMSC-140s) may be effective in treating OA. We hypothesized that exosomes derived from SMSC-140 (SMSC-140-Exos) would enhance the proliferation and migration abilities of articular chondrocytes (ACs) without harming extracellular matrix (ECM) secretion.

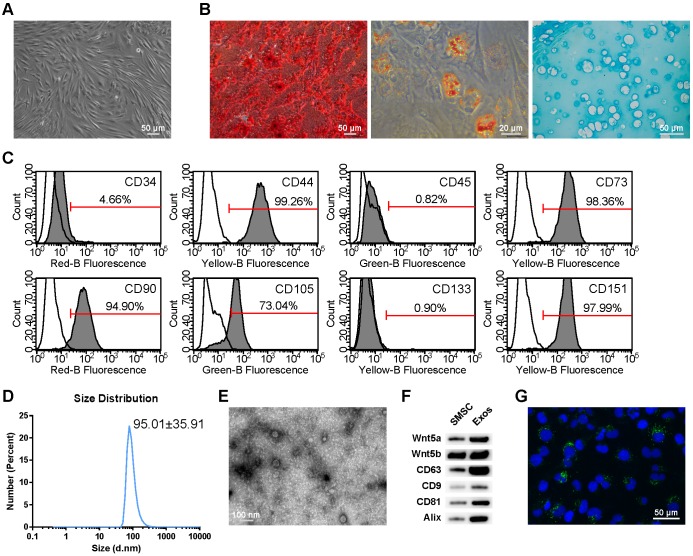
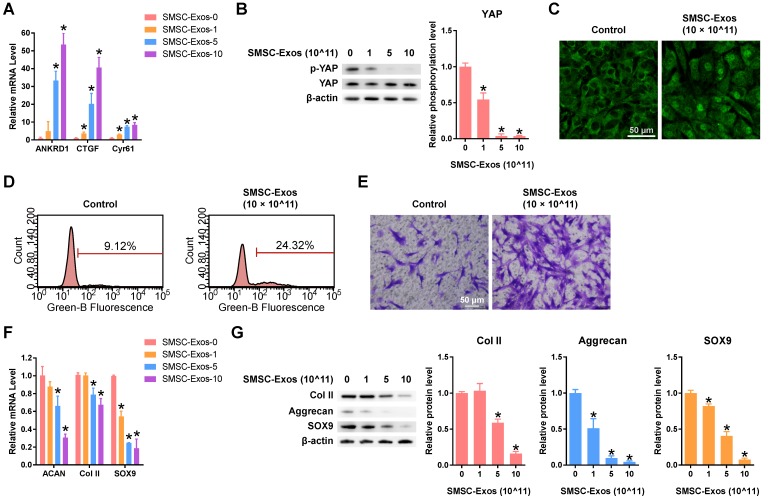
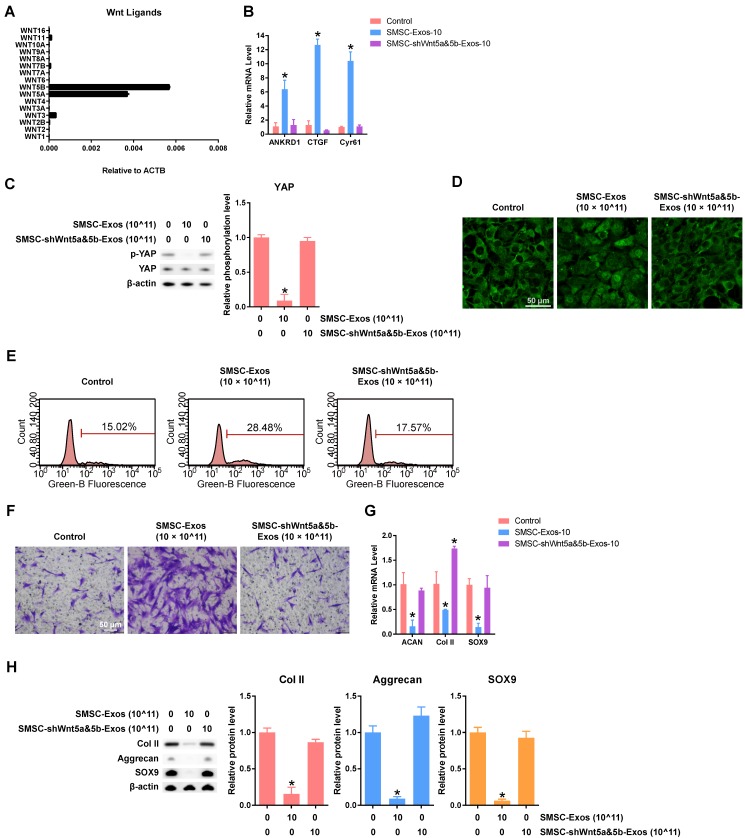
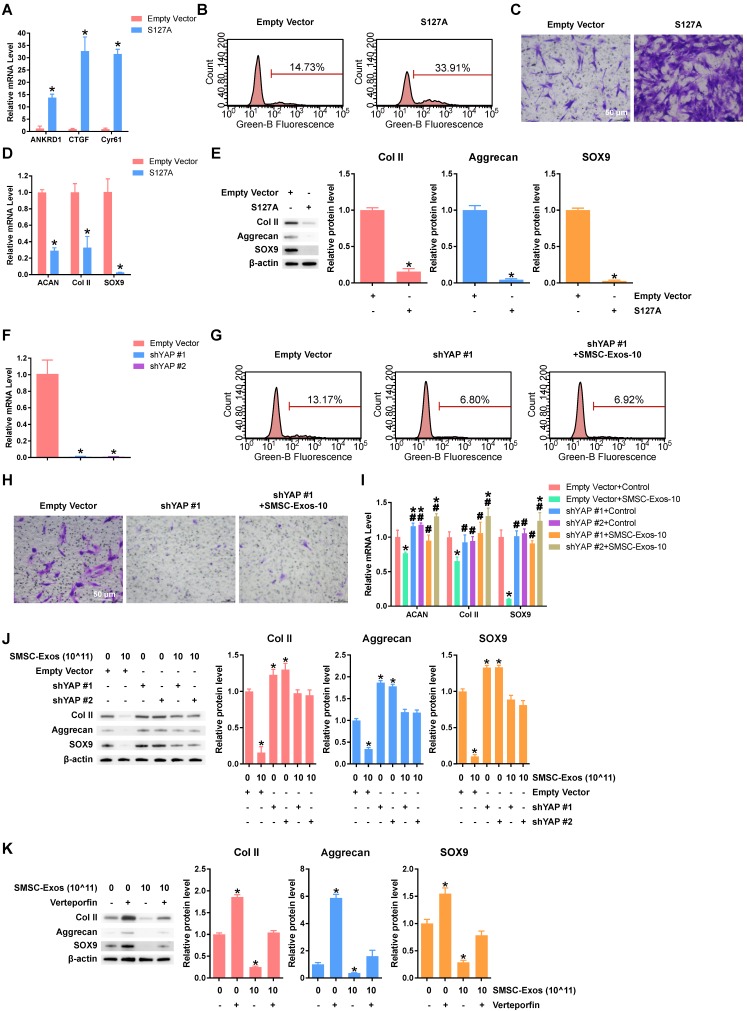
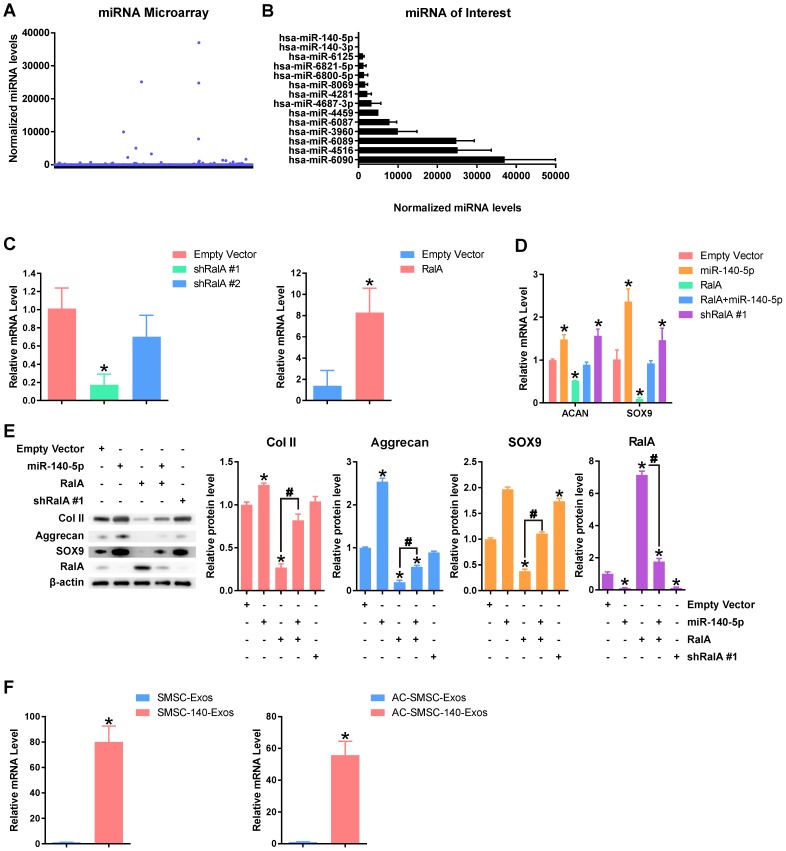
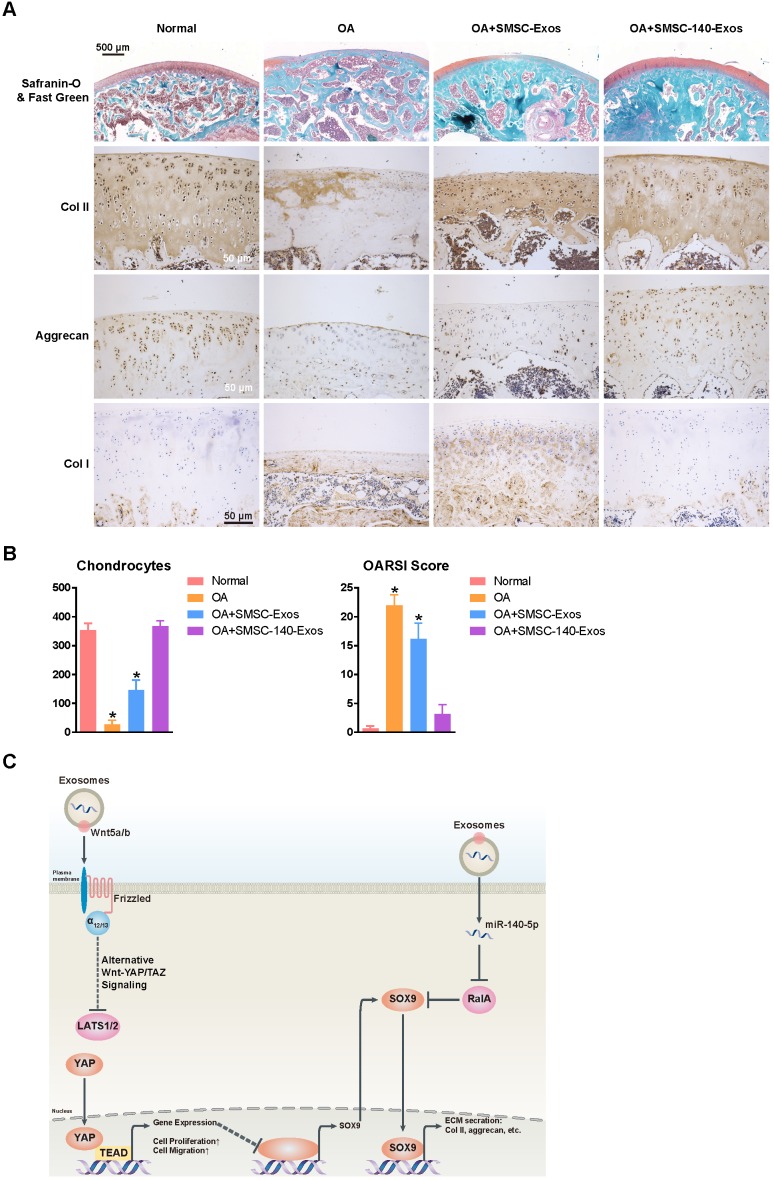
Methods: SMSCs were transfected with or without miR-140-5p. Exosomes derived from SMSCs or SMSC-140s (SMSC-Exos or SMSC-140-Exos) were isolated and identified. Proliferation, migration and ECM secretion were measured in vitro and compared between groups. The mechanism involving alternative Wnt signalling and activation of Yes-associated protein (YAP) was investigated using lentivirus, oligonucleotides or chemical drugs. The preventative effect of exosomes in vivo was measured using Safranin-O and Fast green staining and immunohistochemical staining.

Results: Wnt5a and Wnt5b carried by exosomes activated YAP via the alternative Wnt signalling pathway and enhanced proliferation and migration of chondrocytes with the side-effect of significantly decreasing ECM secretion. Highly-expressed miR-140-5p blocked this side-effect via RalA. SMSC-140-Exos enhanced the proliferation and migration of ACs without damaging ECM secretion in vitro, while in vivo, SMSC-140-Exos successfully prevented OA in a rat model.

Conclusions: These findings highlight the promising potential of SMSC-140-Exos in preventing OA. We first found a potential source of exosomes and studied their merits and shortcomings. Based on our understanding of the molecular mechanism, we overcame the shortcomings by modifying the exosomes. Such exosomes derived from modified cells hold potential as future therapeutic strategies.

Keywords: Osteoarthritis; Yes-associated protein; exosomes; extracellular matrix; miR-140-5p.; synovial mesenchymal stem cells.


Conflict of interest statement

The authors have declared that no competing interest exists.

Figures

Figure 1
Figure 1
Classification of human synovial mesenchymal stem cells (SMSCs) and exosomes. (A) SMSCs exhibited a representative spindle-like morphology (scale bar: 50 μm). (B) SMSCs showed multi-potential differentiation capacity for osteogenesis (scale bar: 50 μm), adipogenesis (scale bar: 20 μm) and chondrogenesis (scale bar: 50 μm). (C) Flow cytometric analysis of characteristic cell surface markers of SMSCs. Unfilled curves represent isotype controls and solid grey curves represent measured surface markers (CD34, CD44, CD45, CD73, CD90, CD105, CD133 and CD151). This experiment was repeated independently three times. (D) Particle size distribution of exosomes measured by dynamic light scattering (DLS). This experiment was repeated independently three times and representative results are shown. (E) Morphology of exosomes observed by transmission electron microscopy (TEM). Scale bar: 100 nm. (F) Exosome surface markers (Alix, CD81, CD9, and CD63) and carried proteins (Wnt5a and Wnt5b) measured using western blotting. This experiment was repeated independently three times and representative results are shown. (G) Representative immunofluorescence photomicrograph of DiO (green)-labelled exosomes absorbed by chondrocytes, the nuclei of which were stained by DAPI (blue). Scale bar: 50 μm.
Figure 2
Figure 2
Responses of articular chondrocytes stimulated by SMSC-Exos. (A) Changes in the expression of the representative downstream genes ANKRD1, CTGF and Cyr61 following YAP activation. SMSC-Exos-0, 1, 5 and 10 indicates that 0, 1, 5, or 10 × 1011 exosome particles/mL were used in the corresponding groups. This experiment was repeated three times. *P < 0.05 compared to SMSC-Exos-0. (B) Representative pictures of de-phosphorylation of YAP, reflecting its activation, and the results of statistical analysis of three replicates. *P < 0.05 compared to SMSC-Exos-0. (C) Subcellular localization of YAP detected using confocal immunofluorescence microscopy. This experiment was repeated independently three times and representative results are shown. Scale bar: 50 μm. (D) EdU assays performed using flow cytometry. The percentage of EdU-positive cells (labelled green) was determined. This experiment was repeated independently three times and representative results are shown. (E) Chondrocyte migration assays. Migrated chondrocytes were stained by crystal violet. This experiment was repeated independently three times and representative results are shown. Scale bar: 50 μm. (F) Gene expression changes of Aggrecan (ACAN), Type II Collagen (Col II) and SOX9 after stimulation with different concentrations of SMSC-Exos. This experiment was repeated three times. *P < 0.05 compared to SMSC-Exos-0. (G) Protein expression levels of Col II, Aggrecan and SOX9 were detected by western blotting and the results of statistical analysis of three replicates are also shown. *P < 0.05 compared to SMSC-Exos-0.
Figure 3
Figure 3
Functions of Wnt5a and Wnt5b in SMSC-Exos-stimulated articular chondrocytes. (A) Normalized gene expression levels of Wnt family members in SMSCs. This experiment used three replicates. (B) Expression of YAP downstream genes in chondrocytes treated with exosomes, at a concentration of 10 × 1011 exosome particles/mL, derived from SMSCs transfected by empty vector (SMSC-Exos-10) and SMSCs transfected with shWnt5a and shWnt5b (SMSC-shWnt5a&5b-Exos). This experiment was repeated three times. (C) YAP activation was detected by western blotting by observing the de-phosphorylation of YAP. The results of statistical analysis of three independent replicates are also shown. *P < 0.05 compared to control. (D) Subcellular localization of YAP was observed using confocal immunofluorescence microscopy. This experiment was repeated independently three times and representative results are shown. Scale bar: 50 μm. (E) EdU assays were performed using flow cytometry. The percentage of EdU-positive cells (labelled green) was determined. This experiment was repeated independently three times and representative results are shown. (F) Migration assays of chondrocytes. Migrated chondrocytes were stained by crystal violet. This experiment was repeated independently three times and representative results are shown. Scale bar: 50 μm. (G) Gene expression changes of Aggrecan, Col II and SOX9 after stimulation with the indicated exosomes, at a concentration of 10 × 1011 exosome particles/mL. This experiment was repeated three times. *P < 0.05 compared to control. (H) Protein expression levels of Col II, Aggrecan and SOX9 were detected using western blotting. The results of statistical analysis of three independent replicates are also shown. *P < 0.05 compared to control.
Figure 4
Figure 4
YAP plays an important role in mediating the effects of SMSC-Exos stimulation. (A) Representative gene expression levels of YAP downstream genes after chondrocytes were transfected with empty vector or S127A. This experiment was repeated three times. *P < 0.05 compared to empty vector. (B) EdU assays were performed, using chondrocytes transfected with empty vector or S127A. The percentage of EdU-positive cells (labelled green) was determined. This experiment was repeated three times. (C) Migration of chondrocytes after transfection with empty vector or S127A. Migrated chondrocytes were stained with crystal violet. This experiment was repeated three times. Scale bar: 50 μm. (D) Gene expression levels of Aggrecan, Col II and SOX9 after chondrocytes were transfected with empty vector or S127A. This experiment was repeated three times. *P < 0.05 compared to empty vector. (E) Protein levels of Aggrecan, Col II and SOX9 were analysed using western blotting. The results of statistical analysis of three independent replicates are also shown. *P < 0.05 compared to Empty Vector. (F) YAP gene expression levels after chondrocytes were transfected by shYAP #1 or shYAP #2. This experiment was repeated three times. *P < 0.05 compared to empty vector. (G) EdU assays were performed on chondrocytes transfected with empty vector or shYAP #1 with or without SMSC-Exos treatment, at a concentration of 10 × 1011 exosome particles/mL. This experiment was repeated three times. (H) Chondrocyte migration assays. Migrated chondrocytes were stained by crystal violet. This experiment was repeated three times. Scale bar: 50 μm. (I) Chondrocytes, transfected with empty vector, shYAP #1 or shYAP #2, were treated with or without SMSC-Exos at a concentration of 10 × 1011 exosome particles/mL. This experiment was repeated three times. *P < 0.05 compared to chondrocytes transfected with empty vector without exosome treatment (Empty Vector+Control). #P < 0.05 compared to chondrocytes transfected with empty vector with SMSC-Exos treatment, at a concentration of 10 × 1011 exosome particles/mL (Empty Vector+SMSC-Exos-10). (J-K) Protein expression levels of Col II, Aggrecan and SOX9 were analysed using western blotting. The results of statistical analysis of three independent replicates are also shown. *P < 0.05 compared to control.
Figure 5
Figure 5
miR-140-5p maintains the function of articular chondrocytes (A) Normalized gene expression levels in SMSC-Exos detected by miRNA microarray. Three independent samples were used. (B) Gene expression levels of highly-expressed genes in SMSC-Exos and gene expression levels of miR-140-5p and miR-140-3p. (C) Efficiency of shRalA #1, shRalA #2 and RalA lentiviral vectors were detected by qPCR. This experiment was repeated three times. *P < 0.05 compared to chondrocytes transfected with empty vector. (D) Aggrecan or SOX9 gene expression levels of chondrocytes transfected with miR-140-5p, RalA or shRalA #1. This experiment was repeated three times. *P < 0.05 compared to chondrocytes transfected with empty vector. (E) Protein expression levels of Col II, Aggrecan, SOX9 and RalA were analysed using western blotting. The results of statistical analysis of three independent replicates are also shown. *P < 0.05 compared to Empty Vector. #P < 0.05 compared between each other. (F) Expression level changes of miR-140-5p in SMSC-Exos, SMSC-140-Exos, or in articular chondrocytes which were treated with SMSC-Exos (AC-SMSC-Exos) or SMSC-140-Exos (AC-SMSC-140-Exos). This experiment was repeated three times.
Figure 6
Figure 6
Responses of articular chondrocytes to stimulation by SMSC-140-Exos. (A) Representative downstream gene expression changes following YAP activation. SMSC-140-Exos-0, 1, 5 and 10 indicates that 0, 1, 5, or 10 × 1011 exosome particles/mL were used in the corresponding groups. This experiment was repeated three times. *P < 0.05 compared to SMSC-140-Exos-0. (B) Subcellular localization of YAP detected using confocal immunofluorescence microscopy. This experiment was repeated three times. Scale bar: 50 μm. (C) EdU assays performed using flow cytometry. The percentage of EdU-positive cells (labelled green) was determined. This experiment was repeated three times. (D) Chondrocyte migration assays. Migrated chondrocytes were stained by crystal violet. This experiment was repeated three times. Scale bar: 50 μm. (E) Gene expression levels of Aggrecan, Col II and SOX9 after stimulation with SMSC-140-Exos at different concentrations. This experiment was repeated three times. *P < 0.05 compared to SMSC-140-Exos-0. (F) Protein expression levels of Col II, Aggrecan and SOX9 were analysed using western blotting. The results of statistical analysis of three independent replicates are also shown. *P < 0.05 compared to SMSC-140-Exos-0. (G) Protein expression levels of Col II, Aggrecan and SOX9 in the articular chondrocytes transfected with negative control, miR-140-5p-inhibitor or miR-140-5p-antagomir, and treated with or without SMSC-140-Exos at a concentration of 10 × 1011 exosome particles/mL, analysed using western blotting. The results of statistical analysis of three independent replicates are also shown. *P < 0.05 compared to negative control only. #P < 0.05 compared to negative control treated with 10 × 1011 SMSC-140-Exos. (H) Protein expression levels of Col II, Aggrecan and SOX9 were analysed using western blotting, and the results of statistical analysis of three independent replicates are shown. *P < 0.05 compared to control. #P < 0.05 compared between each other.
Figure 7
Figure 7
SMSC-140-Exos prevent OA (A) Sections of femoral condyle (n = 10 for each group) were stained using Safranin-O & fast green (Scale bar: 500 μm). Photomicrographs of femoral condyle sections (n = 10 for each group) stained using anti-type II collagen, anti-aggrecan or anti-type I collagen as primary antibodies (Scale bar: 50 μm). (B) Statistical results of chondrocytes counted in randomly-selected high magnification fields and the result of statistical analysis of OARSI score in each group. *P < 0.05 compared to Normal. (C) Diagram illustrating the proposed mechanism of action of SMSC-140-Exos in OA.

References

    1. Woolf AD, Pfleger B. Burden of major musculoskeletal conditions. Bulletin of the World Health Organization. 2003;81:646–56. - PMC - PubMed
    1. Skou ST, Roos EM, Laursen MB, Rathleff MS, Arendt-Nielsen L, Simonsen O. et al. A Randomized, Controlled Trial of Total Knee Replacement. The New England journal of medicine. 2015;373:1597–606. - PubMed
    1. Glyn-Jones S, Palmer AJ, Agricola R, Price AJ, Vincent TL, Weinans H. et al. Osteoarthritis. Lancet (London, England) 2015;386:376–87. - PubMed
    1. Agricola R, Heijboer MP, Roze RH, Reijman M, Bierma-Zeinstra SM, Verhaar JA. et al. Pincer deformity does not lead to osteoarthritis of the hip whereas acetabular dysplasia does: acetabular coverage and development of osteoarthritis in a nationwide prospective cohort study (CHECK) Osteoarthritis and cartilage / OARS, Osteoarthritis Research Society. 2013;21:1514–21. - PubMed
    1. Dezateux C, Rosendahl K. Developmental dysplasia of the hip. Lancet (London, England) 2007;369:1541–52. - PubMed