. 2017 Mar;38(3):351-361.
doi: 10.1038/aps.2016.120. Epub 2017 Jan 2.

In vitro assessment of the glucose-lowering effects of berberrubine-9-O-β-D-glucuronide, an active metabolite of berberrubine

Affiliations

In vitro assessment of the glucose-lowering effects of berberrubine-9-O-β-D-glucuronide, an active metabolite of berberrubine

Na Yang et al. Acta Pharmacol Sin. 2017 Mar.

Abstract

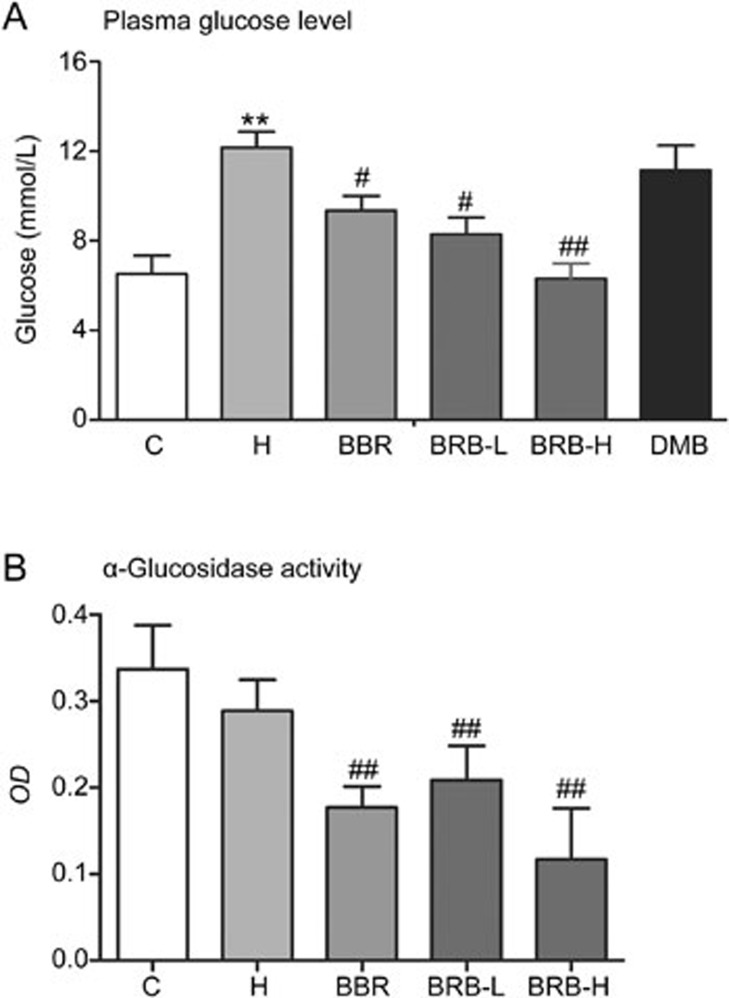
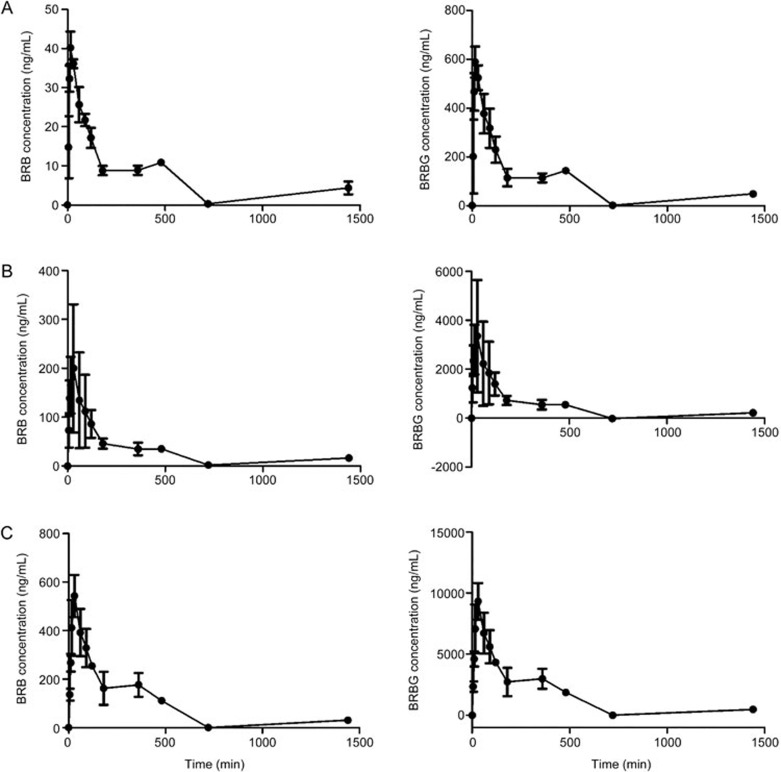
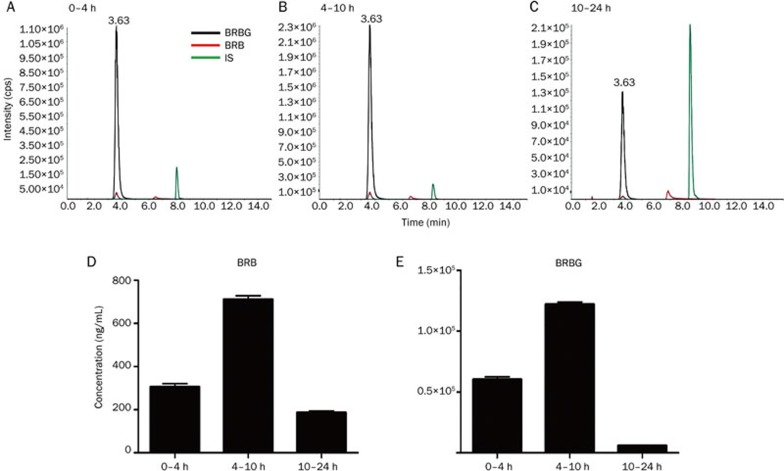
Berberrubine (BRB) is the primary metabolite of berberine (BBR) that has shown a stronger glucose-lowering effect than BBR in vivo. On the other hand, BRB is quickly and extensively metabolized into berberrubine-9-O-β-D-glucuronide (BRBG) in rats after oral administration. In this study we compared the pharmacokinetic properties of BRB and BRBG in rats, and explored the mechanisms underlying their glucose-lowering activities. C57BL/6 mice with HFD-induced hyperglycemia were administered BRB (50 mg·kg-1·d-1, ig) for 6 weeks, which caused greater reduction in the plasma glucose levels than those caused by BBR (120 mg·kg-1·d-1) or BRB (25 mg·kg-1·d-1). In addition, BRB dose-dependently decreased the activity of α-glucosidase in gut of the mice. After oral administration of BRB in rats, the exposures of BRBG in plasma at 3 different dosages (10, 40, 80 mg/kg) and in urine at different time intervals (0-4, 4-10, 10-24 h) were dramatically greater than those of BRB. In order to determine the effectiveness of BRBG in reducing glucose levels, we prepared BRBG from the urine pool of rats, and identified and confirmed it through LC-MS-IT-TOF and NMR spectra. In human normal liver cell line L-O2 in vitro, treatment with BRB or BRBG (5, 20, 50 μmol/L) increased glucose consumption, enhanced glycogenesis, stimulated the uptake of the glucose analog 2-NBDG, and modulated the mRNA levels of glucose-6-phosphatase and hexokinase. However, both BBR and BRB improved 2-NBDG uptake in insulin-resistant L-O2 cells, while BRBG has no effect. In conclusion, BRB exerts a stronger glucose-lowering effect than BBR in HFD-induced hyperglycemia mice. Although BRB significantly stimulated the insulin sensitivity and glycolysis in vitro, BRBG may have a greater contribution to the glucose-lowering effect because it has much greater system exposure than BRB after oral administration of BRB. The results suggest that BRBG is a potential agent for reducing glucose levels.


Figures

Figure 1
Figure 1
Glucose-lowering effect of BBR metabolites on high-fat diet induced hyperglycemia in mice. (A) The plasma glucose level. (B) α-glucosidase activity in small intestine mucosa. C, C57BL/6 mice with normal standard diet; H, high-fat diet group; BRB, berberrubine; BBR, high-fat diet+BBR (120 mg·kg−1·d−1); BRB-L, high-fat diet+BRB (25 mg·kg−1·d−1); BRB-H, high-fat diet+BRB (50 mg·kg−1·d−1); DMB, high-fat diet+DMB (180 mg·kg−1·d−1). Values are mean±SD. n=5. **P<0.01 vs C. #P<0.05, ##P<0.01 vs H.
Figure 2
Figure 2
Metabolic pathway for the glucuronidation of BRB.
Figure 3
Figure 3
Plasma concentration-time curves of BRB and BRBG after oral administration of BRB in SD rats. BRB, berberrubine. (A) Low dose, 10 mg/kg; (B) Middle dose, 40 mg/kg; (C) High dose, 80 mg/kg. Values are mean±SD. n=3.
Figure 4
Figure 4
Extraction ion current chromatograms of BRB, BRBG, and their concentrations in urine samples. SD rats were intragastrically administered with BRB of 40 mg/kg. MRM chromatogram of urine samples at intervals of 4 h (A), 10 h (B), 24 h (C). BRB at m/z 322.4→307.1, BRBG at m/z 498.3→322.1 and IS at m/z 502.4→466.3. Ion peaks are located at tR 3.63 min (BRBG), 6.85 min (BRB), and 8.26 min (IS), respectively. Quantitative analysis of BRB (D) and BRBG (E) in urine samples at different time intervals are shown as mean±SD. n=6.
Figure 5
Figure 5
The relative percentage of BRB and BRBG after the incubation of BRBG in gut content. BRBG was incubated in the cecal contents of C57BL/6 mice at three different concentrations (0.2, 2, and 20 μmol/L) for 30 min. The flora in gut content of the test group showed distinct hydrolysis activity for BRBG, while the flora in gut content of the control group was boiled and de-activated. The percentage of BRB and BRBG to the total quantity (BRB+BRBG) are shown as mean±SD. n=3.
Figure 6
Figure 6
Glucose-lowering effect of BRB and BRBG in L-O2 cells. (A) Glucose consumption of BRBG and BRB in L-O2 cells (n=5), where BBR (50 μmol/L) was used as the positive group. L-O2 cells were exposed to BRB or BRBG at 5, 20 and 50 μmol/L, respectively. (B) The uptake of 2-NBDG into L-O2 cells. Fluorescent image of cells incubated with Blank medium, 50 μmol/L BBR, 50 μmol/L BRB, 50 μmol/L BRBG for 24 h. After pretreatment, each group was exposed to 100 μmol/L 2-NBDG for 60 min. (C) Glycogen content of different groups (Blank; BBR, 50 μmol/L; BRB, 50 μmol/L; BRBG, 50 μmol/L). Values are mean±SD. n=3. (D) The effect of BRB and BRBG (5, 20, and 50 μmol/L) on L-O2 cells viability. Mean±SD. n=5. *P<0.05, **P<0.01 vs Blank control.
Figure 7
Figure 7
The effect of BRB and BRBG on glucose metabolism and insulin sensitivity. (A) The effect of BRB and BRBG on mRNA expression of key enzymes in glucose metabolism in HepG2 cells. The mRNA levels of glucose-6-phosphatase (G6Pase) and hexokinase (HK) were normalized to that of β-actin. L, 5 μmol/L; M, 20 μmol/L; H, 50 μmol/L. *P<0.05, **P<0.01 vs Blank control. (B) The effect of BRB and BRBG on 2-NBDG uptake in insulin-resistant L-O2 cells. L-O2 cells were incubated with 1 μmol/L insulin for 24 h to establish insulin-resistant model (Model) and test groups were co-incubated with BBR, BRB, and BRBG at 50 μmol/L, respectively. Cells were then stimulated with 100 nmol/L insulin for 60 min to determine the uptake of 2-NBDG (Ins). Metformin (MH) at 10 μmol/L was used as the positive group. **P<0.01 vs Model-Ins+. ##P<0.01 vs Model+Ins+. Results are represented as mean±SD. n=3.

References

    1. Wang D, Liu Z, Guo M, Liu S. Structural elucidation and identification of alkaloids in Rhizoma Coptidis by electrospray ionization tandem mass spectrometry. J Mass Spectrom 2004; 39: 1356–65. - PubMed
    1. Li HM, Wang YY, Wang HD, Cao WJ, Yu XH, Lu DX, et al. Berberine protects against lipopolysaccharide-induced intestinal injury in mice via alpha 2 adrenoceptor-independent mechanisms. Acta Pharmacol Sin 2011; 32: 1364–72. - PMC - PubMed
    1. Holy EW, Akhmedov A, Luscher TF, Tanner FC. Berberine, a natural lipid-lowering drug, exerts prothrombotic effects on vascular cells. J Mol Cell Cardiol 2009; 46: 234–40. - PubMed
    1. Wang ZS, Lu FE, Xu LJ, Dong H. Berberine reduces endoplasmic reticulum stress and improves insulin signal transduction in HepG2 cells. Acta Pharmacol Sin 2010; 31: 578–84. - PMC - PubMed
    1. Pan GY, Wang GJ, Sun JG, Huang ZJ, Zhao XC, Gu Y, et al. Inhibitory action of berberine on glucose absorption. Acta Pharm Sin 2003; 38: 911–4. - PubMed