. 2017 Jan 17;8(3):5160-5178.
doi: 10.18632/oncotarget.14107.

High throughput estimation of functional cell activities reveals disease mechanisms and predicts relevant clinical outcomes

Affiliations

High throughput estimation of functional cell activities reveals disease mechanisms and predicts relevant clinical outcomes

Marta R Hidalgo et al. Oncotarget. .

Abstract

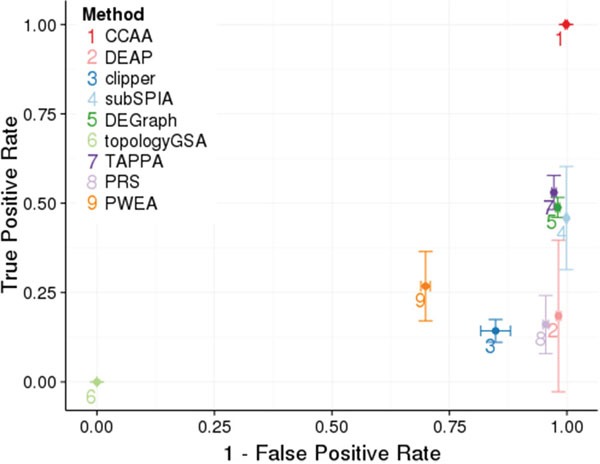
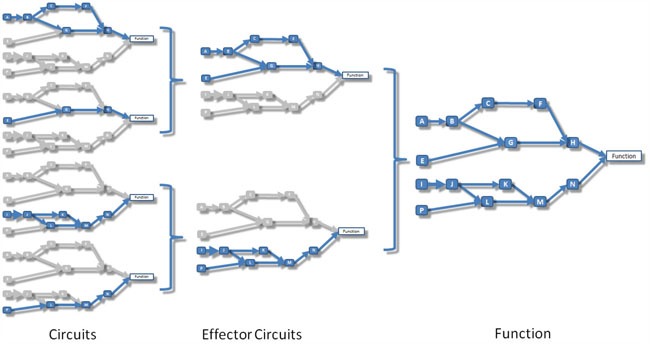
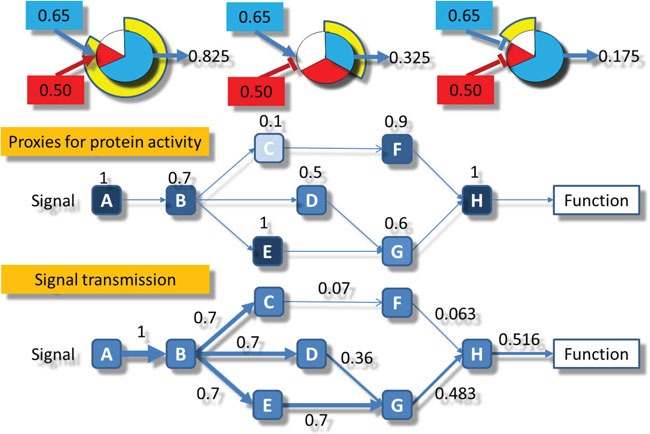
Understanding the aspects of the cell functionality that account for disease or drug action mechanisms is a main challenge for precision medicine. Here we propose a new method that models cell signaling using biological knowledge on signal transduction. The method recodes individual gene expression values (and/or gene mutations) into accurate measurements of changes in the activity of signaling circuits, which ultimately constitute high-throughput estimations of cell functionalities caused by gene activity within the pathway. Moreover, such estimations can be obtained either at cohort-level, in case/control comparisons, or personalized for individual patients. The accuracy of the method is demonstrated in an extensive analysis involving 5640 patients from 12 different cancer types. Circuit activity measurements not only have a high diagnostic value but also can be related to relevant disease outcomes such as survival, and can be used to assess therapeutic interventions.

Keywords: biomarker; disease mechanism; prognostic; signaling pathway; survival.


Conflict of interest statement

CONFLICTS OF INTEREST

The authors declare that they have no conflicts of interest

Figures

Figure 1
Figure 1. Comparison of performances of the different methods for defining pathways and calculating its activity
CCAA is compared to DEAP [12], subSPIA [13], using their own software, and topologyGSA [14], DEGraph [6], clipper [5], TAPPA [15], PRS [16], PWEA [17], using the implementation available in the topaseq package [18]. The true positive rate has been estimated averaging the proportion of significant cancer KEGG pathways (Table 3) across the 12 cancers analyzed and is represented in the Y axis. Vertical bars in each point represent 1 SD of the true positive rate for the corresponding method. The false positive rate was estimated from 100 comparisons of groups (N=25) of identical individuals, randomly sampled from each cancer. The results obtained in the 12 cancers are used to obtain a mean value and an error. The X axis represents 1- the false positive rate. Horizontal bars represent in each point represent 1 SD of the false positive rate for the corresponding method.
Figure 2
Figure 2. Circos plot that summarises the relationships between effectors within pathways and the functions triggered by them
Only cancer KEGG pathways (Table 3) related to functions significantly related to survival are represented here. On the right side appear the effector circuits grouped according to the pathway they belong to. There is a histogram per pathway that represents the proportion of effector pathways upregulated (red), downregulated (blue) and dysregulated in both directions (yellow). On the left side of the circo appear the functions triggered by the effector circuits divided into those which are significant when are up-regulated (red), when are down-regulated (blue) or when both situations occur (yellow). For each function there is a band that indicates the prognostic of its deregulation, which can be good (green) or bad (grey).
Figure 3
Figure 3. Increase of DNA replication activity is related to bad prognostic
Effector nodes in two pathways trigger DNA replication in KIRC, as detected by the Hipathia program (http://hipathia.babelomics.org). Genes in red represent genes upregulated in the cancer with respect to the corresponding normal tissue; genes in blue represent downregulated genes and genes with no color were not differentially expressed. A. Cell Cycle signaling pathway with three effector circuits highlighted, one of them ending in the node containing proteins CDC6, ORC3, ORC5, ORC4, ORC2, ORC1 and ORC6, the second one ending in node with proteins CDC45, MCM7, MCM6, MCM5, MCM4, MCM3 and MCM2 and the last one ending in node with proteins ORC3, ORC5, ORC4, ORC2, ORC1, ORC6, MCM7, MCM6, MCM5, MCM4, MCM3 and MCM2. B. p53 signaling pathway with the effector circuit ending in protein RRM2B highlighted. C. Survival Kaplan-Meier (K-M) curves obtained for Uniprot function DNA replication.
Figure 4
Figure 4. DNA replication is triggered by the same circuits in KIRC and BRCA, but using a different pattern of gene activation
The Hipathia program (http://hipathia.babelomics.org) detected a total of four effector circuits in two pathways, Cell Cycle and P53 signaling, that are used by both cancers to trigger DNA replication. Arrows in red represent activated circuits. Genes in red represent genes upregulated in the cancer with respect to the corresponding normal tissue; genes in blue represent downregulated genes and genes with no color were not differentially expressed. Squares at the end of the circuit represent the cell functions triggered by the circuits. A. Cell Cycle signaling pathway in KIRC with three effector circuits activated (highlighted), one of them ending in the node containing proteins CDC6, ORC3, ORC5, ORC4, ORC2, ORC1 and ORC6, the second one ending in node with proteins CDC45, MCM7, MCM6, MCM5, MCM4, MCM3 and MCM2 and the last one ending in node with proteins ORC3, ORC5, ORC4, ORC2, ORC1, ORC6, MCM7, MCM6, MCM5, MCM4, MCM3 and MCM2. B. P53 signaling pathway in BRCA with the effector circuit ending in protein RRM2B highlighted. C. Cell Cycle pathway in BRCA with the same effector circuits activated that in KIRC, but using a different set of gene activations. D. P53 signaling pathway in BRCA with the same effector circuit activated that in KIRC, but using a different set of gene activations.
Figure 5
Figure 5. Schema that illustrates the relationship between circuits, effector circuits and functions
Left: signaling circuits, which are canonical sub-pathways that transmit signals from a unique receptor to a unique effector node. Center: effector circuits that represent the combined activity of all the signals that converge into a unique effector node. Right: functional activity that represents the combined effect of the signal received by all the effectors that trigger a particular cell function.
Figure 6
Figure 6. Schematic representation of the signal propagation algorithm used
Upper part: the three types of activity transmitted: left) the combination of two activations, center) the combination of an activation and an inhibition and right) the combination of two inhibitions. Central part: the normalized values of gene expression are assigned to the corresponding nodes in the circuits. Lower part: the signal starts with a value of 1 in the receptor node A and is propagated by multiplying the weights assigned to each node in the central part following the rules depicted in the upper part.

References

    1. Oti M, Brunner HG. The modular nature of genetic diseases. Clin Genet. 2007;71:1–11. - PubMed
    1. Fey D, Halasz M, Dreidax D, Kennedy SP, Hastings JF, Rauch N, Munoz AG, Pilkington R, Fischer M, Westermann F, Kolch W, Kholodenko BN, Croucher DR. Signaling pathway models as biomarkers: Patient-specific simulations of JNK activity predict the survival of neuroblastoma patients. Sci Signal. 2015;8:ra130. - PubMed
    1. Amadoz A, Sebastian-Leon P, Vidal E, Salavert F, Dopazo J. Using activation status of signaling pathways as mechanism-based biomarkers to predict drug sensitivity. Scientific reports. 2015;5:18494. - PMC - PubMed
    1. Jaakkola MK, Elo LL. Empirical comparison of structure-based pathway methods. Briefings in bioinformatics. 2016;17:336–345. - PMC - PubMed
    1. Martini P, Sales G, Massa MS, Chiogna M, Romualdi C. Along signal paths: an empirical gene set approach exploiting pathway topology. Nucleic Acids Res. 2013;41:e19. - PMC - PubMed