

Magnetic resonance fingerprinting based on realistic vasculature in mice
- PMID: 28043909
- PMCID: PMC5368007
- DOI: 10.1016/j.neuroimage.2016.12.060
Magnetic resonance fingerprinting based on realistic vasculature in mice
Abstract
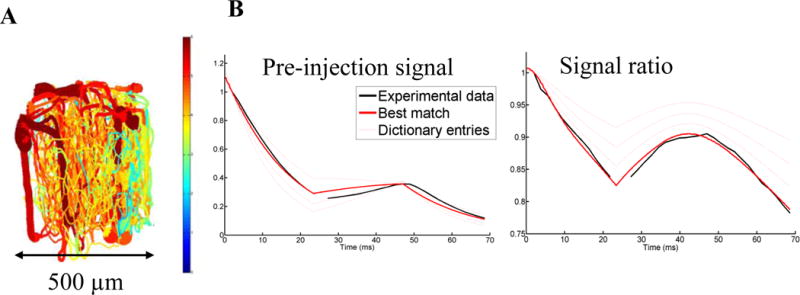
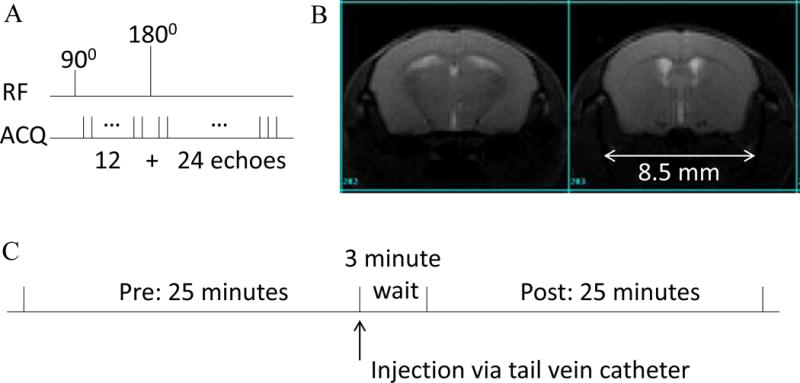
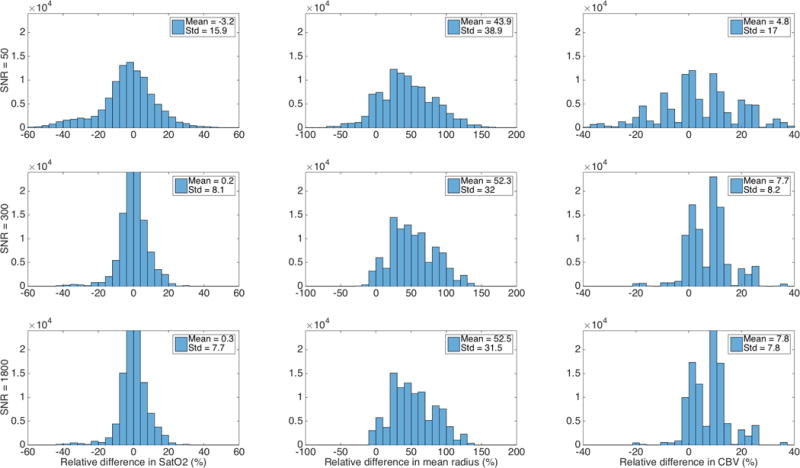
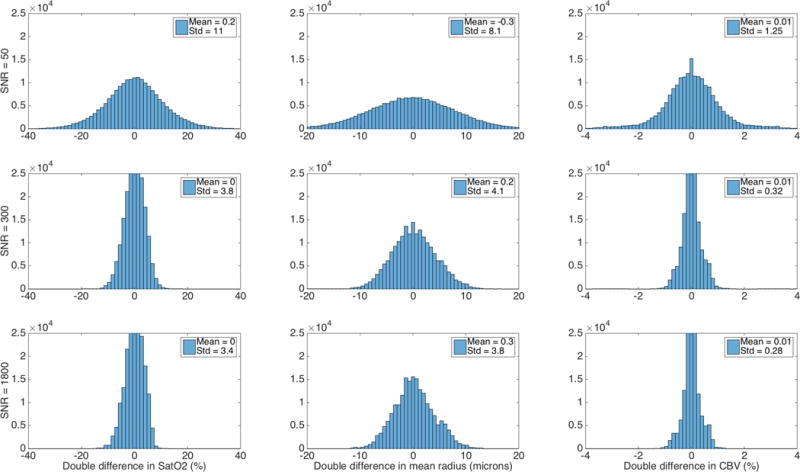
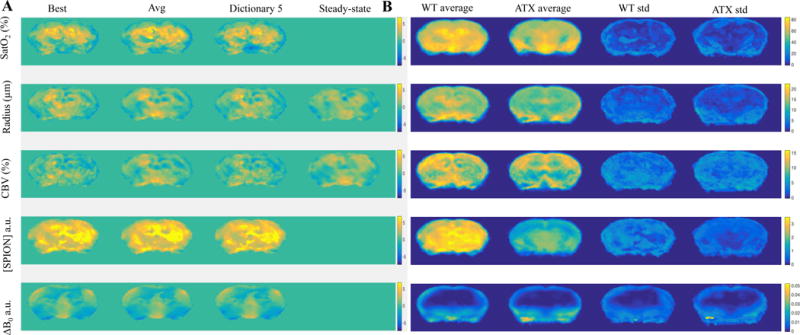
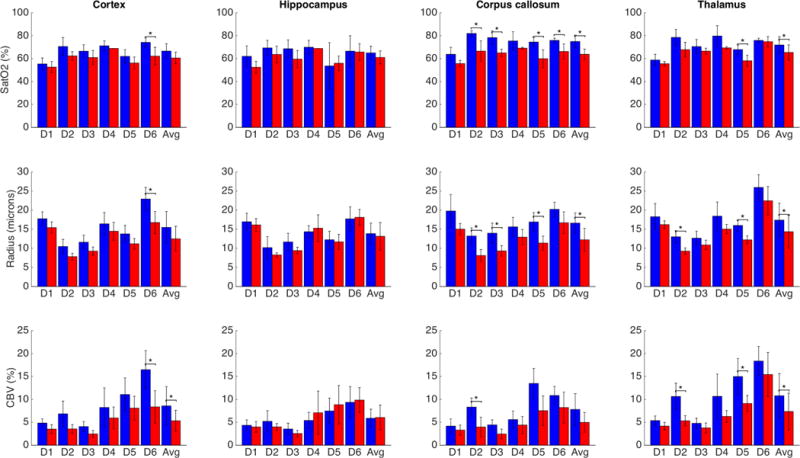
Magnetic resonance fingerprinting (MRF) was recently proposed as a novel strategy for MR data acquisition and analysis. A variant of MRF called vascular MRF (vMRF) followed, that extracted maps of three parameters of physiological importance: cerebral oxygen saturation (SatO2), mean vessel radius and cerebral blood volume (CBV). However, this estimation was based on idealized 2-dimensional simulations of vascular networks using random cylinders and the empirical Bloch equations convolved with a diffusion kernel. Here we focus on studying the vascular MR fingerprint using real mouse angiograms and physiological values as the substrate for the MR simulations. The MR signal is calculated ab initio with a Monte Carlo approximation, by tracking the accumulated phase from a large number of protons diffusing within the angiogram. We first study the identifiability of parameters in simulations, showing that parameters are fully estimable at realistically high signal-to-noise ratios (SNR) when the same angiogram is used for dictionary generation and parameter estimation, but that large biases in the estimates persist when the angiograms are different. Despite these biases, simulations show that differences in parameters remain estimable. We then applied this methodology to data acquired using the GESFIDE sequence with SPIONs injected into 9 young wild type and 9 old atherosclerotic mice. Both the pre injection signal and the ratio of post-to-pre injection signals were modeled, using 5-dimensional dictionaries. The vMRF methodology extracted significant differences in SatO2, mean vessel radius and CBV between the two groups, consistent across brain regions and dictionaries. Further validation work is essential before vMRF can gain wider application.
Keywords: Ab initio Monte Carlo simulations of magnetic resonance signal; Gradient-echo sampling of free induction decay and echo (GESFIDE); Mouse model of atherosclerosis; Superparamagnetic iron oxide nanoparticle (SPION); Vascular magnetic resonance fingerprinting (vMRF).
Copyright © 2017 Elsevier Inc. All rights reserved.
Figures
References
-
- Yablonskiy DA, Haacke EM. Theory of NMR signal behavior in magnetically inhomogeneous tissues: The static dephasing regime. Magn Reson Med. 1994 Dec;32(6):749–763. - PubMed
-
- Christen T, et al. Quantitative MR estimates of blood oxygenation based on T2*: A numerical study of the impact of model assumptions. Magn Reson Med. 2012 May;67(5):1458–1468. - PubMed
-
- Bandettini PA. Twenty years of functional MRI: The science and the stories. NeuroImage. 2012 Aug;62(2):575–588. - PubMed
Publication types
MeSH terms
Grants and funding
LinkOut - more resources
Full Text Sources
Other Literature Sources
Medical
Miscellaneous
