Review
. 2017 Feb;216(2):317-330.
doi: 10.1083/jcb.201609124. Epub 2017 Jan 2.

Spatial and temporal signal processing and decision making by MAPK pathways

Affiliations
Review

Spatial and temporal signal processing and decision making by MAPK pathways

Oguzhan Atay et al. J Cell Biol. 2017 Feb.

Abstract

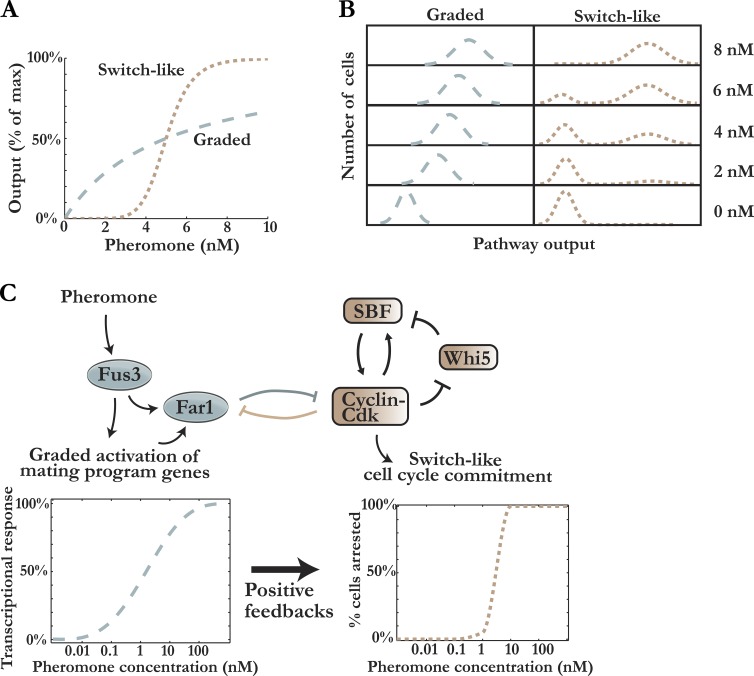
Mitogen-activated protein kinase (MAPK) pathways are conserved from yeast to man and regulate a variety of cellular processes, including proliferation and differentiation. Recent developments show how MAPK pathways perform exquisite spatial and temporal signal processing and underscores the importance of studying the dynamics of signaling pathways to understand their physiological response. The importance of dynamic mechanisms that process input signals into graded downstream responses has been demonstrated in the pheromone-induced and osmotic stress-induced MAPK pathways in yeast and in the mammalian extracellular signal-regulated kinase MAPK pathway. Particularly, recent studies in the yeast pheromone response have shown how positive feedback generates switches, negative feedback enables gradient detection, and coherent feedforward regulation underlies cellular memory. More generally, a new wave of quantitative single-cell studies has begun to elucidate how signaling dynamics determine cell physiology and represents a paradigm shift from descriptive to predictive biology.


Figures

Figure 1.
Figure 1.
Schematic illustrating the pheromone-dependent MAPK pathway in budding yeast. The two branches of this pathway are responsible for generating cell polarity and tracking pheromone gradients and for arresting the cell division cycle and activating the expression of the mating program. The receptor is Ste2 or Ste3 for mating type a or α, respectively. Molecules and interactions of a similar type are color coded. Orange denotes receptors and G proteins, pink denotes kinases, and dark green denotes scaffold molecules. Black arrows denote phosphorylation, blue arrows denote synthesis, and red arrows denote translocation or recruitment. See text (section Physiological function of the yeast pheromone-induced pathway) for a more detailed description of protein interactions.
Figure 2.
Figure 2.
Graded and switch-like features of the pheromone response. (A) Schematic of a switch-like and graded response to pheromone. (B) Schematic of how noise results in a distribution of outputs for both graded and switch-like responses. Note the presence of bimodal distributions in the switch-like response. (C, top) Simplified network schematic of the interaction of the G1/S cell cycle control network and the pheromone-dependent MAPK pathway. (Bottom left) Illustration of the graded response of MAPK pathway outputs, such as the fraction of Fus3 that is active or the Ste12-dependent transcription rate. (Bottom right) Illustration of how the graded pheromone pathway output is converted to a switch-like cell cycle response by multiple positive feedback loops in the cell cycle network.
Figure 3.
Figure 3.
Yeast use memory of past exposure to pheromone to decide to reenter the cell cycle. (A) Yeast temporarily exposed to a high pheromone concentration (top) will remain arrested at a lower concentration than yeast only exposed to the lower concentration (bottom). Cells base the decision to reenter the cell cycle on Far1 levels, which reflect an integration of MAPK pathway activity. (B) Yeast are able to transmit memory of past pheromone exposure across generations despite the mutual inhibition of cell cycle kinases and Far1. This is because Cdc24 anchors some Far1 in the cytoplasm, which is not targeted for degradation by the predominantly nuclear cell cycle kinases. Release of the anchored Far1 in subsequent cell cycles promotes cell cycle arrest in daughter cells. Yeast may have pseudohyphae morphology during arrest under the conditions shown here. Far1 concentration is illustrated in proportion to the darkness of the blue color.
Figure 4.
Figure 4.
Schematic of MAPK pathway–dependent cell polarization and gradient tracking. (A) At least four mechanisms act to maintain a single polarity patch. (1) Competition of multiple sites of polarization for a limited pool of polarity factors results in the depletion of these factors by the largest site. (2) Cdc42 diffusion from the polarity site on the membrane is controlled by the GDI Rdi1 and the GAP Bem2. (3) Even in the absence of GDI-dependent control, membrane-bound active Cdc42 at the polarity patch diffuses away slowly, whereas cytoplasmic Cdc42 can rapidly reach and accumulate at the polarity patch. (4) The scaffold protein Bem1 is recruited to the polarity patch by active Cdc42-GTP. Bem1 is bound to Cdc24 so that its recruitment activates neighboring Cdc42 to complete a positive feedback loop. (B, top) Illustration showing a pheromone gradient and its effect on the polarity of cells of different orientations. Models predict that the polarity patch wanders more when the major axis of cell polarity is not aligned with the pheromone gradient. (Bottom left) Actin cables bring dilute and inactive Cdc42 and inactive pheromone receptors to the site of the polarity patch. This negative feedback pushes the center of the polarity patch away from newly arrived vesicles. (Bottom right) At higher pheromone concentrations, increased localized activation of the Gβγ subunit results in faster local activation of arriving receptors and Cdc42 to tighten the peak and reduce the shifts caused by the negative feedback mechanism of newly arrived vesicles.
Figure 5.
Figure 5.
Graded responses of dynamic MAPK pathways. (A) Schematic of the HOG stress-activated pathway in budding yeast. Color coding is similar to Fig. 1, where pink denotes kinases. (B) Schematic of the activity of the MAPK Hog1 as a function of time in response to step increases of salt concentration. Note nonperfect adaptation after the decrease in Hog1 activity. (C) Schematic of the linear graded relationship between the area under the curve of Hog1 activity and the salt concentration of the step increase. Note that the downstream transcriptional response is not as linear, and that different genes are activated at different salt concentrations. (D) Schematic of the mammalian ERK pathway, which shares a common ancestral pathway with the pheromone-induced yeast MAPK pathway. Color coding is similar to Fig. 1. (E) Schematic of the Erk activity in cells exposed to different concentrations of EGF. The Erk activity is dynamic even in response to constant growth factor concentrations. Erk pulse frequency increases with EGF concentration. (F) Downstream outputs integrating Erk activity over time are a graded function of EGF input.

References

    1. Albeck J.G., Mills G.B., and Brugge J.S.. 2013. Frequency-modulated pulses of ERK activity transmit quantitative proliferation signals. Mol. Cell. 49:249–261. 10.1016/j.molcel.2012.11.002 - DOI - PMC - PubMed
    1. Altschuler S.J., Angenent S.B., Wang Y., and Wu L.F.. 2008. On the spontaneous emergence of cell polarity. Nature. 454:886–889. 10.1038/nature07119 - DOI - PMC - PubMed
    1. Amir S.M., Carraway T.F. Jr., Kohn L.D., and Winand R.J.. 1973. The binding of thyrotropin to isolated bovine thyroid plasma membranes. J. Biol. Chem. 248:4092–4100. - PubMed
    1. Amit I., Citri A., Shay T., Lu Y., Katz M., Zhang F., Tarcic G., Siwak D., Lahad J., Jacob-Hirsch J., et al. . 2007. A module of negative feedback regulators defines growth factor signaling. Nat. Genet. 39:503–512. 10.1038/ng1987 - DOI - PubMed
    1. Aoki K., Kumagai Y., Sakurai A., Komatsu N., Fujita Y., Shionyu C., and Matsuda M.. 2013. Stochastic ERK activation induced by noise and cell-to-cell propagation regulates cell density-dependent proliferation. Mol. Cell. 52:529–540. 10.1016/j.molcel.2013.09.015 - DOI - PubMed

Publication types

Substances

LinkOut - more resources