Review
. 2017 Feb 19;372(1714):20160102.
doi: 10.1098/rstb.2016.0102. Epub 2017 Jan 2.

Contributions of low- and high-level properties to neural processing of visual scenes in the human brain

Affiliations
Review

Contributions of low- and high-level properties to neural processing of visual scenes in the human brain

Iris I A Groen et al. Philos Trans R Soc Lond B Biol Sci. .

Abstract

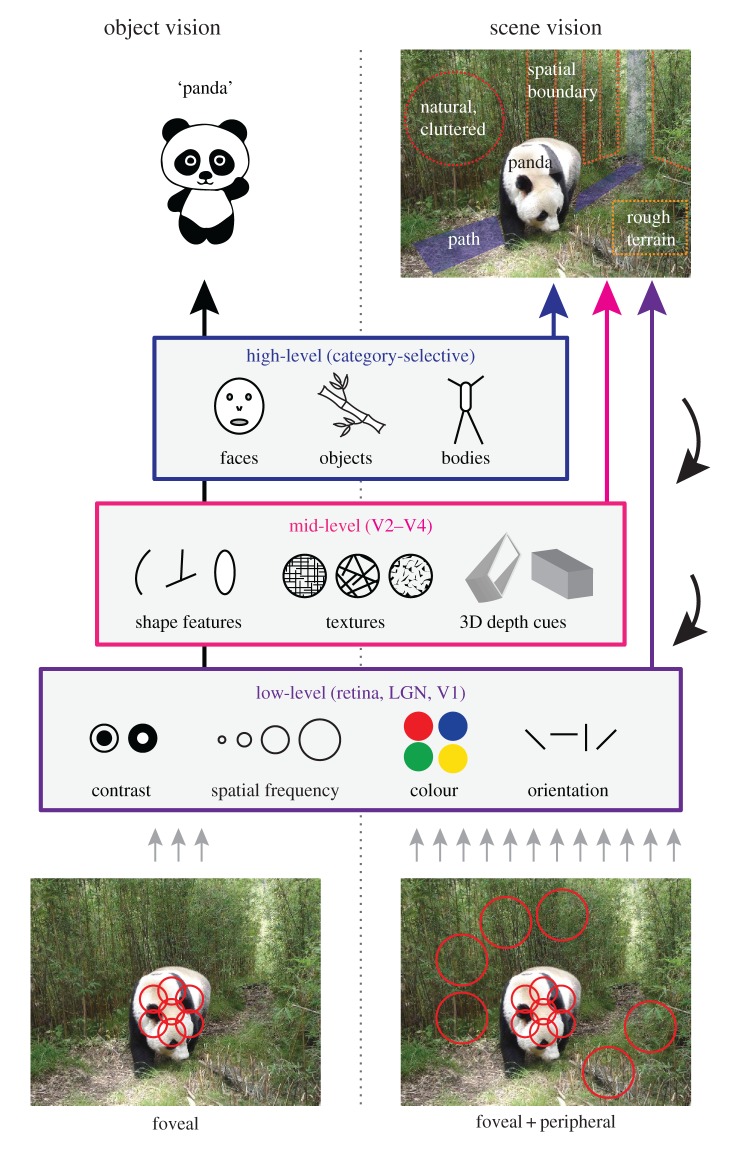
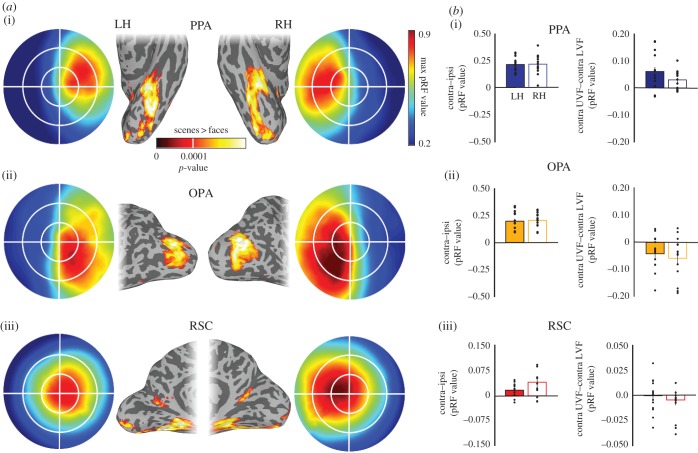
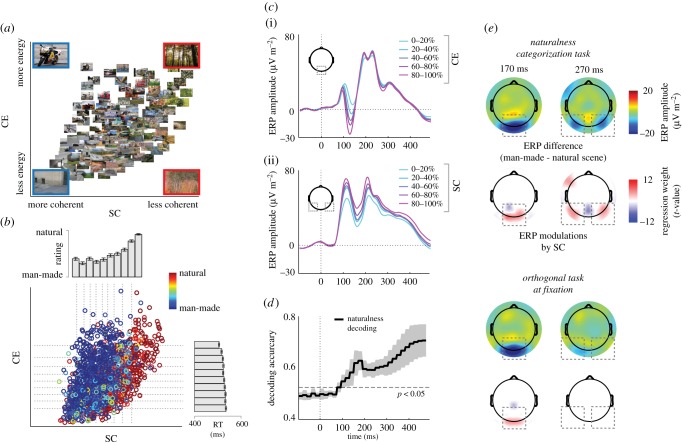
Visual scene analysis in humans has been characterized by the presence of regions in extrastriate cortex that are selectively responsive to scenes compared with objects or faces. While these regions have often been interpreted as representing high-level properties of scenes (e.g. category), they also exhibit substantial sensitivity to low-level (e.g. spatial frequency) and mid-level (e.g. spatial layout) properties, and it is unclear how these disparate findings can be united in a single framework. In this opinion piece, we suggest that this problem can be resolved by questioning the utility of the classical low- to high-level framework of visual perception for scene processing, and discuss why low- and mid-level properties may be particularly diagnostic for the behavioural goals specific to scene perception as compared to object recognition. In particular, we highlight the contributions of low-level vision to scene representation by reviewing (i) retinotopic biases and receptive field properties of scene-selective regions and (ii) the temporal dynamics of scene perception that demonstrate overlap of low- and mid-level feature representations with those of scene category. We discuss the relevance of these findings for scene perception and suggest a more expansive framework for visual scene analysis.This article is part of the themed issue 'Auditory and visual scene analysis'.

Keywords: category-selectivity; electro-encephalography; functional magnetic resonance imaging; image statistics; natural scenes; retinotopy.


Figures

Figure 1.
Figure 1.
Hierarchical framework of visual perception. The standard view of visual perception posits that a visual percept is built from the retinal input by successive extraction of low-, mid- and high-level features. Object vision (left) typically involves foveal vision and the generation of an object label. By contrast, scene vision (right) involves both foveal and peripheral information, and the representation of multiple features including gist and navigability, which are not necessarily object-bound, and may be extracted from multiple levels of the hierarchy. Red circles (bottom) depict schematic receptive fields.
Figure 2.
Figure 2.
Retinotopic biases in scene-selective cortical regions. (a) Group average (n = 16) scene-selectivity (contrast of scenes > faces) and visual field coverage. (i) PPA on ventral temporal cortex, (ii) OPA on the lateral cortical surface and (iii) RSC in medial parietal cortex. All three scene-selective regions show a clear bias for the contralateral visual field. In addition, PPA and OPA show a bias for the upper and lower visual field, respectively. (b) Quantification of visual field biases in scene-selective regions. Left column: bars depict the contralateral biases (contralateral minus ipsilateral pRF value) exhibited by PPA (i), OPA (ii) and RSC (iii), respectively. Right column: bars depict the elevation biases (contralateral upper minus contralateral lower pRF value) exhibited by all regions. Dots indicate individual subjects. Adapted from [–63].
Figure 3.
Figure 3.
Image statistics modulate the temporal dynamics of scene perception. (a) Two summary statistics, contrast energy (CE) and spatial coherence (SC), describe a feature space in which complex, cluttered images are on the right and simple, organized images are on the left (larger scenes depict representative exemplars). (b) SC predicts naturalness ratings, while CE predicts reaction times. Colour index indicates average rating across 14 human observers. (c) At occipital electrodes (i), CE parametrically modulates ERPs in a transient time window, while SC (ii) modulates ERPs in a broad time window up to 300 ms over parietal–occipital sites. (d) Naturalness ratings can be decoded from the ERPs as early as 100 ms post-stimulus. (e) During naturalness categorization, categorical differences and SC modulations are present both early (170 ms) and late (270 ms) in time. When scenes are task irrelevant, only early effects are present. Adapted from [99,100].

References

    1. Wolfe JM, Võ ML-H, Evans KK, Greene MR. 2011. Visual search in scenes involves selective and nonselective pathways. Trends Cogn. Sci. 15, 77–84. (10.1016/j.tics.2010.12.001) - DOI - PMC - PubMed
    1. Hong H, Yamins DLK, Majaj NJ, DiCarlo JJ. 2016. Explicit information for category-orthogonal object properties increases along the ventral stream. Nat. Neurosci. 19, 613–622. (10.1038/nn.4247) - DOI - PubMed
    1. Oliva A, Torralba A. 2007. The role of context in object recognition. Trends Cogn. Sci. 11, 520–527. (10.1016/j.tics.2007.09.009) - DOI - PubMed
    1. Stansbury DE, Naselaris T, Gallant JL. 2013. Natural scene statistics account for the representation of scene categories in human visual cortex. Neuron 79, 1025–1034. (10.1016/j.neuron.2013.06.034) - DOI - PMC - PubMed
    1. Edelman S. 2002. Constraining the neural representation of the visual world. Trends Cogn. Sci. 6, 125–131. (10.1016/S1364-6613(00)01854-4) - DOI - PubMed

Publication types

LinkOut - more resources