

Aberrant Expression Profile of Long Noncoding RNA in Human Sinonasal Squamous Cell Carcinoma by Microarray Analysis
- PMID: 28044124
- PMCID: PMC5156798
- DOI: 10.1155/2016/1095710
Aberrant Expression Profile of Long Noncoding RNA in Human Sinonasal Squamous Cell Carcinoma by Microarray Analysis
Abstract
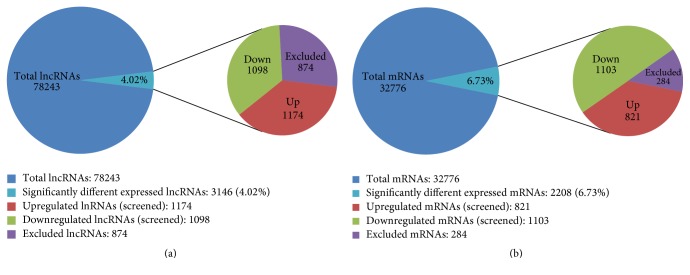
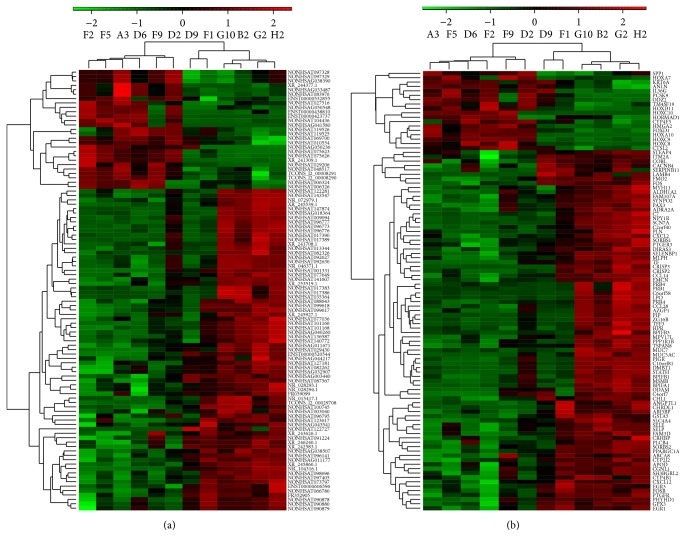
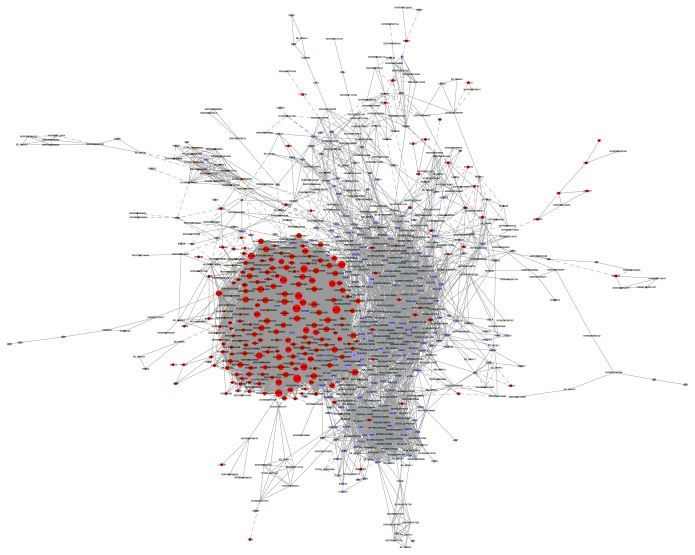
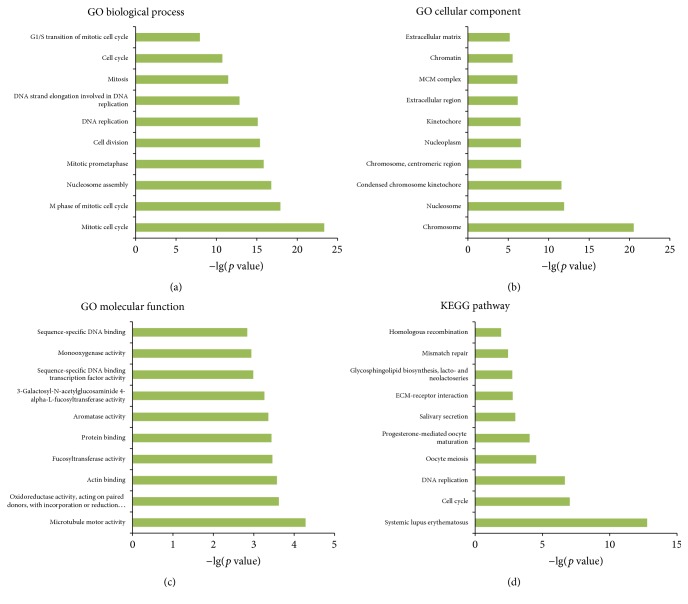
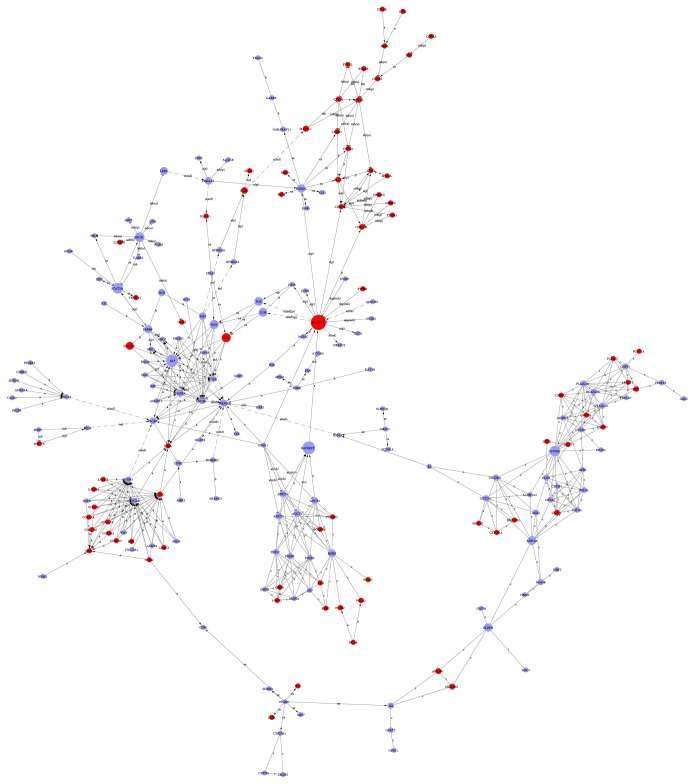
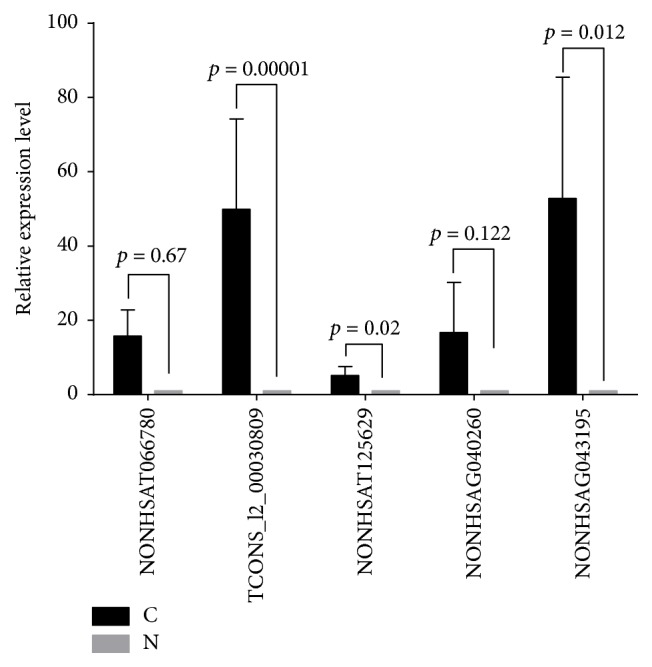
Objectives. This study aimed to identify aberrantly expressed long noncoding RNAs (lncRNAs) profile of sinonasal squamous cell carcinoma (SSCC) and explore their potential functions. Methods. We investigated lncRNA and mRNA expression in SSCC and paired adjacent noncancerous tissues obtained from 6 patients with microarrays. Gene ontology (GO) analysis and pathway analysis were utilized to investigate the gene function. Gene signal-network and lncRNA-mRNA network were depicted. Quantitative real-time polymerase chain reaction (qRT-PCR) was utilized to validate 5 lncRNAs in a second set of paired SSCC and adjacent noncancerous tissues obtained from 22 additional patients. Results. We identified significantly differentially expressed lncRNAs (n = 3146) and mRNAs (n = 2208) in SSCC relative to noncancerous tissues. The GO annotation indicated that there are some core gene products that may be attributed to the progress of SSCC. The pathway analysis identified many pathways associated with cancer. The results of lncRNA-mRNA network and gene signal-network implied some core lncRNAs/mRNAs might play important roles in SSCC pathogenesis. The results of qRT-PCR showed that all of the 5 lncRNAs were differentially expressed and consistent with the microarray results. Conclusion. Our study is the first screening and analysis of lncRNAs expression profile in SSCC and may offer new insights into pathogenesis of this disease.
Conflict of interest statement
The authors declare that they have no conflict of interests.
Figures
Similar articles
-
Integrated Analysis of Long Noncoding RNA and mRNA Expression Profile in Advanced Laryngeal Squamous Cell Carcinoma.PLoS One. 2016 Dec 29;11(12):e0169232. doi: 10.1371/journal.pone.0169232. eCollection 2016. PLoS One. 2016. PMID: 28033431 Free PMC article.
-
Comprehensive Analysis of Long Noncoding RNAs and Messenger RNAs Expression Profiles in Patients with Marjolin Ulcer.Med Sci Monit. 2018 Nov 2;24:7828-7840. doi: 10.12659/MSM.911177. Med Sci Monit. 2018. PMID: 30385735 Free PMC article.
-
Comprehensive analysis of the whole coding and non-coding RNA transcriptome expression profiles and construction of the circRNA-lncRNA co-regulated ceRNA network in laryngeal squamous cell carcinoma.Funct Integr Genomics. 2019 Jan;19(1):109-121. doi: 10.1007/s10142-018-0631-y. Epub 2018 Aug 21. Funct Integr Genomics. 2019. PMID: 30128795
-
Unraveling the oral cancer lncRNAome: Identification of novel lncRNAs associated with malignant progression and HPV infection.Oral Oncol. 2016 Aug;59:58-66. doi: 10.1016/j.oraloncology.2016.05.014. Oral Oncol. 2016. PMID: 27424183 Free PMC article. Review.
-
Inferring and analyzing module-specific lncRNA-mRNA causal regulatory networks in human cancer.Brief Bioinform. 2019 Jul 19;20(4):1403-1419. doi: 10.1093/bib/bby008. Brief Bioinform. 2019. PMID: 29401217 Review.
Cited by
-
A transcriptome profile in gallbladder cancer based on annotation analysis of microarray studies.Mol Med Rep. 2021 Jan;23(1):25. doi: 10.3892/mmr.2020.11663. Epub 2020 Nov 12. Mol Med Rep. 2021. PMID: 33179115 Free PMC article.
-
Down-regulating NEAT1 inhibited the viability and vasculogenic mimicry formation of sinonasal squamous cell carcinoma cells via miR-195-5p/VEGFA axis.Biosci Rep. 2020 Nov 27;40(11):BSR20201373. doi: 10.1042/BSR20201373. Biosci Rep. 2020. PMID: 33146672 Free PMC article.
References
MeSH terms
Substances
LinkOut - more resources
Full Text Sources
Other Literature Sources
Medical
