. 2017 Jan 3:7:39921.
doi: 10.1038/srep39921.

Batch effects and the effective design of single-cell gene expression studies

Affiliations

Batch effects and the effective design of single-cell gene expression studies

Po-Yuan Tung et al. Sci Rep. .

Abstract

Single-cell RNA sequencing (scRNA-seq) can be used to characterize variation in gene expression levels at high resolution. However, the sources of experimental noise in scRNA-seq are not yet well understood. We investigated the technical variation associated with sample processing using the single-cell Fluidigm C1 platform. To do so, we processed three C1 replicates from three human induced pluripotent stem cell (iPSC) lines. We added unique molecular identifiers (UMIs) to all samples, to account for amplification bias. We found that the major source of variation in the gene expression data was driven by genotype, but we also observed substantial variation between the technical replicates. We observed that the conversion of reads to molecules using the UMIs was impacted by both biological and technical variation, indicating that UMI counts are not an unbiased estimator of gene expression levels. Based on our results, we suggest a framework for effective scRNA-seq studies.


Figures
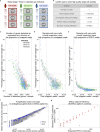
Figure 1
Figure 1. Experimental design and quality control of scRNA-seq.
(a) Three C1 96 well-integrated fluidic circuit (IFC) replicates were collected from each of the three Yoruba individuals. A bulk sample was included in each batch. (b) Summary of the cutoffs used to remove data from low quality cells that might be ruptured or dead (See Supplementary Fig. S1 for details). (c–e) To assess the quality of the scRNA-seq data, the capture efficiency of cells and the faithfulness of mRNA fraction amplification were determined based on the proportion of unmapped reads, the number of detected genes, the numbers of total mapped reads, and the proportion of ERCC spike-in reads across cells. The dash lines indicate the cutoffs summarized in panel (b). The three colors represent the three individuals (NA19098 in red, NA19101 in green, and NA19239 in blue), and the numbers indicate the cell numbers observed in each capture site on C1 plate. (f) Scatterplots in log scale showing the mean read counts and the mean molecule counts of each endogenous gene (grey) and ERCC spike-ins (blue) from the 564 high quality single cell samples before removal of genes with low expression. (g) mRNA capture efficiency shown as observed molecule count versus number of molecules added to each sample, only including the 48 ERCC spike-in controls remaining after removal of genes with low abundance. Each red dot represents the mean +/− SEM of an ERCC spike-in across the 564 high quality single cell samples.
Figure 2
Figure 2. The effect of sequencing depth and cell number on single cell UMI estimates.
Sequencing reads from all the high quality single cells collected for NA19239 were subsampled to the indicated sequencing depth and cell number, and subsequently converted to molecules using the UMIs. Each point represents the mean +/− SEM of 10 random draws of the indicated cell number. The left panel displays the results for 6,097 (50% of detected) genes with lower expression levels and the right panel the results for 6,097 genes with higher expression levels. (a) Pearson correlation of aggregated gene expression level estimates from single cells compared to the bulk sequencing samples. (b) Total number of genes detected with at least one molecule in at least one of the single cells. (c) Pearson correlation of cell-to-cell gene expression variance estimates from subsets of single cells compared to the full single cell data set.
Figure 3
Figure 3. Batch effect of scRNA-seq data using the C1 platform.
(a) Violin plots of the number of total ERCC spike-in molecule-counts in single cell samples per C1 replicate. (b) Scatterplot of the total ERCC molecule-counts and total gene molecule-counts. The colors represent the three individuals (NA19098 is in red, NA19101 in green, and NA19239 in blue). Data from different C1 replicates is plotted in different shapes. (c and d) Violin plots of the reads to molecule conversion efficiency (total molecule-counts divided by total read-counts per single cells) by C1 replicate. The endogenous genes and the ERCC spike-ins are shown separately in (c) and (d), respectively. There is significant difference across individuals of both endogenous genes (P < 0.001) and ERCC spike-ins (P < 0.05). The differences across C1 replicates per individual of endogenous genes and ERCC spike-ins were also evaluated (both P < 0.01).
Figure 4
Figure 4. Normalization and removal of technical variability.
Principal component (PC) 1 versus PC2 of the (a) raw molecule counts, (b) log2 counts per million (cpm), (c) Poisson transformed expression levels (accounting for technical variability modeled by the ERCC spike-ins), and (d) batch-corrected expression levels. The colors represent the three individuals (NA19098 in red, NA19101 in green, and NA19239 in blue). Data from different C1 replicates is plotted in different shapes.
Figure 5
Figure 5. Cell-to-cell variation in gene expression.
Adjusted CV plotted against average molecule counts across all cells in (a) and across only the cells in which the gene is expressed (b), including data from all three individuals. Each dot represents a gene, and the color indicates the corresponding gene-specific dropout rate (the proportion of cells in which the gene is undetected). (c and d) Venn diagrams showing the overlaps of top 1000 genes across individuals based on mean expression level in (c) and based on adjusted CV values in (d), considering only the cells in which the gene is expressed. (e and f ) Similarly, Venn diagrams showing the overlaps of top 1000 genes across individuals based on mean expression level in (e) and based on adjusted CV values in (f ), across all cells.

References

    1. Macaulay I. C. & Voet T. et al.. Single cell genomics: advances and future perspectives. PLoS Genet 10, e1004126 (2014). - PMC - PubMed
    1. Saliba A. E., Westermann A. J., Gorski S. A. & Vogel J. et al.. Single-cell RNA-seq: advances and future challenges. Nucleic Acids Res 42, 8845–60 (2014). - PMC - PubMed
    1. Macosko E. Z. et al.. Highly parallel genome-wide expression profiling of individual cells using nanoliter droplets. Cell 161, 1202–14 (2015). - PMC - PubMed
    1. Handel A. E. et al.. Assessing similarity to primary tissue and cortical layer identity in induced pluripotent stem cell-derived cortical neurons through single-cell transcriptomics. Hum Mol Genet 25, 989–1000 (2016). - PMC - PubMed
    1. Drissen R. et al.. Distinct myeloid progenitor-differentiation pathways identified through single-cell RNA sequencing. Nat Immunol doi: 10.1038/ni.3412 (2016). - DOI - PMC - PubMed

Publication types