. 2017 Mar 17;12(3):702-714.
doi: 10.1021/acschembio.6b01117. Epub 2017 Jan 24.

Probing the Allosteric Role of the α5 Subunit of α3β4α5 Nicotinic Acetylcholine Receptors by Functionally Selective Modulators and Ligands

Affiliations

Probing the Allosteric Role of the α5 Subunit of α3β4α5 Nicotinic Acetylcholine Receptors by Functionally Selective Modulators and Ligands

Caroline Ray et al. ACS Chem Biol. .

Abstract

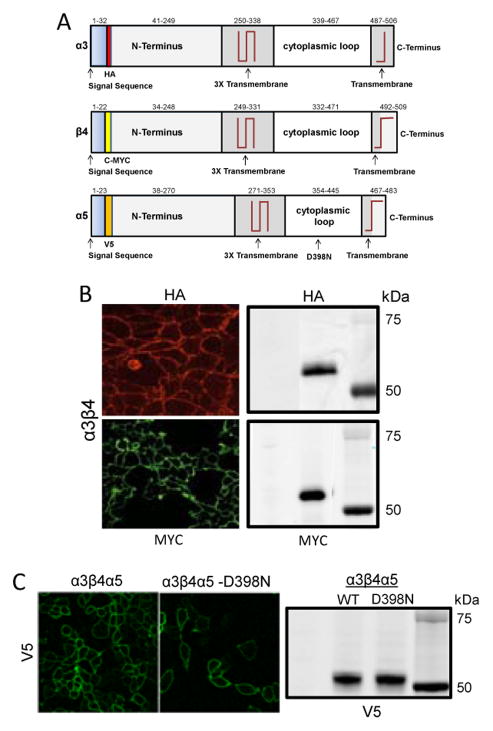
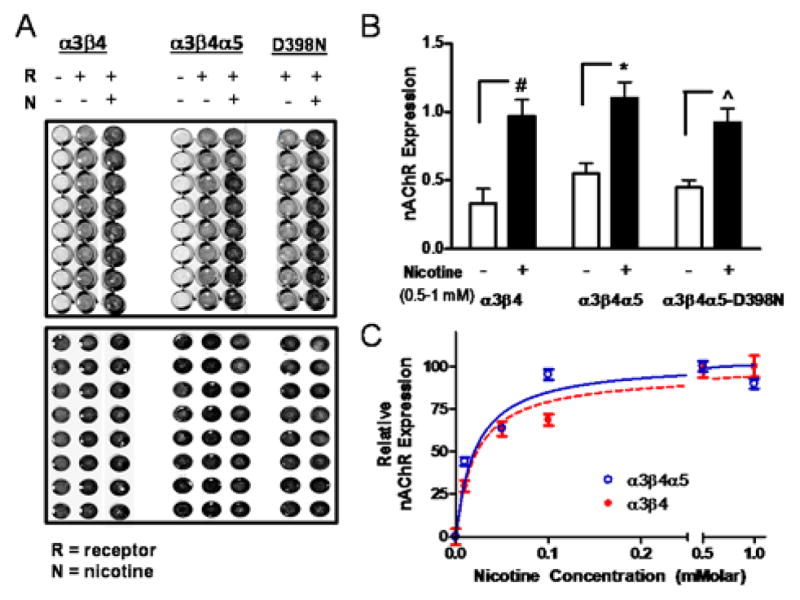
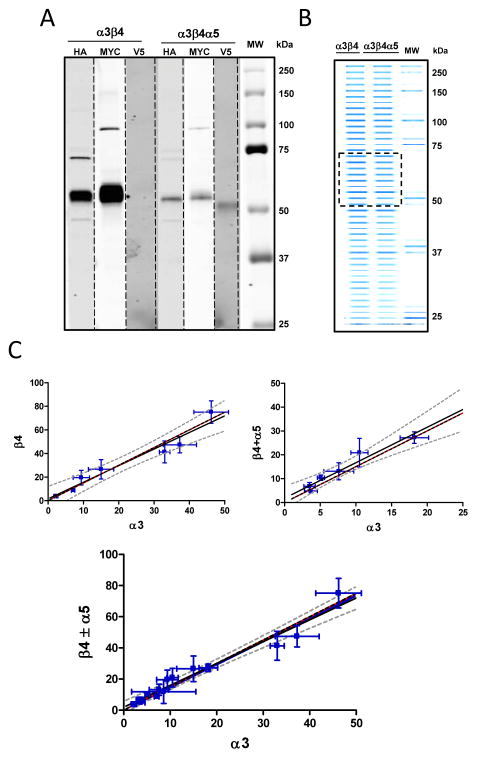
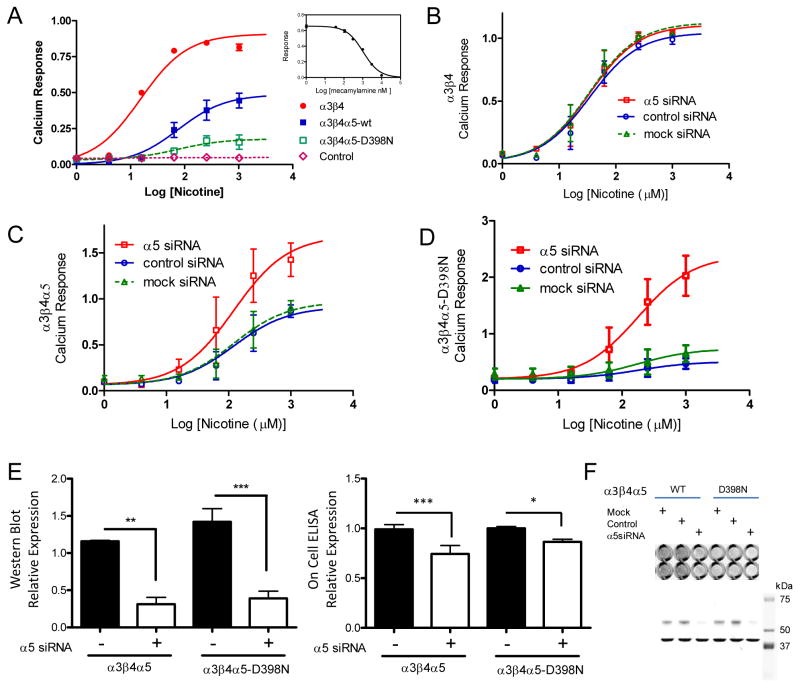
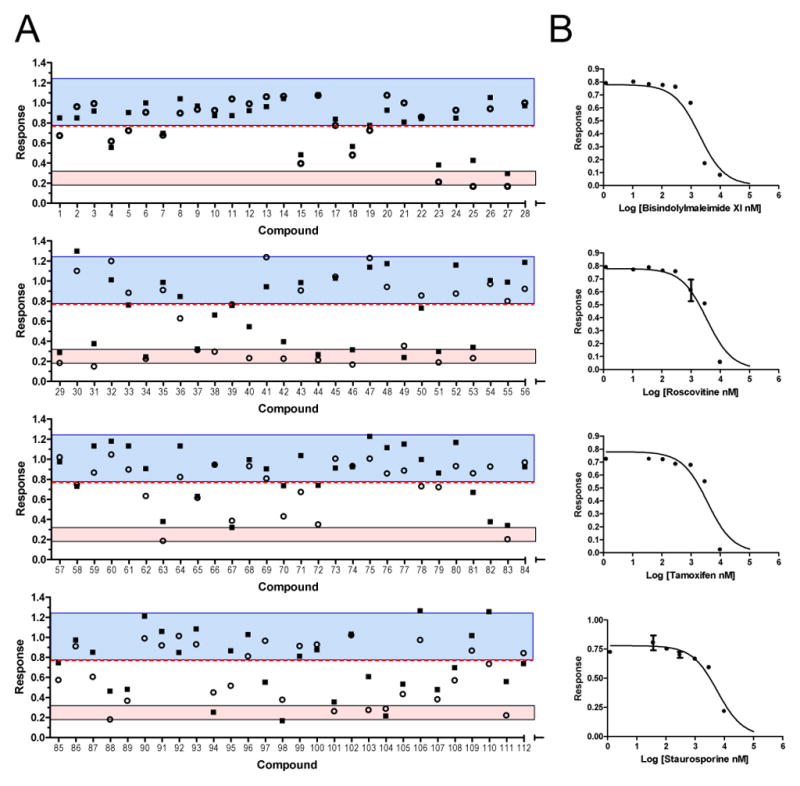
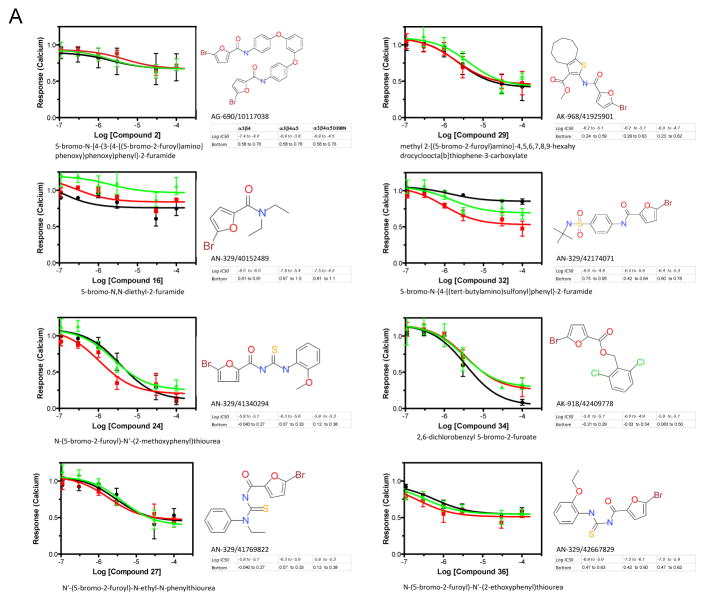
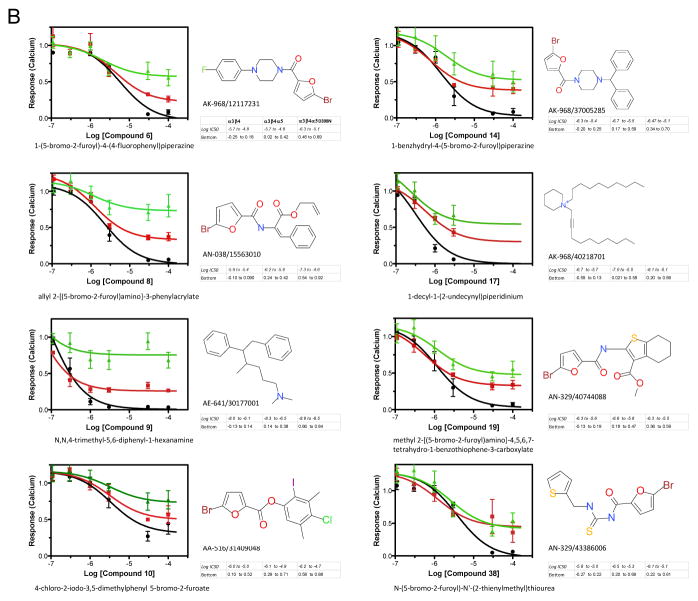
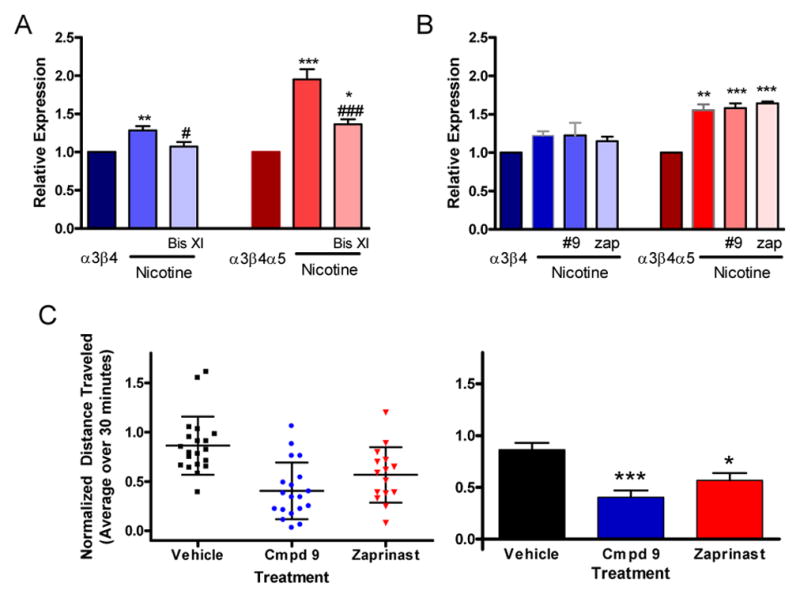
Nicotinic acetylcholine receptors regulate the nicotine dependence encountered with cigarette smoking, and this has stimulated a search for drugs binding the responsible receptor subtypes. Studies link a gene cluster encoding for α3β4α5-D398N nicotinic acetylcholine receptors to lung cancer risk as well as link a second mutation in this cluster to an increased risk for nicotine dependence. However, there are currently no recognized drugs for discriminating α3β4α5 signaling. In this study, we describe the development of homogeneous HEK-293 cell clones of α3β4 and α3β4α5 receptors appropriate for drug screening and characterizing biochemical and pharmacological properties of incorporated α5 subunits. Clones were assessed for plasma membrane expression of the individual receptor subunits by mass spectrometry and immunochemistry, and their calcium flux was measured in the presence of a library of kinase inhibitors and a focused library of acetylcholine receptor ligands. We demonstrated an incorporation of two α3 subunits in approximately 98% of plasma membrane receptor pentamers, indicating a 2/3 subunit expression ratio of α3 to β4 alone or to coexpressed β4 and α5. With prolonged nicotine exposure, the plasma membrane expression of receptors with and without incorporated α5 increased. Whereas α5 subunit expression decreased the cell calcium response to nicotine and reduced plasma membrane receptor number, it partially protected receptors from nicotine mediated desensitization. Hit compounds from both libraries suggest the α5 and α5-D398N subunits allosterically modify the behavior of nicotine at the parent α3β4 nicotinic acetylcholine receptor. These studies identify pharmacological tools from two distinct classes of drugs, antagonists and modifiers that are α5 and α5-D398N subtype selective that provide a means to characterize the role of the CHRNA5/A3/B4 gene cluster in smoking and cancer.


Figures

Figure 1
Figure 1. Expression of components of the nAChR α3β4α5 in HEK 293 cells
A. Diagram of the different subunits of the α3β4α5 nAChR showing position of the HA, MYC, and V5 epitope tags, relative positions of the transmembrane regions, and the location of the D398N mutation in the α5 subunit. B. Immunofluorescence localization of the expression of the α3, β4 subunits of the nAChR on the plasma membrane as components of the complete α3β4 receptor in a permanently transfected line of live, non permeabilized HEK-293 cells. A corresponding SDS-PAGE gel evaluated with the same antibodies also demonstrates the expression of both α3 and β4 subunits in these cells. C. Fluorescence images comparable to those in (B) of cells in which the α5 subunits are also expressed as part of the complete α3β4α5 receptor imaged using a primary anti V5 antibody. The corresponding western blot is shown below. Fluorescence images of secondary fluorescent antibodies were acquired using the fluorescein and rhodamine channels with a 40X plan apochromat NA 1.4 oil objective on a Zeiss LSM-510 confocal microscope.
Figure 2
Figure 2. Plasma Membrane Expression of nAChR subunits in HEK-293 cells
A. The expressions of the different subunit combinations were measured by on-cell ELISA in a 96 well plate format on live cells using a primary antibody against the MYC epitope for α3β4 receptors and the V5 epitope for α3β4α5 WT and D398N receptors (upper image). Data from individual wells were normalized by the well’s cell number, determined independently using the cell permeable fluorescent, infrared dye IR800CWNHS (lower image). B. The plasma membrane expression levels for each receptor type correspond to 0 nicotine exposure, white bars, and 1 mM nicotine exposure black bars. The receptor expression levels are presented as order pairs of values representing the mean ± STD and are as follows: α3β4, (0.33 ± 0.11, 0.971 ± 0.12); α3β4α5, (0.55 ± 0.07, 1.10 ± 0.11); α3β4α5-D398N, (0.45 ± 0.05, 0.92 ± 0.10). Individual experiments, N = 3, were performed in replicates of 8–16 wells C. Dose response of the change in receptor expression in the presence of various concentrations of nicotine. Background subtracted results were normalized by the response at 1 mM nicotine and data are presented as the mean ± SEM of the normalized response.
Figure 3
Figure 3. Expression of plasma membrane components of the nAChR α3β4 and α3β4α5 from HEK 293 cells as measured by mass spectrometry
Stable cell lines expressing α3β4 or α3β4α5 were biotinylated on the cell surface and purified on avidin resin for use in mass spec analysis. A. Shown is a composite of western blots against the different subunits using anti epitope antibodies. B. Image of an Acqua-stained (a coomassie blue based protein reagent), SDS-Page gel containing biotinylated plasma membrane proteins from the cell lines. The material between 50–75 kDa designated by the hatched box was cut from the gel and eluted for mass spectrometry. C. Plotted are mass spectrometry ratio determinations with standard deviations (error bars) from seven (left plot) and six (right plot) independent preparations of the relative ratios of nAChR receptor subunits. Data were fit by linear regression. The red reference lines have slopes of 1.5. Results for the best fit lines describing the subunit ratios are in blue and are flanked by the 95% confidence intervals (hatched curves). From left to right image to below the slopes of the lines have the values as mean ± std error (1.41 ± 0.15, 1.49 ± 0.19, 1.47 ± 0.06). The ratio of α5 to β4 subunits, α5β4 with the corresponding paired β4 measurement of the six determinations, ( α5β4, β4),were: (0.17, 8.9); (0.12, 24.3); (0.45, 4.7); (0.44, 3.4); (0.10, 10.8); (0.22, 17.1).
Figure 4
Figure 4. Subunit Dependence of the Calcium Response of the nAChR Permanent Cell Lines
Receptor subunits were expressed in HEK-293 cells also permanently expressing a mitochondrial localized aequorin-based calcium reporter. Calcium response data per well were normalized by the total calcium response in that well determined upon cell lysis (see Methods). Measurements at given concentrations were performed at least in triplicate and the sigmoid concentration response curves of the different receptor variants were fit using GraphPad prism version 5.0 to determine the parameters basal response and maximal response (presented as mean ± sem), and additionally the EC50 95% CI. A. Results were respectively, α3β4 (0.0 ± 0.04, 0.9 ± 0.03, 11–21, N = 5), α3β4α5 (0.0 ± 0.03, 0.49 ± 0.06, 29–199, N = 6), α3β4α5-D398N (0.03 ± 0.02, 0.18 ± 0.11, 11–503, N = 3). Cells expressing only the reporter showed no response. Insert shows control demonstrating the effect of the antagonist mecamylamine on α3β4 signaling. B–D. Responses were measured in the presence of siRNA against the α5 subunit. (B) Data were fit with a shared parameter model (GraphPad Prism) for basal /maximal /EC50 95% CI, (0.01±0.04, 1.09±0.04, 23–53 μM, N=3). (C) The common fitting parameters were basal/EC50 95% CI of (0.06±0.06, 56–263 μM) and maximal responses of 1.69 ± 0.18, 0.91 ± 0.13, 0.97 ± 0.14, N=3. (D) The common fitting parameters were basal/EC50 95% CI of (0.20±0.06, 78–407 μM) and maximal responses of 2.4± 0.28, 0.51 ± 0.15, 0.74 ± 0.16, N=3. E. Shown in the bar graph are the effects of siRNA treatment on whole cell expression of α5 wild type and D398N subunits in stable cell line as determined by the corresponding subunit western blots. Data corresponding to control and siRNA knockdown plasmids are presented as mean ± STD. For the western blot they are, α3β4α5 (1.16 ± 0.02, 0.31 ± 0.16, N=3); α3β4α5-D398N (1.42 ± 0.31, 0.39 ± 0.17, N=3) and for the on-cell determination are, α3β4α5 (0.99 ± 0.047, 0.74 ± 0.084, N=4); α3β4α5-D398N (1.00 ± 0.017, 0.86 ± 0.026, N=4 with eight replicates analyzed for each condition). F. The lower section shows a representative western blot corresponding to the α5 subunit determinations (bands at 54 kDa) and normalizing GAPDH bands at 37 kDa. The right-hand upper image shows representative sections of a 96 well plate from a LiCor on-cell determination of α5 plasma membrane subunit expression as a function of siRNA treatment.
Figure 5
Figure 5. Screening of a Kinase Inhibitor Library against Cell Lines Expressing nAChR
A. Cells were treated with 20 μM nicotine in the presence of 12.5 μM library compound and analyzed in the aequorin calcium assay as described above. The blue shaded area represents compounds lying within three standard deviations of the normalized mean response in the presence of nicotine plus vehicle (compounds 22, 24, 26, 28, 30, 32; mean ± std/1.00±0.07, n = 12). The red shaded area represents compounds within the 95% confidence interval of the nAChR antagonist mecamylamine (compounds 23, 25, 27, 29, 31; mean ± std/0.26±0.02, n=10). The square and circular points represent the results of two independent assays. Data were analyzed using GraphPad Prism ver. 5. B. The four panels are representative dose responses for triplicate wells in the primary calcium assay of a subset of hits from the primary screen that were chosen as controls for validation purposes. The IC50s for the 95% confidence intervals were: bisindolylmaleimide XI (0.81 to 3.1 μM), roscovitine (2.3 to 6.2 μM), tamoxifen (2.5 to 7.9 μM), and staurosporine (2.2 to 6.8 μM) (N = 3).
Figure 6
Figure 6. Screening of a Directed Library against Cell Lines Expressing α3β4, α3β4α5 and α3β4α5D398N nAChRs
Antagonist assays for compounds from the directed Specs Library that were considered hits in the primary screen were performed as described. Dose responses were calculated from triplicate wells in three independent experiments to determine the effects of compounds on inhibition of the whole cell calcium mediated nicotine response (100 μM) in HEK-293 cell-lines permanently transfected with one of the nAChRs. Data were analyzed using GraphPad Prism 5.0 and the results for the IC50’s and Efficacies (indicated as Bottom of the curve) are presented as 95% confidence intervals. Solid black line is the α3β4-nAChR, solid red line is the α3β4α5-nAChR and the solid green line represents the α3β4α5D398N-nAChR A. Representative compounds from the secondary screen that showed antagonist activity but that did not show any distinct bias for at least one of the three receptor subtypes. B. Compounds that displayed bias or preference in antagonizing the signaling of at least one of the receptor subtypes when compared to the other two.
Figure 7
Figure 7. Secondary Screening of Representative Hit Compounds
Relative expression of α3β4 and α3β4α5 nAChRs upon upregulation by 0.5 mM nicotine, and (A) 0.5 mM nicotine plus 1.0 μM bisindolylmaleimide XI or (B) 0.5 mM nicotine plus 10 μM compound 9 and 0.5 mM nicotine plus 10 μM zaprinast. Results expressed as mean ± sem were normalized to the surface expression of the respective vehicle treated parent receptor and assessed by repeated measure anova. A. α3β4 plus vehicle = 1, plus nicotine alone (1.28 ± 0.057) and with nicotine plus Bis XI (1.07 ± 0.059), vs. α3β4 ** p < 0.01, vs. α3β4 plus nicotine # p < 0.05; α3β4α5 plus vehicle = 1, plus nicotine alone (2.05 ± 0.16) and with nicotine plus Bis XI (1.36 ± 0.065), vs. α3β4α5 * p < 0.05 and *** p < 0.001, vs. α3β4α5 plus nicotine ### p < 0.001, (N = 6) B. α3β4 plus vehicle = 1, plus nicotine alone (1.22 ± 0.053) and with nicotine plus #9 (1.23 ± 0.16), plus nicotine plus zap (1.16 ± 0.06); α3β4α5 plus vehicle = 1, plus nicotine alone (1.56 ± 0.076) and with nicotine plus #9 (1.58 ± 0.063), plus nicotine plus zap (1.64 ± 0.025), vs. α3β4α5 ** p < 0.01 and *** p < 0.001, (N = 3). The compounds added alone at the same concentration as specified above without nicotine present had no effect on receptor expression upregulation, α3β4 plus vehicle = 1, plus #9 (1.05 ± 0.10), plus zap (1.03 ± 0.03); α3β4α5 plus vehicle = 1, plus #9 (0.97 ± 0.04), plus zap (0.95 ± 0.01), (N = 3). Data were analyzed by repeated measures anova with Tukey’s multiple comparison test C. Scatter plots of experimental values (left image) and bar graphs summarizing these results (right image) of locomotion data for DAT-KO mice. The plots show relative average locomotion for the 30 minute period following the various treatments. Values for each condition are normalized by the pre-treatment average of that group for 20 minutes prior to injection.. Error bars in the scatter plot represent mean ± std. In the column graph the error bars represent mean ± sem and these results are: for the vehicle group (0.86 ± 0.066, N = 20), for compound 9 (0.40 ± 0.066, N = 19), and for zaprinast (0.57 ± 0.073, N = 15). Data were analyzed by one way anova with Tukey’s multiple comparison test, * p < 0.05 and *** p < 0.001.

References

    1. Bierut LJ. Convergence of genetic findings for nicotine dependence and smoking related diseases with chromosome 15q24–25. Trends Pharmacol Sci. 2010;31:46–51. - PMC - PubMed
    1. Ambrosi P, Becchetti A. Targeting neuronal nicotinic receptors in cancer: new ligands and potential side-effects. Recent patents on anti-cancer drug discovery. 2013;8:38–52. - PubMed
    1. Decker MW, Sullivan JP, Arneric SP, Williams M. Neuropsychopharmacology: the fifth generation of progress -Neuronal Nicotinic Acetylcholine Receptors: Novel Targets for CNS Therapeutics. Lippincott Williams & Wilkins; Philadelphia: 2002.
    1. Administration, F.-U. S. F. a. D. FDA 101: Smoking Cessation Products. 2016 http://www.fda.gov/ForConsumers/ConsumerUpdates/ucm198176.htm.
    1. Taly A, Corringer PJ, Guedin D, Lestage P, Changeux JP. Nicotinic receptors: allosteric transitions and therapeutic targets in the nervous system. Nat Rev Drug Discov. 2009;8:733–750. - PubMed

Publication types

LinkOut - more resources