. 2017 Jan 3;12(1):e0168513.
doi: 10.1371/journal.pone.0168513. eCollection 2017.

Classification of Animal Movement Behavior through Residence in Space and Time

Affiliations

Classification of Animal Movement Behavior through Residence in Space and Time

Leigh G Torres et al. PLoS One. .

Abstract

Identification and classification of behavior states in animal movement data can be complex, temporally biased, time-intensive, scale-dependent, and unstandardized across studies and taxa. Large movement datasets are increasingly common and there is a need for efficient methods of data exploration that adjust to the individual variability of each track. We present the Residence in Space and Time (RST) method to classify behavior patterns in movement data based on the concept that behavior states can be partitioned by the amount of space and time occupied in an area of constant scale. Using normalized values of Residence Time and Residence Distance within a constant search radius, RST is able to differentiate behavior patterns that are time-intensive (e.g., rest), time & distance-intensive (e.g., area restricted search), and transit (short time and distance). We use grey-headed albatross (Thalassarche chrysostoma) GPS tracks to demonstrate RST's ability to classify behavior patterns and adjust to the inherent scale and individuality of each track. Next, we evaluate RST's ability to discriminate between behavior states relative to other classical movement metrics. We then temporally sub-sample albatross track data to illustrate RST's response to less resolved data. Finally, we evaluate RST's performance using datasets from four taxa with diverse ecology, functional scales, ecosystems, and data-types. We conclude that RST is a robust, rapid, and flexible method for detailed exploratory analysis and meta-analyses of behavioral states in animal movement data based on its ability to integrate distance and time measurements into one descriptive metric of behavior groupings. Given the increasing amount of animal movement data collected, it is timely and useful to implement a consistent metric of behavior classification to enable efficient and comparative analyses. Overall, the application of RST to objectively explore and compare behavior patterns in movement data can enhance our fine- and broad- scale understanding of animal movement ecology.


Conflict of interest statement

The National Institute of Water and Atmospheric Research, Ltd. (NIWA) provided support in the form of salaries for authors LGT and DRT, and the collection of the Galapagos tortoise track was supported by e-obs GmbH, but these commercial affiliations do not alter our adherence to PLOS ONE policies on sharing data and materials.

Figures

Fig 1
Fig 1. Conceptual schematic of behavior groupings captured in movement data based on the relationships between the amount of space (distance) and time occupied in an area of constant scale.
Three polar behavior states across this continuum are represented in the corners: Transit (low time, low distance in an area), time intensive behaviors such as rest (high time, low distance), and time and distance intensive behaviors (high time, large distance) such as area restricted search (ARS). Three other possible behavior states are denoted within the continuum of this schematic. When applying RST, the origin will be double the sampling interval (y-axis) and double the R applied (x-axis), which are the minimal scales at which behaviors can be described.
Fig 2
Fig 2. Scale plot of grey-headed albatross GPS track illustrating how radius size influences the proportion of positive (blue), negative (red) and zero (black) residuals.
Dark gray bar = fixed radius (R = 1.935). Light gray bar = dynamically scaled radius (R = 1.9). Dashed line indicates 5% transit points.
Fig 3
Fig 3. RST analysis of example grey-headed albatross GPS track.
Day and night (shaded) periods compared to (a) normalized residence distance (black) relative to normalized residence time (blue), and (b) residuals of normalized residence distance minus normalized residence time (positive = blue, negative = red; zero = black). (c) GPS track color coded by residuals (black = transit, red = rest, blue = area restricted search). The three movement states identified by RST are illustrated and (d) enlarges a region of the track to demonstrate the classification of three locations into these movement states within the applied radius size. Grey arrows indicate direction of travel. Green star is colony location at Campbell Island, New Zealand.
Fig 4
Fig 4. Frequency histograms of RST residuals relative to classical movement metrics (straightness index, residence time, residence distance, and speed,) for points along the grey-headed albatross track (Bird 23059).
(a) Depicts only the ‘true’ behavior states of rest (red), transit (black), and area restricted search (blue) as agreed on by expert classifiers. Bars are colored based on RST classification with transparency so that overlap between distributions is illustrated. (b) Describes the distribution of all points along the track (white) and the ambiguous points where the classifiers did not agree on behavior state assignment (black).
Fig 5
Fig 5. Behavioral state, based on positive, negative, or zero residuals, agreement plots relative to 5-min interval track for (a) population level temporal sub-sampling of all incubation albatross tracks (shaded areas represent SD), and (b) stochastic sampling of one albatross track (notch = median, whiskers represent 1.5 * inter-quartile range).
Blue = area restricted search (positive residuals); red = rest (negative residuals); black = transit (zero residuals).
Fig 6
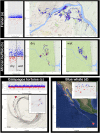
Fig 6. Application of RST to four diverse movement datasets.
(a) 2-month GPS fisher track in an urban area of New York, USA, and residuals (tag M4 [22, 23]). (b) 2-month GPS African buffalo track and residuals split at 11 Nov 2005 to demonstrate behavior and distribution change with onset of wet season (tag 1764827 [24]). (c) Residuals from 5-year GPS Galapagos tortoise track, and spatial representation of track segment from 1 Aug 2011 to 30 Mar 2012; inset map shows fine-scale movements in southeastern area (tag 1388 [25]). (d) 5-month satellite telemetry blue whale track starting off southern California and ending near the Costa Rica Dome, and residuals (tag 23043 [26, 27]). Maps produced using R code by Kahle and Wickham [19].
Fig 7
Fig 7. Scale plots derived using dynamic scaling choice of radius size (R) for Residence in Space and Time (RST) analysis of the fisher GPS track, African buffalo GPS track, Galapagos tortoise GPS track and blue whale satellite telemetry track.
The comparison illustrates how R influences the proportion of positive (blue), negative (red) and zero (black) residuals. Dashed line indicates 5% transit points. Light gray line indicates the dynamically scaled R for each track: Fisher (R = 40 m), African buffalo (R = 375 m), Galapagos tortoise (R = 25 m), blue whale (R = 35 km).

Similar articles

Cited by

References

    1. Fauchald P, Tveraa T. Using first-passage time in the analysis of area-restricted search and habitat selection. Ecology. 2003; 84: 282–8.
    1. Barraquand F, Benhamou S. Animal movements in heterogeneous landscapes: Identifying profitable places and homogeneous movement bouts. Ecology. 2008; 89: 3336–48. - PubMed
    1. Pedersen MW, Patterson TA, Thygesen UH, Madsen H. Estimating animal behavior and residency from movement data. Oikos. 2011; 120: 1281–90.
    1. Kareiva P, Odell G. Swarms of Predators Exhibit "Preytaxis" if Individual Predators Use Area-Restricted Search. Am Nat. 1987; 130: 233–70.
    1. Gurarie E, Andrews RD, Laidre KL. A novel method for identifying behavioural changes in animal movement data. Ecol Lett. 2009; 12: 395–408. 10.1111/j.1461-0248.2009.01293.x - DOI - PubMed

LinkOut - more resources