. 2017 Jan 3;12(1):e0169156.
doi: 10.1371/journal.pone.0169156. eCollection 2017.

The Diversity-Weighted Living Planet Index: Controlling for Taxonomic Bias in a Global Biodiversity Indicator

Affiliations

The Diversity-Weighted Living Planet Index: Controlling for Taxonomic Bias in a Global Biodiversity Indicator

Louise McRae et al. PLoS One. .

Abstract

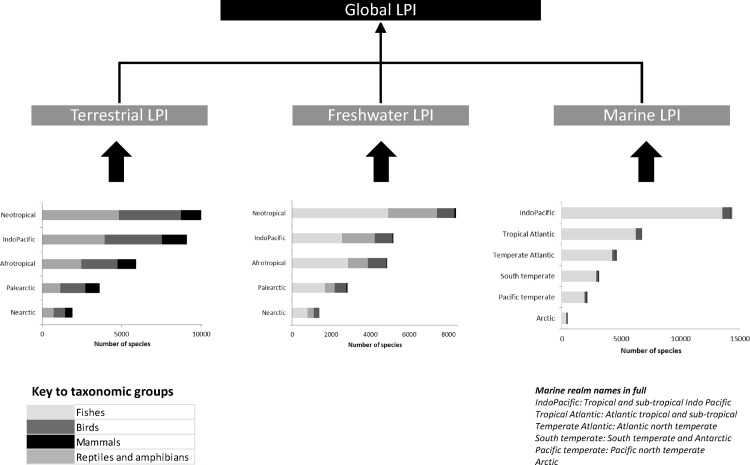
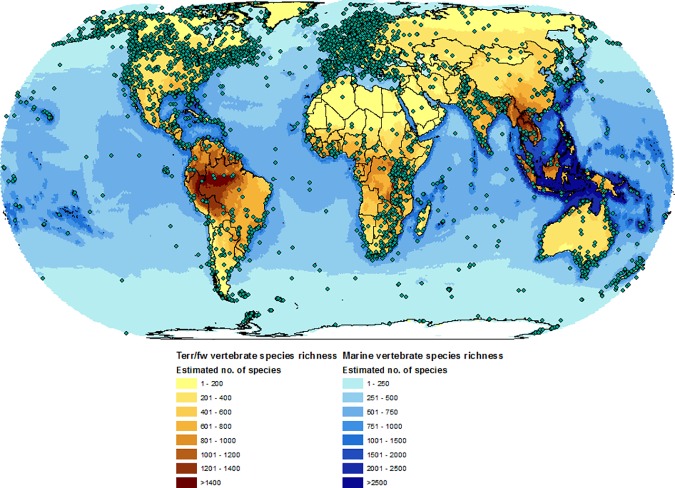
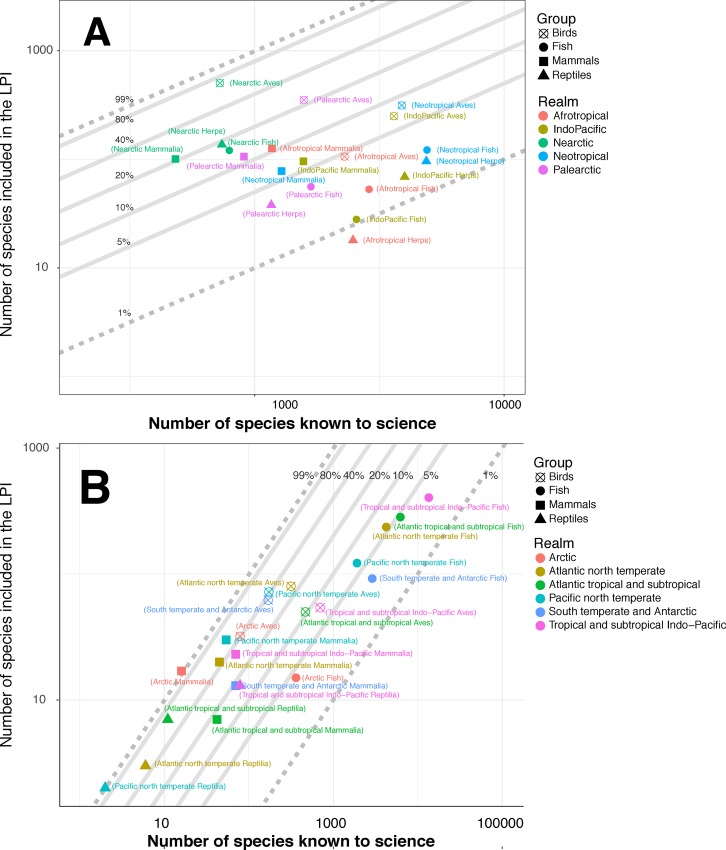
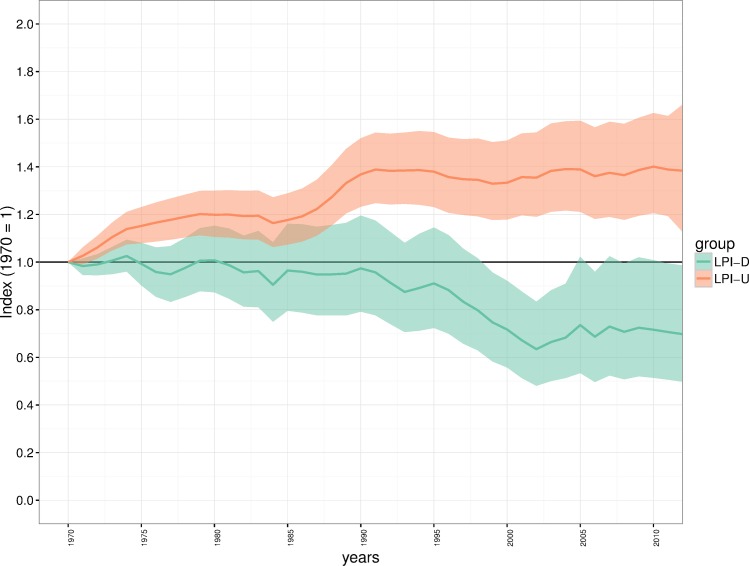
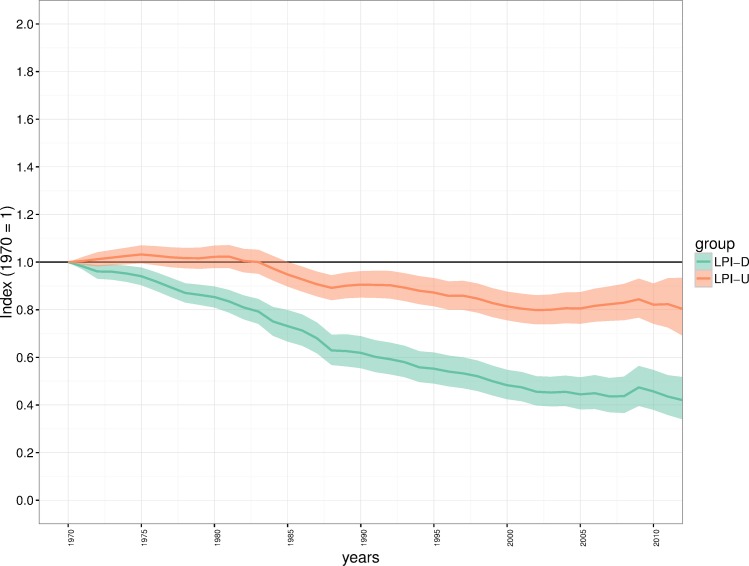
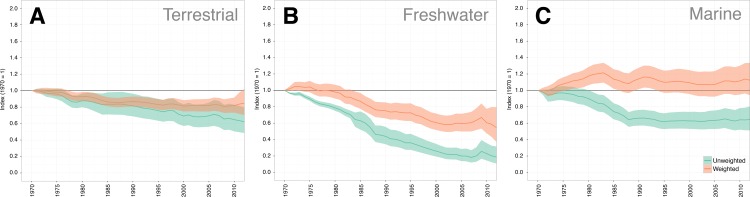
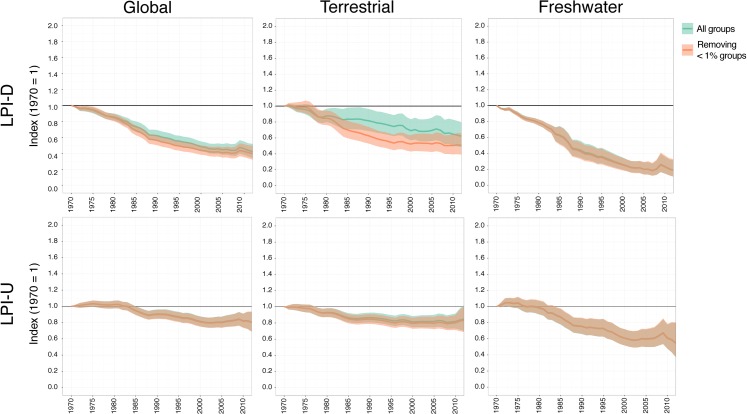
As threats to species continue to increase, precise and unbiased measures of the impact these pressures are having on global biodiversity are urgently needed. Some existing indicators of the status and trends of biodiversity largely rely on publicly available data from the scientific and grey literature, and are therefore prone to biases introduced through over-representation of well-studied groups and regions in monitoring schemes. This can give misleading estimates of biodiversity trends. Here, we report on an approach to tackle taxonomic and geographic bias in one such indicator (Living Planet Index) by accounting for the estimated number of species within biogeographical realms, and the relative diversity of species within them. Based on a proportionally weighted index, we estimate a global population decline in vertebrate species between 1970 and 2012 of 58% rather than 20% from an index with no proportional weighting. From this data set, comprising 14,152 populations of 3,706 species from 3,095 data sources, we also find that freshwater populations have declined by 81%, marine populations by 36%, and terrestrial populations by 38% when using proportional weighting (compared to trends of -46%, +12% and +15% respectively). These results not only show starker declines than previously estimated, but suggests that those species for which there is poorer data coverage may be declining more rapidly.


Conflict of interest statement

The authors have declared that no competing interests exist.

Figures

Fig 1
Fig 1. Schematic of the weighting process.
Systems (Terrestrial/Freshwater/Marine) are weighted equally. Within each system, the proportion of species found across the realms that compose that system (the length of the bars above) is used to proportionally weight each realm's index. Within each realm, the diversity of species is used to weight taxonomic indices (the size of the grey-scale sections of the bars above).
Fig 2
Fig 2. Global vertebrate richness map overlaid with populations recorded in the Living Planet Database.
Species richness map reproduced from [20]
Fig 3
Fig 3. Comparison of number of known species and number of species recorded within the Living Planet Database.
Colours represent different biogeographic realms, shapes indicate species groups and overlaid lines show 1 and 99% representation (dotted) and increments in between (solid). A–terrestrial and freshwater species and realms; B–marine species and realms
Fig 4
Fig 4. Comparison of the unweighted and diversity weighted Living Planet Index for the Palearctic realm.
Green shows the unweighted index (LPI-U), orange shows the diversity weighted index (LPI-D). Solid coloured lines show the average trend and shaded regions show the 95% confidence interval of that trend.
Fig 5
Fig 5. Comparison of the unweighted and diversity-weighted Living Planet Index for the global data set.
Green shows the unweighted index (Global LPI-U), orange shows the diversity weighted index (Global LPI-D). Solid coloured lines show the average trend and shaded regions show the 95% confidence interval of that trend.
Fig 6
Fig 6
Comparison of the unweighted and diversity weighted Living Planet Index for each System (A -Terrestrial, B -Freshwater and C -Marine). In each case, green shows the unweighted index (LPI-U), orange shows the diversity weighted index (LPI-D). Solid coloured lines show the average trend and shaded regions show the 95% confidence interval of that trend.
Fig 7
Fig 7. The impact of removing species groups for which the Living Planet Database has < 1% representation.
Green trends show the Living Planet Index for all groups, orange trends show trends without less represented groups. Upper row shows trends calculated using the weighted (LPI-D) method, lower rows show the unweighted (LPI-U) method. Solid lines show the average trend, shaded regions show 95% confidence intervals. Stars (*) indicate when the final 2012 index values are significantly different.

Similar articles

Cited by

References

    1. Collen B, Nicholson E (2014) Taking the measure of change. Science 346: 166–167. 10.1126/science.1255772 - DOI - PubMed
    1. Dirzo R, Young HS, Galetti M, Ceballos G, Isaac NJB, et al. (2014) Defaunation in the Anthropocene. Science 345: 401–406. 10.1126/science.1251817 - DOI - PubMed
    1. Tittensor DP, Walpole M, Hill SLL, Boyce DG, Britten GL, et al. (2014) A mid-term analysis of progress toward international biodiversity targets. Science 346: 241–244. 10.1126/science.1257484 - DOI - PubMed
    1. De Vos JM, Joppa LN, Gittleman JL, Stephens PR, Pimm SL (2015) Estimating the normal background rate of species extinction. Conservation Biology 29: 452–462. 10.1111/cobi.12380 - DOI - PubMed
    1. Ceballos G, Ehrlich PR, Barnosky AD, García A, Pringle RM, et al. (2015) Accelerated modern human–induced species losses: Entering the sixth mass extinction. Science Advances 1. - PMC - PubMed