. 2017 Jan 3;12(1):e0169073.
doi: 10.1371/journal.pone.0169073. eCollection 2017.

Loss of BOSS Causes Shortened Lifespan with Mitochondrial Dysfunction in Drosophila

Affiliations

Loss of BOSS Causes Shortened Lifespan with Mitochondrial Dysfunction in Drosophila

Ayako Kohyama-Koganeya et al. PLoS One. .

Abstract

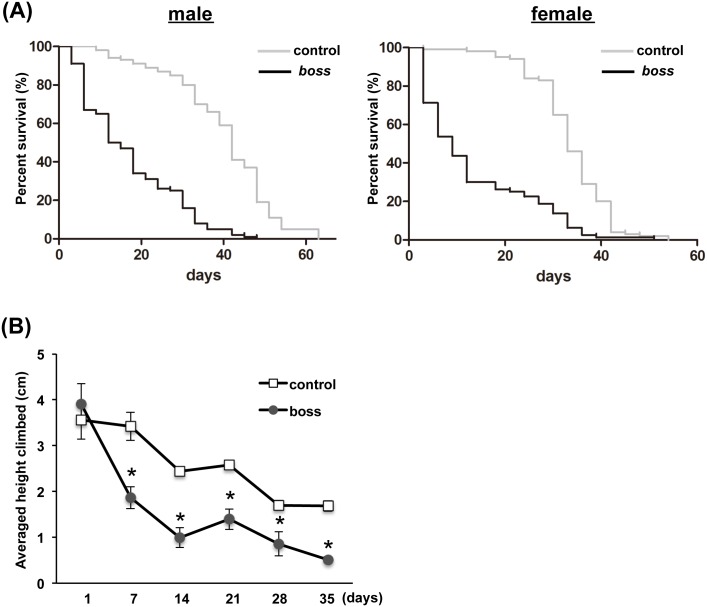
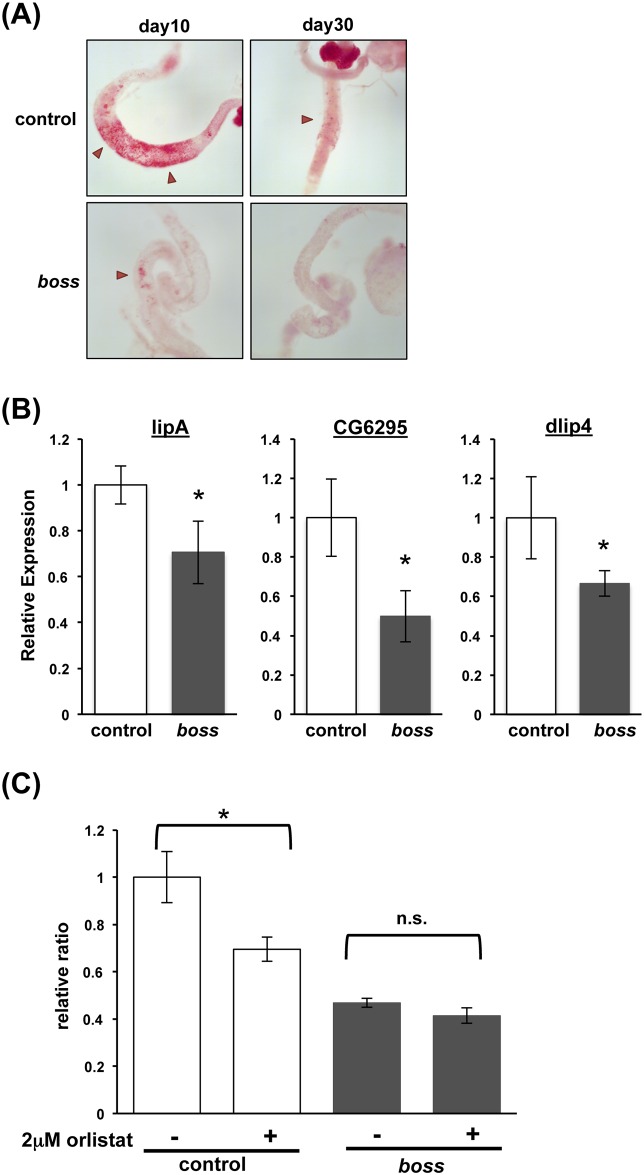
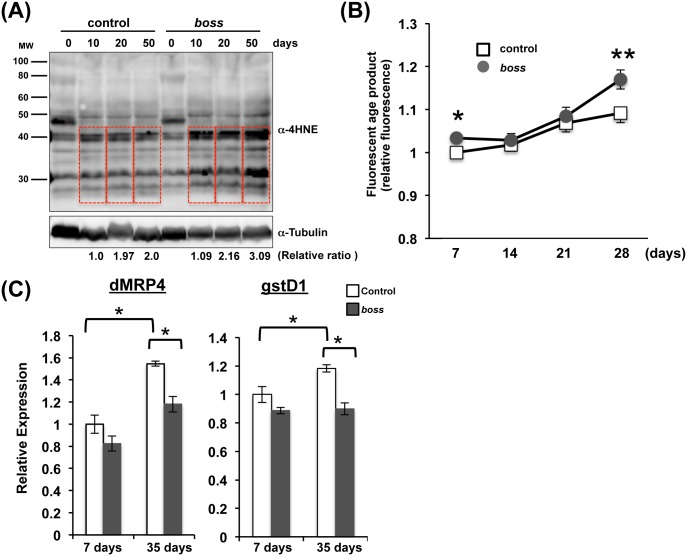
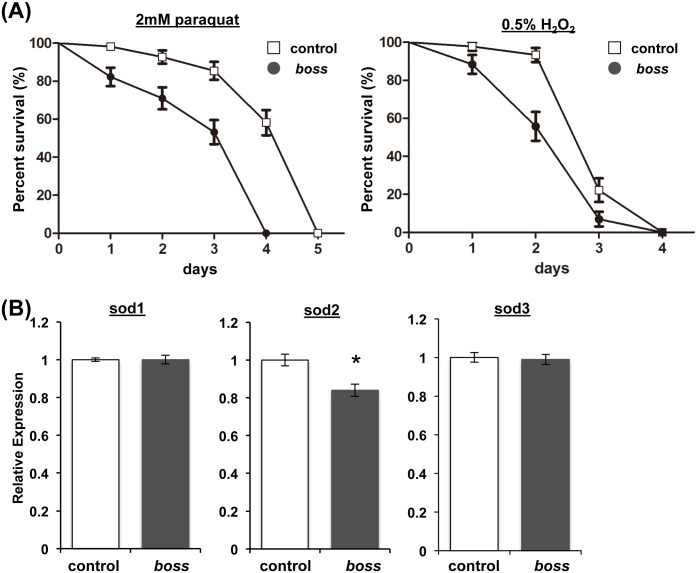
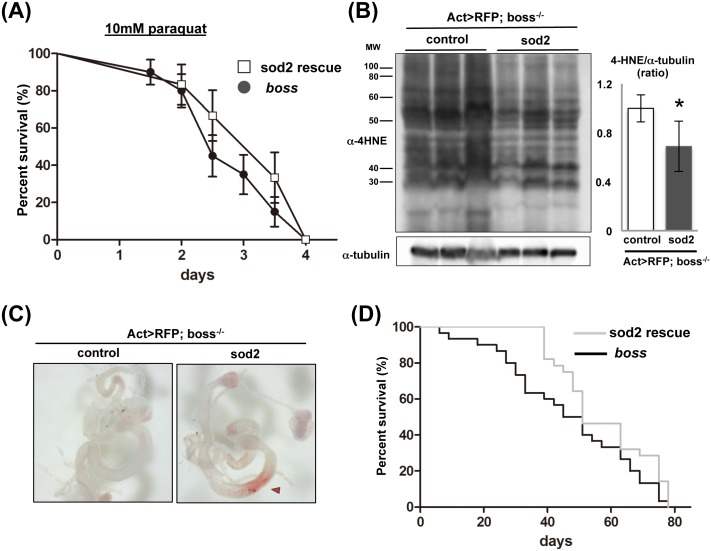
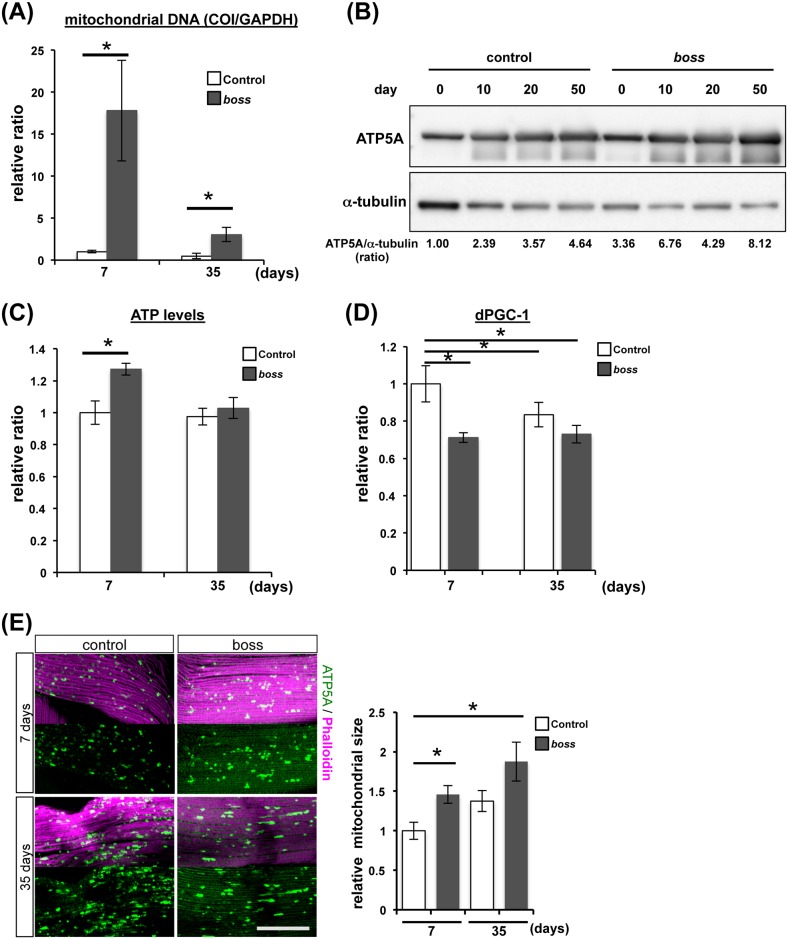
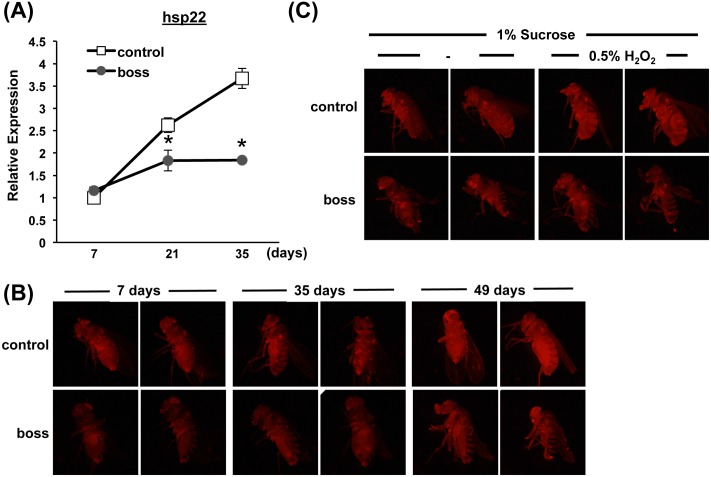
Aging is a universal process that causes deterioration in biological functions of an organism over its lifetime. There are many risk factors that are thought to contribute to aging rate, with disruption of metabolic homeostasis being one of the main factors that accelerates aging. Previously, we identified a new function for the putative G-protein-coupled receptor, Bride of sevenless (BOSS), in energy metabolism. Since maintaining metabolic homeostasis is a critical factor in aging, we investigated whether BOSS plays a role in the aging process. Here, we show that BOSS affects lifespan regulation. boss null mutants exhibit shortened lifespans, and their locomotor performance and gut lipase activity-two age-sensitive markers-are diminished and similar to those of aged control flies. Reactive oxygen species (ROS) production is also elevated in boss null mutants, and their ROS defense system is impaired. The accumulation of protein adducts (advanced lipoxidation end products [ALEs] and advanced glycation end products [AGEs]) caused by oxidative stress are elevated in boss mutant flies. Furthermore, boss mutant flies are sensitive to oxidative stress challenges, leading to shortened lives under oxidative stress conditions. Expression of superoxide dismutase 2 (SOD2), which is located in mitochondria and normally regulates ROS removal, was decreased in boss mutant flies. Systemic overexpression of SOD2 rescued boss mutant phenotypes. Finally, we observed that mitochondrial mass was greater in boss mutant flies. These results suggest that BOSS affects lifespan by modulating the expression of a set of genes related to oxidative stress resistance and mitochondrial homeostasis.


Conflict of interest statement

The authors have declared that no competing interests exist.

Figures

Fig 1
Fig 1. Aging is accelerated in boss mutant flies.
(A) Lifespan for male and female boss mutant flies. boss mutant flies have shorter lifespan than control flies. Survival was presented by Kaplan Meier curves of control and boss mutant flies. n = 100 for each genotypes. Median survival for control male = 40days, boss mutant males = 13.5 days, control female = 33days, boss mutant females = 9days (Log-rank test, p<0.0001). (B) Analysis of vertical distance climbed in the rapid iterative negative geotaxis assay of boss mutant and control (w) male flies (n = 3 groups; each group contains 10 flies per genotype per time point). Data are means ± SEM, and differences are significant by t-test (*P<0.05).
Fig 2
Fig 2. Gut lipase activity declines with aging in boss mutant flies.
(A) Oil-Red-O staining of neutral lipids in the guts of young (10-days) and old (30-days) control and boss mutant female flies. Anterior midgut region stores lipid (arrowhead). (B) Expression of gut lipases (lipA/margo, CG6295, and dlip4) in the intestines of young (day 10) flies, as assessed by qRT-PCR (n = 3, 5 guts per replicate). (C) boss mutant flies are resistant to orlistat treatment. Young adult male boss mutant flies and control flies were fed a diet with or without orlistat (2.0 μM) for 5 days. Afterward TAG levels were determined (n = 5, 10 flies per replicate) and normalized for total protein. Levels are presented as normalized to levels for wild-type flies. Data are mean relative ratios ± SEM, and differences are significant by t-test (*P<0.05).
Fig 3
Fig 3. Oxidative stress is enhanced in boss mutant flies.
(A) ALEs were detected by Western blot and antibodies against 4-hydroxy-2-nonenal (4HNE). Ages (0~50-days old) are shown at the top of the blot. (B) Accumulation of fluorescent AGEs was measured in control and boss mutant flies (n = 3, 20 flies per replicate). Data are mean relative fluorescence ± SEM, and differences are significant by t-test (*P<0.05, **P<0.01). (C) Expression of ROS-inducible genes (dMRP4 and gstD1) in young (7-days) and old (35- days) flies, assessed by qRT-PCR (n = 3, 10 flies per replicate). Data are mean relative expression ± SEM, and differences are significant by t-test (*P<0.05).
Fig 4
Fig 4. boss mutant flies are sensitive to oxidative stress.
(A) Young adult male boss mutant and control flies were fed a diet containing either 2.0 mM paraquat or 0.5% H2O2, and survival rate of the groups was measured (n = 30 flies for each genotypes). Log-rank test, p<0.0001. Error bars represent S.E. (B) Expression of superoxide dismutases (SOD1-3) in young (10-days) flies as measured by qRT-PCR. Data are means ± SEM (t-test, *P<0.05).
Fig 5
Fig 5. SOD2 overexpression rescues aging phenotype of boss mutant flies.
(A) Survival curves of SOD2-overexpressing boss mutant flies (Act-Gal4, UAS-RFP/ UAS-SOD2; boss-/-) and boss mutant flies (Act-Gal4, UAS-RFP/ +; boss-/-) treated with 10 mM paraquat. SOD2 overexpression prolonged the survival of boss mutant flies, shifting the survival curve to the right of the population of SOD2-overexpressing boss mutant flies (n = 30 for each genotypes). Error bars represent S.E. (B) ALEs were detected by Western blot and anti-4HNE antibody. SOD2 overexpression reduced the staining intensity for ALEs (n = 3, 10 flies per replicate). (C) Oil-Red-O staining for neutral lipids in the guts of young (10-days) SOD2-overexpressing control and boss mutant female flies. Anterior midgut region stores lipids (arrowhead). (D) Lifespan for male SOD2-overexpressing boss mutant and boss mutant flies. SOD2 overexpression prolonged the survival of boss mutant flies. Survival was presented by Kaplan Meier curves of SOD2-overexpressing boss mutant and boss mutant flies. n = 50 for each genotypes. Median survival for SOD2-overexpressing boss mutant = 51 days, boss mutant males = 48 days (Log-rank test, p = 0.044).
Fig 6
Fig 6. Mitochondrial mass is increased in boss mutant flies.
(A) Quantification of mitochondrial DNA (mtDNA) in control and boss mutant flies as determined by qPCR (n = 3, 5 flies per replicate). mtDNA of both young (7-days) and old (35-days) boss mutant flies was greater than in control flies. Data are means ± SEM (t-test, *P<0.05). (B) The amount of mitochondria was determined using Western blotting and anti-ATP5A antibody. ATP5 levels were increased in boss mutant flies, suggesting that the total mass of mitochondria increased. Values at bottom of columns are quantitation of ATP5A densitometry analysis (ATP5A/tubulin ratio). (C) ATP production levels were measured in young (7-days) and old (35-days) flies (n = 3, 5 flies per replicate). Data are means ± SEM (t-test, *P<0.05). (D) Expression of pgc1 mRNA was measured in young (7-days) and old (35 days) flies by qRT-PCR (n = 3, 10 flies per replicate). pgc-1 mRNA levels were significantly decreased in young boss mutant flies, indicating indicates mitochondrial biogenesis is reduced. Data are means ± SEM (t-test, *P<0.05). (E) Representative confocal images showing indirect flight muscles stained with phalloidin (magenta) and anti-ATP5 antibody (green). One representative optical section is shown from each phenotype. Scale bar, 50μm. Comparison of the mitochondrial size of both young (7-days) and old (35-days) of control and boss mutant flies are shown to the right. Data are means ± SEM (t-test, *P<0.05).
Fig 7
Fig 7. hsp22 expression is not induced in boss mutant flies.
(A) Expression of hsp22 mRNA was measured in 7-, 21-and 35-days-old control and boss mutant flies by using qRT-PCR (n = 3, 10 flies per replicate). Data are means ± SEM (t-test, *P<0.05). (B) DsRed fluorescence was observed in control and boss mutant flies bearing the Hsp22-DsRed reporter. DsRed fluorescence progressively increased during aging in control but not in boss mutant flies. (C) Flies bearing the Hsp22-DsRed reporter were transferred to a diet containing 0.5% H2O2 for 24 h, and then DsRed fluorescence was observed. Under this oxidative stressful condition, boss mutant flies still failed to exhibit increased hsp22 expression, suggesting dysfunctional mitochondria and oxidative stress dysregulation.

Similar articles

Cited by

References

    1. Clancy DJ, Gems D, Hafen E, Leevers SJ, Partridge L. Dietary restriction in long-lived dwarf flies. Science. 2002;296(5566):319 10.1126/science.1069366 - DOI - PubMed
    1. Tissenbaum HA, Guarente L. Model organisms as a guide to mammalian aging. Dev Cell. 2002;2(1):9–19. - PubMed
    1. Hansen M, Flatt T, Aguilaniu H. Reproduction, fat metabolism, and life span: what is the connection? Cell metabolism. 2013;17(1):10–9. 10.1016/j.cmet.2012.12.003 - DOI - PMC - PubMed
    1. Balaban RS, Nemoto S, Finkel T. Mitochondria, oxidants, and aging. Cell. 2005;120(4):483–95. 10.1016/j.cell.2005.02.001 - DOI - PubMed
    1. Finkel T, Holbrook NJ. Oxidants, oxidative stress and the biology of ageing. Nature. 2000;408(6809):239–47. 10.1038/35041687 - DOI - PubMed

MeSH terms

LinkOut - more resources