. 2017 Jan 3;13(1):e1005304.
doi: 10.1371/journal.pcbi.1005304. eCollection 2017 Jan.

Suboptimal Criterion Learning in Static and Dynamic Environments

Affiliations

Suboptimal Criterion Learning in Static and Dynamic Environments

Elyse H Norton et al. PLoS Comput Biol. .

Abstract

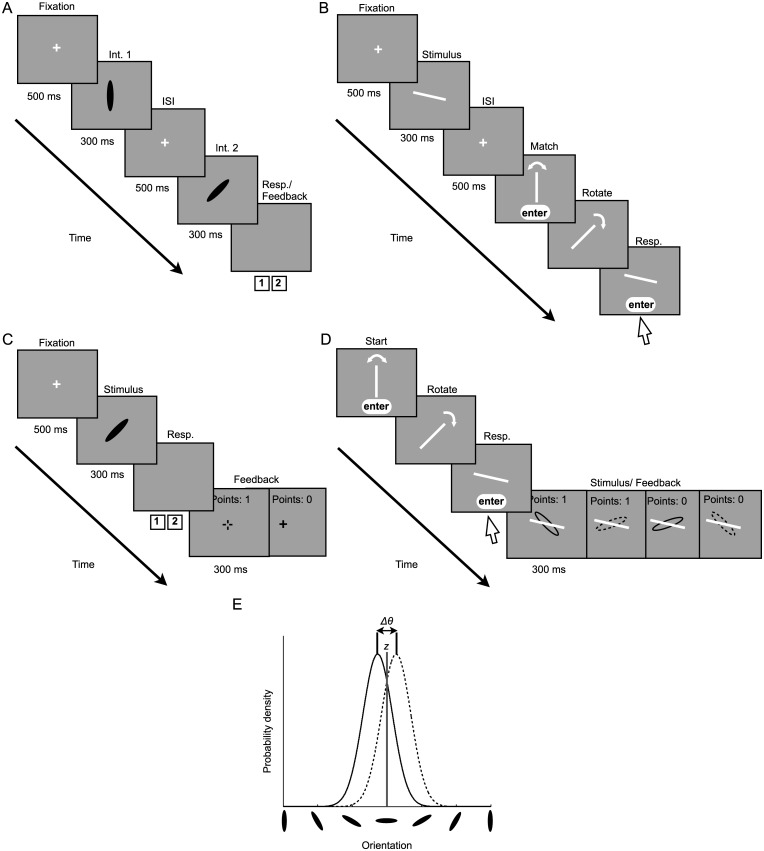
Humans often make decisions based on uncertain sensory information. Signal detection theory (SDT) describes detection and discrimination decisions as a comparison of stimulus "strength" to a fixed decision criterion. However, recent research suggests that current responses depend on the recent history of stimuli and previous responses, suggesting that the decision criterion is updated trial-by-trial. The mechanisms underpinning criterion setting remain unknown. Here, we examine how observers learn to set a decision criterion in an orientation-discrimination task under both static and dynamic conditions. To investigate mechanisms underlying trial-by-trial criterion placement, we introduce a novel task in which participants explicitly set the criterion, and compare it to a more traditional discrimination task, allowing us to model this explicit indication of criterion dynamics. In each task, stimuli were ellipses with principal orientations drawn from two categories: Gaussian distributions with different means and equal variance. In the covert-criterion task, observers categorized a displayed ellipse. In the overt-criterion task, observers adjusted the orientation of a line that served as the discrimination criterion for a subsequently presented ellipse. We compared performance to the ideal Bayesian learner and several suboptimal models that varied in both computational and memory demands. Under static and dynamic conditions, we found that, in both tasks, observers used suboptimal learning rules. In most conditions, a model in which the recent history of past samples determines a belief about category means fit the data best for most observers and on average. Our results reveal dynamic adjustment of discrimination criterion, even after prolonged training, and indicate how decision criteria are updated over time.


Conflict of interest statement

The authors have declared that no competing interests exist.

Figures

Fig 1
Fig 1. Example trial sequences and category distributions.
A) The orientation-discrimination task. The observer’s task was to choose the interval containing the more clockwise ellipse. B) The orientation-matching task. The observer had to best match the orientation of a line that was displayed on the screen. In the experiment, the lines were yellow on a gray background. C) The covert-criterion task. The observers categorized ellipses as belonging to the category A or category B distribution with the 1 and 2 keys, respectively. The subsequent fixation cross indicated the correct category (green for A, displayed here as solid; red for B, displayed as dashed). D) The overt-criterion task. On each trial, observers adjusted the orientation of a yellow line (shown here as white) that served as the discrimination criterion for the subsequently presented ellipse. Feedback ellipses were green and red, here displayed as solid and dashed. In the covert- and overt-criterion tasks, stimuli were ellipses with principal orientations drawn from two categories A and B: Gaussian distributions with different means and equal variance. E) Category distributions. The solid curve represents the distribution underlying stimuli belonging to category A and the dashed curve represents the distribution underlying the stimuli belonging to category B. The distance between the two distributions (Δθ) was set such that difficulty was equated across observers (d′ = 1). The optimal criterion (z) is represented by the solid gray line and falls directly between the two category means. The means of the distributions were chosen randomly at the beginning of each block, remained constant throughout the block in Expt. 1, and were updated on every trial via a random walk in Expt. 2.
Fig 2
Fig 2. Discrimination and matching data.
A) A psychometric function for a representative observer in the orientation-discrimination task. Data points: raw data. Circle area is proportional to the number of trials completed at the corresponding orientation difference (Δθ). A cumulative normal distribution was fit to the data (solid black line). The gray curves represent a 95% confidence interval on the slope parameter. B) One observer’s raw data from the orientation-matching task. The orientation of the matched line is shown as a function of the orientation of the displayed line. The identity line indicates a perfect match.
Fig 3
Fig 3. Overt-criterion data for a representative observer in Expt. 1.
Data points: Criterion placement on each trial. Lines, The mean orientation of the category A and B distributions (solid and dashed, respectively) and the optimal observer’s criterion (solid gray).
Fig 4
Fig 4. Lagged regression for the static condition (Expt. 1).
A) Covert-criterion task: Results of a logistic regression predicting the binary decision of each trial as a combination of the orientations of the current ellipse and the previous nine ellipses in each category. The solid and dashed lines represent the group average beta weights ±SE for the ellipses belonging to category A and category B, respectively. B) Overt-criterion task: Results of a linear regression predicting the criterion placement on each trial as a combination of the orientations of the previous nine ellipses in each category. Again, the solid and dashed lines represent the group average beta weights ±SE for the ellipses belonging to category A and category B, respectively.
Fig 5
Fig 5. Model comparison results for the covert- (dark gray) and overt-criterion (light gray) tasks in Expt. 1.
A) The bar graph depicts the relative DIC scores (i.e., DIC difference between the ideal Bayesian model and the suboptimal models) averaged across observers ±SE. Larger values indicate a better fit. B) To summarize the results from the group level analysis we computed exceedance probabilities for each model in each task. A model’s exceedance probability tells us how much more likely that model is compared to the alternatives, given the group data.
Fig 6
Fig 6. A comparison of the measured noise parameters and model fit parameters in Expt. 1 for the exponentially weighted moving-average model.
A) Each model was fit to the covert-criterion data for each individual and the maximum a posteriori parameter estimate for sensory noise (σv) was determined. Each point represents the sensory noise estimated by the exponentially weighted moving-average model for each individual compared to the individual’s measured sensory noise. Black dashed line: the identity line. B) Adjustment noise (σa) was estimated in the overt-criterion task and compared to the measured adjustment noise. Note: adjustment noise was only measured for 8 out of the 10 observers. Error bars represent a 95% C.I.
Fig 7
Fig 7. Overt-criterion data for two observers in Expt. 2.
A) The mean positions of the category A (solid line) and B (dashed line) across the overt-criterion block. B) Criterion placement data across the block (data points) compared to the omniscient criterion placement (solid gray line). C) Cross-correlation between the omniscient criterion and the observer’s criterion placement. The lag estimate is indicated by the arrow. Estimated lags for all observers ranged from 1 to 4.
Fig 8
Fig 8. Lagged regression for the dynamic condition (Expt. 2).
A) Covert-criterion task: Results of a logistic regression predicting the binary decision of each trial as a combination of the orientations of the current ellipse and the previous nine ellipses in each category. The solid and dashed lines represent the group average beta weights ±SE for the ellipses belonging to category A and category B, respectively. B) Overt-criterion task: Results of a linear regression predicting the criterion placement on each trial as a combination of the orientation of the previous nine ellipses in each category. Again, the solid and dashed lines represent the group average beta weights ±SE for the ellipses belonging to category A and category B, respectively.
Fig 9
Fig 9. Model comparison results for the covert- (dark gray) and overt-criterion (light gray) tasks in Expt. 2.
A) The bar graph depicts the relative DIC scores (i.e., DIC difference between the exponentially weight moving-average model and the alternatives) averaged across observers ±SE. Larger values indicate a better fit. B) To summarize the results from the group level analysis we computed exceedance probabilities for each model in each task. A model’s exceedance probability tells us how much more likely that model is compared to the alternatives, given the group data.
Fig 10
Fig 10. A comparison of the measured noise parameters and model fit parameters in Expt. 2 for the exponentially weighted moving-average model.
A) Each model was fit to the covert-criterion data for each individual and the maximum a posteriori parameter estimate for sensory noise (σv) was determined. Each point represents the sensory noise estimated by the exponentially weighted moving-average model for each individual compared to the individual’s measured sensory noise. Black dashed line: the identity line. B) Adjustment noise (σa) was estimated in the overt-criterion task and compared to the measured adjustment noise. Error bars represent a 95% C.I. Note: adjustment noise was only measured for 3 out of the 10 observers, who completed both Expt. 1 and Expt. 2.

Similar articles

Cited by

References

    1. Green D.M., Swets J.A. (1966). Signal detection theory and psychophysics. New York: Wiley.
    1. Ackermann J.F., Landy M.S. (2015). Suboptimal decision criteria are predictd by subjectively weighted probabilities and rewards. Atten Percept Psychophys 77, 638–658. 10.3758/s13414-014-0779-z - DOI - PMC - PubMed
    1. Healy A.F., Kubovy M. (1981). Probability matching and the formation of conservative decision rules in a numerical analog of signal detection. J Exp Psychol Hum Learn 7, 344–354.
    1. Maddox W.T. (2002). Toward a unified theory of decision criterion learning in perceptual categorization. J Exp Anal Behav 78, 567–595. 10.1901/jeab.2002.78-567 - DOI - PMC - PubMed
    1. Tanner W.P., Swets J.A., Green D.M. (1956). Some general properties of the hearing mechanism. Technical Report 30, Electronic Defense Group: University of Michigan.

Publication types

LinkOut - more resources