. 2017 Jan 3;12(1):e0169338.
doi: 10.1371/journal.pone.0169338. eCollection 2017.

Differential HDAC1 and 2 Recruitment by Members of the MIER Family

Affiliations

Differential HDAC1 and 2 Recruitment by Members of the MIER Family

Roya Derwish et al. PLoS One. .

Abstract

The mier family consists of three related genes encoding ELM2-SANT containing proteins. MIER1 has been well characterized and is known to function in transcriptional repression through its ability to recruit HDAC1 and 2. Little is known about MIER2 or MIER3 function and no study characterizing these two proteins has been published. In this report, we investigate MIER2 and MIER3 localization and function. Confocal analysis revealed that, while MIER2 and MIER3 are mainly nuclear proteins, a substantial proportion (32%) of MIER2 is localized in the cytoplasm. Co-immunoprecipitation experiments demonstrated that the MIER proteins do not dimerize; that MIER2, but not MIER3, can recruit HDACs; and that recruitment is cell line-dependent. MIER2 was associated with HDAC1 and HDAC2 in HEK293 cells, but only with HDAC1 in MCF7 and HeLa cells. Little or no MIER3 co-immunoprecipitated with either HDAC1 or 2 in any of the three cell lines tested. By contrast, HDAC1 and 2 were readily detected in MIER1α complexes in all three cell lines. Histone deacetylase assays confirmed that MIER2, but not MIER3 complexes, have associated deacetylase activity, leading to the conclusion that MIER3 does not function in HDAC recruitment in these cell lines. In contrast to what has been reported for other ELM2-SANT associated HDACs, addition of D-myo-inositol-1,4,5,6-tetrakisphosphate led to only a small increase in MIER1α associated deacetylase activity and no effect on that associated with MIER2. Deletion analysis revealed that HDAC recruitment occurs through the ELM2 domain. Finally, using site-directed mutagenesis, we show that, like MIER1, 228W in the ELM2 domain is a critical residue for HDAC recruitment by MIER2.


Conflict of interest statement

The authors have declared that no competing interests exist.

Figures
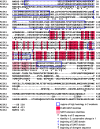
Fig 1
Fig 1. Alignment MIER1α, MIER2 and MIER3 protein sequences.
The MIER1α, MIER2 and MIER3 isoform 1 protein sequences were aligned using MSAProbs [20]; gaps introduced by the alignment program are indicated by dashes and aa numbers are listed on the right. Identities in all 3 proteins are indicated by an ‘*’ and in the ELM2 and SANT domains, are also colored red. The beginning of the ELM2 and the SANT domain are indicated by a blue arrow and blue arrowhead, respectively. Identities in the region of high homology immediately downstream of the SANT domain (SANT extension) are colored pink. Identities in 2 of the 3 proteins are indicated by a ‘+’ sign. Regions of high homology (>70% identity) between 2 of the protein sequences are indicated by a blue outline. The beginning of the highly divergent C-terminal sequence is indicated by a black arrow.
Fig 2
Fig 2. Confocal analysis of MIER2 and MIER3 subcellular localization.
(A-C) MCF7 cells were transfected with a plasmid encoding myc tag alone or myc-tagged -MIER1α, -MIER2 or -MIER3 and localization was analyzed by confocal microscopy using DAPI (panels b, e, h, k) and the 9E10 myc tag antibody (AlexaFluor 488) (panels a, d, g, j, m, n). The merged DAPI and Alexafluor 488 channels are shown in panels c, f, i &l. (A) Illustrative examples of cells showing whole cell localization of the myc-tag (panels a-c), nuclear localization of MIER1α (panels d-f) and MIER3 (panels j-l) and mainly nuclear localization MIER2 (panels g-i). Panels m & n show and enlargement of the cells indicated by arrows in panels g & j; the brightness was increased in these panels to better illustrate the cyotplasmic localization of MIER2 (m), compared to exclusively nuclear localization of MIER3 (n). For all panels, white arrows indicate cells that display whole cell staining, with nuclear staining more intense than cytoplasmic (N>C); white arrowheads indicate cells showing whole cell staining with nuclear staining equal in intensity to cytoplasmic staining (N = C); red arrows with white outlines indicate cells with exclusively nuclear staining. (B) Histogram showing the percentage of cells, ± S.D., displaying each staining pattern: N, exclusively nuclear; N>C, nucleus more intensely stained than cytoplasm; N = C, nucleus and cytoplasm display equal staining intensity. Fields were selected at random and the staining pattern of all expressing cells in the field were scored visually from the compiled z-stacks. Only cells expressing myc-tagged proteins were included in the total counts and used to calculate percentages; 50–80 cells were scored for each construct. (C) Bar graph showing the intracellular distribution of each protein. Fields were selected at random and all cells expressing myc-tagged proteins in the field were analyzed, as described in the Materials and Methods. Pixel values for the nuclear and cytoplasmic compartments were measured in compiled confocal z-stacks using Image J v1.50 g. Plotted is the average value ± S.D. in each compartment, using measurements from 30–40 cells for each construct. (D-E) HEK293 cells were transfected with a plasmid encoding myc-tag alone or myc-tagged -MIER1α, -MIER2 or -MIER3 and localization was analyzed by confocal microscopy, as described for MCF7. (D) Histogram showing the percentage of cells ± S.D. in each of the categories described above. Localization was determined as described above for panel B; 50–80 cells were scored for each construct. (E) Bar graph showing the intracellular distribution of each protein, determined as described above in panel C. Plotted is the average value ± S.D. in each compartment, using measurements from 30–40 cells for each construct. For panels B-E, asterisks indicate values that are significantly different (p<0.05); there was no significant difference between the MIER1α and MIER3 values in any of the panels.
Fig 3
Fig 3. Co-immunoprecipitation analysis of flag-tagged with myc-tagged MIER proteins.
HEK293 cells were transfected with a plasmid encoding myc-tagged MTA1 (lanes 1–2), myc tag alone (lanes 3–5), myc-tagged MIER1α (lanes 6–8), myc-tagged MIER2 (lanes 9–11) or myc-tagged MIER3 (lanes 12–14) along with either flag-tag alone (lane 1), flag-tagged MTA1 (lane 2), flag-tagged MIER1 (lanes 3, 6, 9 & 12), flag-tagged MIER2 (lanes 4, 7, 10 & 13) or flag-tagged MIER3 (lanes 5, 8, 11 & 14). Extracts were either subjected to immunoprecipitation with the 9E10 anti-myc tag antibody or directly loaded onto the gel. The immunoprecipitates (panel a) were analyzed by Western using a flag-tag antibody. The arrows to the right of panel a indicate the positions where flag-tagged -MIER2, -MIER3 and -MIER1α are expected to run (upper to lower arrow, respectively). The blot was stripped and restained with the 9E10 antibody (panel b) to verify the presence of myc-tagged MIER or MTA1 protein in each immunoprecipitate. Expression of the flag-tagged MIER proteins was verified using whole cell lysates from parallel samples and Western analysis with an anti-flag-tag antibody (panel c).
Fig 4
Fig 4. Co-immunoprecipitation of HDAC1 and 2 with MIER proteins.
(A) HEK293 cells were transfected with a plasmid encoding myc tag alone (lane 1) or myc-tagged -MIER1α (lane 2), -MIER2 (lane 3), -MIER3 (lane 4) or -MTA1 (lane 5). Extracts were either loaded directly on the gel (panels e-f) or subjected to immunoprecipitation with the 9E10 anti-myc tag antibody (panels a-d). The immunoprecipitates were analyzed by Western using either anti-HDAC1 (panel a) or anti-HDAC2 (panel b). The blots in panels a & b were stripped and restained using the 9E10 anti-myc tag antibody (panels c-d) to verify levels of MIER protein in each immunoprecipitate. Whole cell extracts were analyzed by Western using anti-HDAC1 (panel e) or anti-HDAC2 (panel f) to verify equivalent HDAC levels in each sample. This experiment was performed 4 times. (B) Quantitation of the HDAC and MIER band intensity in the HEK293 immunoprecipitates was performed by densitometry using Image J 1.50g, as described in the Materials and Methods. Plotted is the average HDAC:MIER ratio ± S.D. for the 4 experiments from (A) and 3 experiments from Fig 5A (minus IP4 values only). (C) HEK293 cells were transfected with a plasmid encoding myc-tagged -isoform 1 (lane 1) or -isoform 3 (lane 2) of MIER3. The experiment was performed twice and Western analysis was completed as in (A). Note that a longer exposure than in (A) is shown here, in order to enhance visualization of the MIER3 associated HDAC bands. (D) MCF7 cells were transfected with a plasmid encoding myc-tag alone (lane 1) or myc-tagged -MIER1α (lane 2), -MIER2 (lane 3) or -MIER3 (lane 4). Western analysis was performed as in (A). (E) Quantitation of the HDAC and MIER band intensities in the MCF7 immunoprecipitates was performed as described in (B). Plotted is the average HDAC:MIER ratio ± S.D. for 4 experiments. (F) HEK293 cells were transfected with a plasmid encoding myc-tag alone or myc-tagged -MIER1α, -MIER2 or -MIER3. Extracts were subjected to immunoprecipitation with the 9E10 anti-myc tag antibody. Immunoprecipitates were assayed for histone deacetylase activity using [3H]-labeled histones as described in the Methods and Materials. HDAC assays, with or without TSA, were performed on duplicate samples and plotted is the average of three experiments ± S.D. Statistical analysis, using one-way ANOVA with post-hoc Tukey HSD, revealed all -TSA values were significantly different each other (p<<0.05), except for MIER3 when compared to Con; # indicates values that are not significantly different (p>0.05).
Fig 5
Fig 5. HDAC activity in the presence of Ins(1,4,5,6)P4.
HEK293 cells were transfected with a plasmid encoding myc tag alone or myc-tagged -MIER1α, -MIER2 or -MIER3. Extracts were subjected to immunoprecipitation with the 9E10 anti-myc tag antibody, either in the absence (A, panels a-c, lanes 1,3,5,7; B) or presence (A, panels a-c, lanes 2,4,6,8; B) of Ins(1,4,5,6)P4. Immunoprecipitates were either analyzed by Western for associated HDAC1 and 2 (A) or assayed for histone deacetylase activity using [3H]-labeled histones (B). (A) Western blot analysis of immunoprecipitates using anti-HDAC1 (panels a); the blot in panel a was stripped and restained using anti-HDAC2 (panel b) and finally using the 9E10 anti-myc tag antibody (panel c). Whole cell extracts were analyzed by Western, using anti-HDAC1 (panel e) or anti-HDAC2 (panel f) to verify equivalent HDAC levels in each sample. (B) Immunoprecipitates, incubated with or without Ins(1,4,5,6)P4, were assayed for histone deacetylase activity, as described in the Methods and Materials. Assays were performed on duplicate samples and plotted is the average of three experiments ± S.D. Statistical analysis of the effect of Ins(1,4,5,6)P4 was performed using a standard t-test; asterisks indicate values that are significantly different when Ins(1,4,5,6)P4 is added (p< 0.05).
Fig 6
Fig 6. Interaction of HDAC1 and 2 with MIER2 deletion constructs.
(A) Schematic showing a scaled representation of the MIER2 protein sequence, indicating the location of the ELM2 (dark pink) and SANT (dark blue) domains; the remaining sequence is colored light blue. The amino acid numbers for the beginning and end of the protein as well as beginning and end of ELM2 & SANT domains are indicated above the schematic. (B) HEK293 cells were transfected with a plasmid encoding myc tag alone (lane 1), myc-tagged full-length MIER2 (lane 2) or one of the following myc-tagged deletion constructs: Δ1 (aa1-301; lane 3), Δ2 (aa302-545; lane 4), Δ3 (aa194-346; lane 5), Δ4 (aa194-301; lane 6). Extracts were either loaded directly on the gel (panels d-e) or subjected to immunoprecipitation with the 9E10 anti-myc tag antibody. The immunoprecipitates were analyzed by Western, using either anti-HDAC1 (panel a) or anti-HDAC2 (panel b). The blots in panels a & b were stripped and restained using the 9E10 anti-myc tag antibody to verify the presence of the relevant MIER2 deletion construct in the immunoprecipitates; the restained blot from panel a is shown in panel c. The blots in panels d & e were stained with anti-HDAC1 or anti-HDAC2, respectively, to verify equivalent HDAC levels in the cell extracts. A schematic illustrating the MIER2 sequence included in the deletion construct used is shown above each lane. (C) HEK293 cells were transfected with a plasmid encoding myc tag alone (lane 1) or myc-tagged -wild-type MIER2 (lane 2) or -MIER2 containing a point mutation, 228W→A, in the ELM2 domain. Analysis was performed as in (B).

References

    1. Paterno GD, Li Y, Luchman HA, Ryan PJ, Gillespie LL. cDNA cloning of a novel, developmentally regulated immediate early gene activated by fibroblast growth factor and encoding a nuclear protein. J Biol Chem. 1997;272(41):25591–5. - PubMed
    1. Paterno GD, Ding Z, Lew YY, Nash GW, Mercer FC, Gillespie LL. Genomic organization of the human mi-er1 gene and characterization of alternatively spliced isoforms: regulated use of a facultative intron determines subcellular localization. Gene. 2002;295(1):79–88. - PubMed
    1. Clements JA, Mercer FC, Paterno GD, Gillespie LL. Differential splicing alters subcellular localization of the alpha but not beta isoform of the MIER1 transcriptional regulator in breast cancer cells. PLoS One. 2012;7(2):e32499 Epub 2012/03/03. PubMed Central PMCID: PMC3286477. 10.1371/journal.pone.0032499 - DOI - PMC - PubMed
    1. Ding Z, Gillespie LL, Paterno GD. Human MI-ER1 alpha and beta function as transcriptional repressors by recruitment of histone deacetylase 1 to their conserved ELM2 domain. Mol Cell Biol. 2003;23(1):250–8. 10.1128/MCB.23.1.250-258.2003 - DOI - PMC - PubMed
    1. Ding Z, Gillespie LL, Mercer FC, Paterno GD. The SANT domain of human MI-ER1 interacts with Sp1 to interfere with GC box recognition and repress transcription from its own promoter. J Biol Chem. 2004;279(27):28009–16. 10.1074/jbc.M403793200 - DOI - PubMed

MeSH terms