. 2017 Jan 3;13(1):e1006143.
doi: 10.1371/journal.ppat.1006143. eCollection 2017 Jan.

RNA Sequencing Reveals that Kaposi Sarcoma-Associated Herpesvirus Infection Mimics Hypoxia Gene Expression Signature

Affiliations

RNA Sequencing Reveals that Kaposi Sarcoma-Associated Herpesvirus Infection Mimics Hypoxia Gene Expression Signature

Coralie Viollet et al. PLoS Pathog. .

Abstract

Kaposi sarcoma-associated herpesvirus (KSHV) causes several tumors and hyperproliferative disorders. Hypoxia and hypoxia-inducible factors (HIFs) activate latent and lytic KSHV genes, and several KSHV proteins increase the cellular levels of HIF. Here, we used RNA sequencing, qRT-PCR, Taqman assays, and pathway analysis to explore the miRNA and mRNA response of uninfected and KSHV-infected cells to hypoxia, to compare this with the genetic changes seen in chronic latent KSHV infection, and to explore the degree to which hypoxia and KSHV infection interact in modulating mRNA and miRNA expression. We found that the gene expression signatures for KSHV infection and hypoxia have a 34% overlap. Moreover, there were considerable similarities between the genes up-regulated by hypoxia in uninfected (SLK) and in KSHV-infected (SLKK) cells. hsa-miR-210, a HIF-target known to have pro-angiogenic and anti-apoptotic properties, was significantly up-regulated by both KSHV infection and hypoxia using Taqman assays. Interestingly, expression of KSHV-encoded miRNAs was not affected by hypoxia. These results demonstrate that KSHV harnesses a part of the hypoxic cellular response and that a substantial portion of hypoxia-induced changes in cellular gene expression are induced by KSHV infection. Therefore, targeting hypoxic pathways may be a useful way to develop therapeutic strategies for KSHV-related diseases.


Conflict of interest statement

The authors have declared that no competing interests exist.

Figures

Fig 1
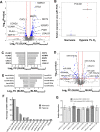
Fig 1. Differential expression of mRNAs and miRNAs in hypoxic vs. normoxic uninfected SLK cells.
Uninfected SLK cells were incubated under standard (normoxic, 21% O2) conditions or in hypoxia (1% O2) (n = 3). After 24hrs, total RNA was extracted. cDNA libraries for small RNA and mRNA were prepared and sequenced on the Illumina HiSeq platform (Material and Methods). (A) Volcano plot of mRNA differential expression in hypoxic vs. normoxic uninfected SLK cells. Vertical lines indicate the threshold for a relative expression fold change (FC) of 2 or -2 compared to normoxic controls. The horizontal red line represents the threshold of a 0.05 P-value. The blue dots lying in the top right and top left sectors represent significantly up-and down-regulated mRNAs, respectively, in hypoxic vs. normoxic SLK cells (P ≤0.05, linear FC ≤-2 or ≥2). Only annotated genes are shown in this volcano plot. (B) Top 5 most abundant mRNAs up-regulated and down-regulated in hypoxic vs. normoxic uninfected SLK cells. Bars left and right of the y-axis show the 5 most abundant mRNAs that are repressed and induced, respectively, in hypoxia compared to normoxia in SLK cells. The mRNAs were ordered by fold change. In this graph, the P-value threshold was set at ≤0.01 to limit the analysis to genes whose modulation by hypoxia was highly significant. (C) VEGF differential expression in hypoxic vs. normoxic SLK cells. This plot represents the fold difference in VEGF expression between hypoxia and normoxia in SLK cells, measured by qRT-PCR assays (n = 6). Ribosomal gene 18S was used for internal normalisation. Hypoxic samples were normalised to normoxic samples (n = 6). (D) Volcano plot of miRNA differential expression in hypoxic and normoxic uninfected SLK cells. The plot is depicted as in Fig 1A, with vertical and horizontal lines indicating the threshold for a relative expression fold change of 2 or -2 compared to normoxic controls, and the threshold of a 0.05 P-value, respectively. (E) Top 5 most abundant miRNAs up-regulated and down-regulated in hypoxic vs. normoxic uninfected SLK cells. Bars left and right of the y-axis show the 5 most abundant miRNAs that are repressed and induced, respectively, in hypoxia compared to normoxia in SLK cells (P≤0.05).
Fig 2
Fig 2. RNA-Seq analysis reveals that the cellular responses to hypoxia and KSHV infection overlap substantially at the mRNA but not at the miRNA level.
mRNA and miRNA differential expression in hypoxic vs. normoxic SLK cells was compared with publicly available data from KSHV-infected SLKK vs. uninfected SLK cells [25]. (A) Genes that are up-regulated or down-regulated by hypoxia (P≤0.05, FC ≤-2 and ≥2) are similarly regulated (P≤0.05, FC ≤-2 and ≥2) due to KSHV infection. Out of 210 hypoxia-induced genes, ~23% (49) were also up-regulated by KSHV infection (see S1 Table for details). Out of 309 hypoxia-repressed genes, ~41% (128) were also down-regulated by KSHV infection [25]. (B) Scatter plot showing genes up-regulated by hypoxia and their respective regulation by KSHV infection. This illustrates to what extent the 210 genes that were up-regulated by hypoxia were also changing due to KSHV infection [25]. The x-axis represents the log2 fold change (SLKK vs. SLK cells). The y-axis represents the log2 fold change (hypoxia vs. normoxia in SLK cells). Red dots depict genes up-regulated by KSHV infection, black dots depict genes that are down-regulated by KSHV infection, and grey dots are those that do not meet criteria for up- or down-regulation. (C) miRNAs that are up-regulated or down-regulated by hypoxia (P≤0.05, FC ≤-2 and ≥2) show little overlap with the KSHV infection response. This illustrates to what extent miRNAs that were regulated by hypoxia (P≤0.05, FC ≤-2 and ≥2) were also changing with similar cut-off values due to KSHV infection [25]. Out of 14 hypoxia-induced miRNAs, two were also up-regulated by KSHV infection (miR-210 and miR-4671-3p). Out of 98 hypoxia-repressed miRNAs, eight were also down-regulated by KSHV infection (miR-548b-3p, miR-551-3p, miR-579, miR-1270, miR-3136-5p, miR-3180-5p, miR-4793-3p, and miR-5695).
Fig 3
Fig 3. Differential expression of mRNAs and miRNAs in hypoxic vs. normoxic infected SLKK cells.
Infected SLKK cells were incubated under standard (normoxic, 21% O2) conditions or in hypoxia (1% O2) (n = 3). After 24hrs, total RNA was extracted. cDNA libraries for small RNA and mRNA were prepared and sequenced on the Illumina HiSeq platform (Material and Methods). (A) Volcano plot of mRNA differential expression in hypoxic vs. normoxic infected SLKK cells. The plot is depicted as in Fig 1A, with vertical and horizontal red lines similarly representing the thresholds of a fold change of 2 or -2, and of a P-value of 0.05, respectively. Only annotated genes are showed in this volcano plot. Dots in blue depict mRNAs that meet the cut-off values for up-regulation or down-regulation. (B) VEGF differential expression in hypoxic vs. normoxic SLKK cells. This plot represents the fold difference in VEGF expression between hypoxia and normoxia in SLKK cells, measured by qRT-PCR assays (n = 6). The plot is depicted as in Fig 1C. (C) Top 5 most abundant mRNAs up-regulated and down-regulated in hypoxic vs. normoxic infected SLKK cells. Bars left and right of the y-axis show the 5 most abundant mRNAs that are repressed and induced, respectively, in hypoxia compared to normoxia in SLKK cells with P-value of ≤0.01 to focus on those with substantial significance. The mRNAs were then ordered by fold change. (D) Volcano plot of human miRNA differential expression in hypoxic vs. normoxic infected SLKK cells. The plot is depicted as in Fig 1A, with vertical and horizontal red lines similarly representing the thresholds of a fold change of 2 or -2, and of a P-value of 0.05, respectively. (E) Top 5 most abundant miRNAs up-regulated and down-regulated in hypoxic vs. normoxic infected SLKK cells. Bars left and right of the y-axis show the 5 most abundant miRNAs that are repressed and induced, respectively, in hypoxia compared to normoxia in SLKK cells (P≤0.05). The miRNAs were ordered by fold change. (F) The expression levels of individual KSHV miRNAs in SLKK cells are shown as the percentage of the total viral miRNA expression. Data are the average of sequenced SLKK samples from three independent experiments. For a detailed breakdown, see S5 Table. (G) Taqman assays showing relative expression of KSHV miRNAs in hypoxic vs. normoxic SLKK cells. Bars show the relative expression of individual KSHV miRNA in hypoxic SLKK cells as compared to normoxic SLKK cells. The dashed line corresponds to the expression of the normoxic levels. No significant change was observed. Experiments were performed in biological triplicates.
Fig 4
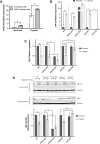
Fig 4. KSHV infection and hypoxia induce miR-210 independently and additively, while miR-210 modulates its target expression, ISCU, in KSHV-infected cells.
(A) Data represent miR-210 relative expression in normoxic and hypoxic SLKK and SLK cells. Values are normalized to the average of normoxic SLK controls set to one. Taqman assays demonstrate that hypoxic conditions (1% O2 for 24hrs) up-regulate miR-210 in both KSHV-infected and uninfected cells (P ≤0.01, Student’s t-test). Additionally, Taqman assays show that KSHV infection alone up-regulates miR-210, in both normoxia and hypoxia (*P ≤0.05, Student’s t-test). (B) Analysis of miR-210 expression in normoxic and hypoxic SLKK cells transfected with miR-210 mimics, anti-miR-210 inhibitors or controls using Taqman assays. Bars depict the relative expression of miR-210 compared to normoxic NT controls. NT: No Transfection. (C) qRT-PCR analysis of ISCU transcript in normoxic and hypoxic SLKK cells transfected with miR-210 mimics, anti-miR-210 inhibitors or controls. Values normalized as in (B). NT: No Transfection. (D) Quantitative immunoblotting analysis in normoxic and hypoxic SLKK cells transfected with miR-210 mimics, anti-miR-210 inhibitors or controls. (A), (B), (C), and (D) depict the mean ± sem of three independent experiments. *, **, and *** indicate P ≤0.05, P ≤0.01, and P ≤0.001, respectively.
Fig 5
Fig 5. RNA-seq analysis shows the overlap between hypoxia-regulated mRNAs and miRNAs in SLK vs. SLKK cells.
Differentially expressed mRNAs and miRNAs in hypoxic vs. normoxic SLK cells were compared to those in hypoxic vs. normoxic SLKK cells. (A) This plot illustrates the extent to which genes that were significantly deregulated by hypoxia in SLK cells (P≤0.05, FC ≤-2 and ≥2) were also deregulated by hypoxia in SLKK cells. Out of 210 hypoxia-induced genes in SLK cells, ~24% (51) were also up-regulated in SLKK cells. Out of 309 hypoxia-repressed genes in SLK cells, ~5% (14) were also down-regulated in SLKK cells; and one mRNA, PTGES, was repressed by hypoxia in SLK cells and induced in SLKK cells. (B) This scatterplot illustrates the extent to which the 210 genes that were up-regulated by hypoxia in SLK cells were also changed by hypoxia in SLKK cells. The x-axis represents the log2 fold change of SLKKHypoxia vs. SLKKNormoxia cells. The y-axis represents the log2 fold change of SLKHypoxia vs. SLKNormoxia cells. Genes discussed in this manuscript were labelled onto the graph. (C) HypoxamiRs in SLK and SLKK cells. The graph illustrates how miRNAs significantly deregulated by hypoxia in SLK cells (P≤0.05, FC ≤-2 and ≥2) were changing due to hypoxia in SLKK cells. Out of 14 hypoxia-induced miRNAs in SLK cells, 2 were also up-regulated in SLKK cells (miR-210 and miR-3074-3p). Out of 98 hypoxia-repressed miRNAs in SLK cells, 10 were also down-regulated in SLKK cells; and three miRNAs (miR-135b-3p, miR-33a-3p, miR-4645-3p) were repressed by hypoxia in SLK cells and induced in SLKK cells. See (D) for a detailed breakdown. (D) This table details the gene expression of miRNAs responding similarly to hypoxia in infected and uninfected cells. miRNA names in bold indicate novel hypoxamiRs. FPKM: fragments per kilobase million. N vs. H: Normoxia versus Hypoxia. Log-transformed fold changes were calculated adding 0.01 to both normoxic and hypoxia FPKM values, in order to correct for nil denominators.
Fig 6
Fig 6. Integration of mRNA-Seq and miRNA-Seq data using Ingenuity Pathway Analysis.
(A) Workflow of integrated miRNA-mRNA association analysis using IPA. This experimental workflow shows the various filters used to associate miRNA-Seq and mRNA-Seq data from hypoxic and normoxic SLKK cells. Numbers are presented as Total differentially expressed miRNAs or mRNAs (Up-regulated in green/Down-regulated in red). (B) Ingenuity analysis predicts inversely correlated miRNA-mRNA target pairs in hypoxic vs. normoxic infected SLKK cells. Using lists of differentially expressed miRNAs and mRNAs as input for the Ingenuity Pathway Analysis (IPA), it was found that 32 differentially expressed miRNAs target 67 mRNAs (high confidence and experimentally observed results). Only mRNAs and miRNAs with opposite differential expression are shown in this table. Columns identify the miRNA name, its log-transformed expression fold change between hypoxic and normoxic SLKK cells, the number of identified targets, and the five most differentially expressed targets.

Similar articles

Cited by

References

    1. Cesarman E, Moore PS, Rao PH, Inghirami G, Knowles DM, Chang Y. In vitro establishment and characterization of two acquired immunodeficiency syndrome-related lymphoma cell lines (BC-1 and BC-2) containing Kaposi’s sarcoma-associated herpesvirus-like (KSHV) DNA sequences. Blood. American Society of Hematology; 1995;86: 2708–14. - PubMed
    1. Cesarman E, Chang Y, Moore PS, Said JW, Knowles DM. Kaposi’s sarcoma-associated herpesvirus-like DNA sequences in AIDS-related body-cavity-based lymphomas. N Engl J Med. 1995;332: 1186–91. 10.1056/NEJM199505043321802 - DOI - PubMed
    1. Soulier J, Grollet L, Oksenhendler E, Cacoub P, Cazals-Hatem D, Babinet P, et al. Kaposi’s sarcoma-associated herpesvirus-like DNA sequences in multicentric Castleman’s disease. Blood. American Society of Hematology; 1995;86: 1276–80. - PubMed
    1. Chang Y, Cesarman E, Pessin MS, Lee F, Culpepper J, Knowles DM, et al. Identification of herpesvirus-like DNA sequences in AIDS-associated Kaposi’s sarcoma. Science (80-). 1994;266: 1865–1869. - PubMed
    1. Ye F, Lei X, Gao S-J. Mechanisms of Kaposi’s Sarcoma-Associated Herpesvirus Latency and Reactivation. Adv Virol. 2011;2011. - PMC - PubMed

Publication types