. 2017 Mar 1:378:37-52.
doi: 10.1016/j.tox.2016.12.007. Epub 2016 Dec 31.

Perfluoroalkyl acids-induced liver steatosis: Effects on genes controlling lipid homeostasis

Affiliations

Perfluoroalkyl acids-induced liver steatosis: Effects on genes controlling lipid homeostasis

Kaberi P Das et al. Toxicology. .

Abstract

Persistent presence of perfluoroalkyl acids (PFAAs) in the environment is due to their extensive use in industrial and consumer products, and their slow decay. Biochemical tests in rodent demonstrated that these chemicals are potent modifiers of lipid metabolism and cause hepatocellular steatosis. However, the molecular mechanism of PFAAs interference with lipid metabolism remains to be elucidated. Currently, two major hypotheses are that PFAAs interfere with mitochondrial beta-oxidation of fatty acids and/or they affect the transcriptional activity of peroxisome proliferator-activated receptor α (PPARα) in liver. To determine the ability of structurally-diverse PFAAs to cause steatosis, as well as to understand the underlying molecular mechanisms, wild-type (WT) and PPARα-null mice were treated with perfluorooctanoic acid (PFOA), perfluorononanoic acid (PFNA), or perfluorohexane sulfonate (PFHxS), by oral gavage for 7days, and their effects were compared to that of PPARα agonist WY-14643 (WY), which does not cause steatosis. Increases in liver weight and cell size, and decreases in DNA content per mg of liver, were observed for all compounds in WT mice, and were also seen in PPARα-null mice for PFOA, PFNA, and PFHxS, but not for WY. In Oil Red O stained sections, WT liver showed increased lipid accumulation in all treatment groups, whereas in PPARα-null livers, accumulation was observed after PFNA and PFHxS treatment, adding to the burden of steatosis observed in control (untreated) PPARα-null mice. Liver triglyceride (TG) levels were elevated in WT mice by all PFAAs and in PPARα-null mice only by PFNA. In vitro β-oxidation of palmitoyl carnitine by isolated rat liver mitochondria was not inhibited by any of the 7 PFAAs tested. Likewise, neither PFOA nor PFOS inhibited palmitate oxidation by HepG2/C3A human liver cell cultures. Microarray analysis of livers from PFAAs-treated mice indicated that the PFAAs induce the expression of the lipid catabolism genes, as well as those involved in fatty acid and triglyceride synthesis, in WT mice and, to a lesser extent, in PPARα-null mice. These results indicate that most of the PFAAs increase liver TG load and promote steatosis in mice We hypothesize that PFAAs increase steatosis because the balance of fatty acid accumulation/synthesis and oxidation is disrupted to favor accumulation.

Keywords: Perfluorohexane sulfonate; Perfluorononanoic acid; Perfluorooctane sulfonate; Perfluorooctanoic acid; Steatosis; Triglycerides.


Figures

Fig. 1
Fig. 1
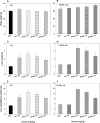
Effect of PFOA, PFNA, and PFHxS on body weight and liver weight. A and B. Body weights. C and D. Absolute liver weights. E and F. Liver to body weights ratio. One-way ANOVA with Dunnett’s multiple comparison test was used to determine significance for each treatment relative to control. Data are mean ± SE, where n = 4, * represents p <0.0001.
Fig. 2
Fig. 2
Determination of cell size and DNA content after exposure. A and B. Analysis of cell area. The data were analyzed with 2-way ANOVA and Bonferroni post test to determine strain and treatment effects and interactions, and also one-way ANOVA and Dunnett’s multiple comparison test to evaluate treatment effects within the strain. C and D. Analysis of DNA content in μg DNA per mg of liver. One-way ANOVA with Dunnett’s multiple comparison test was used to determine significance for each treatment relative to control. Data are mean ± SE, where n = 4, ** represents p < 0.01 and *** represents p < 0.001.
Fig. 3
Fig. 3
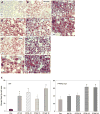
Lipid accumulation in the livers of control and treated mice. A–J. Six μM thick frozen sections from each liver were prepared, thaw mounted onto glass slides, stained with Oil Red O and two regions of each section were photographed. Representative images for each treatment (all dosed at 10mg/kg) and strain are shown. K. Quantitation of lipid accumulation from the images. The data were analyzed with 2-way ANOVA and Bonferroni post test to determine strain and treatment effects and interactions, and also one-way ANOVA and Dunnett’s multiple comparison test to evaluate treatment effects within the strain. Data are mean ± SE, where n = 4, * represents p < 0.05 and ** represents p <0.01. Significant comparison control vs treated within same strain.
Fig. 4
Fig. 4
Alterations of triglyceride levels in the livers of treated mice. One-way ANOVA with Dunnett’s multiple comparison test was used to determine significance for each treatment relative to control. Data are mean ± SE, where n = 4, * represents p <0.05, ** represents p <0.01 and *** represents p <0.001.
Fig. 5
Fig. 5
The effect of representative perfluorooctane compounds on respiration of isolated rat liver mitochondria oxidizing palmitoylcarnitine. For medium composition and additions see Methods. Mitochondrial protein content was 1 mg/ml. Numbers near the curves indicate the rate of respiration, nmol O2 × min−1 × mg−1 protein. Each curve from left to right are a, b, c, and d as indicated under results section. Abbreviations: Mito, mitochondria; PC, palmitoylcarnitine; DNP, 2,4-dinitrophenol; C-228, a mix of surfactants as a positive control; Glu, glutamate + malate; Suc, succinate + rotenone; FOSA; N-EtFOSA. For explanations, see the text.
Fig. 6
Fig. 6
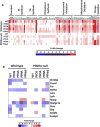
Coordinated changes in the expression of lipid synthesis and catabolism genes in treated mice. A. Changes in the expression of the genes in the different functional categories came from microarray experiments that were analyzed using the NextBio Affymetrix array analysis pipeline as described in the Methods. Microarray comparisons came from experiments in wild-type and PPARα male mice that were closely matched with the experiments described in the present study: WYat 0.1% in the diet for 5days (from GSE8295); PFOS at 10mg/kg/day for 7 days (from GSE22871); PFOA at 3mg/kg/day for 7 days (from GSE9786); PFNA at 3 mg/kg/day for 7 days (from GSE55756); PFHxS at 10 mg/kg/dayfor 7 days (fromGSE55756). The microarray analysis shows that although the typical gene targets of PPARα were increased (peroxisomal, mitochondrial and omega fatty acid oxidation), there were also parallel increases in the expression of fatty acid transport and synthesis genes, as well as triglyceride synthesis genes. B. Alterations in the expression of key transcription factors that regulate lipid metabolism. Expression values were derived from the microarray experiments described in A.
Fig. 7
Fig. 7
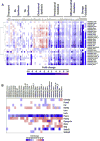
Effects of Pparα inactivation on lipid synthesis and catabolism genes. A. Biosets derived from comparisons between PPARα-null and wild-type mice were examined for expression of the genes in the indicated functional categories. Many of the biosets were derived from mice in which both strains were treated with the indicated compound at the indicated dose (in mg/kg/day) or synthetic triglyceride, as indicated in the name of the bioset. Biosets were clustered by one-dimensional clustering. B. Expression of the Ppara and Pparg genes in the PPARα-null and wild-type comparisons described in A.

Similar articles

Cited by

References

    1. Al-Eryani L, Wahlang B, Falkner KC, Guardiola JJ, Clair HB, Prough RA, Cave M. Identification of environmental chemicals associated with the development of toxicant-associated fatty liver disease in rodents. Toxicol Pathol. 2015;43:482–497. - PMC - PubMed
    1. Anderson SP, Dunn C, Laughter A, Yoon L, Swanson C, Stulnig TM, Steffensen KR, Chandraratna RA, Gustafsson JA, Corton JC. Overlapping transcriptional programs regulated by the nuclear receptors peroxisome proliferator-activated receptor alpha, retinoid X receptor, and liver X receptor in mouse liver. Mol Pharmacol. 2004;66:1440–1452. - PubMed
    1. Angrish M, Kaiser J, McQueen C, Chorley B. Tipping the balance: hepatotoxicity and the 4 apical key events of hepatic steatosis. Toxicol Sci. 2016;150:261–268. - PubMed
    1. Begriche K, Massart J, Robin MA, Bonnet F, Fromently B. Mitochondrial adaptations and dysfunctions in nonalcoholic fatty liver disease. Hepatology. 2013;58:1497–150. - PubMed
    1. Berthiaume J, Wallace KB. Perfluorooctanoate, perflourooctanesulfonate, and N-ethyl perfluorooctanesulfonamido ethanol; peroxisome proliferation and mitochondrial biogenesis. Toxicol Lett. 2002;129:23–32. - PubMed

Publication types

MeSH terms