

Influence of exposure differences on city-to-city heterogeneity in PM2.5-mortality associations in US cities
- PMID: 28049482
- PMCID: PMC5209854
- DOI: 10.1186/s12940-016-0208-y
Influence of exposure differences on city-to-city heterogeneity in PM2.5-mortality associations in US cities
Abstract
Background: Multi-city population-based epidemiological studies have observed heterogeneity between city-specific fine particulate matter (PM2.5)-mortality effect estimates. These studies typically use ambient monitoring data as a surrogate for exposure leading to potential exposure misclassification. The level of exposure misclassification can differ by city affecting the observed health effect estimate.
Methods: The objective of this analysis is to evaluate whether previously developed residential infiltration-based city clusters can explain city-to-city heterogeneity in PM2.5 mortality risk estimates. In a prior paper 94 cities were clustered based on residential infiltration factors (e.g. home age/size, prevalence of air conditioning (AC)), resulting in 5 clusters. For this analysis, the association between PM2.5 and all-cause mortality was first determined in 77 cities across the United States for 2001-2005. Next, a second stage analysis was conducted evaluating the influence of cluster assignment on heterogeneity in the risk estimates.
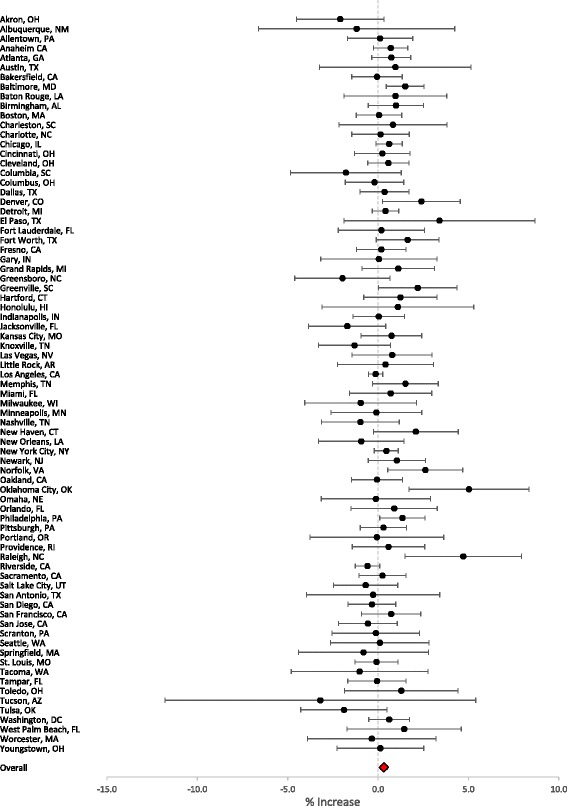
Results: Associations between a 2-day (lag 0-1 days) moving average of PM2.5 concentrations and non-accidental mortality were determined for each city. Estimated effects ranged from -3.2 to 5.1% with a pooled estimate of 0.33% (95% CI: 0.13, 0.53) increase in mortality per 10 μg/m3 increase in PM2.5. The second stage analysis determined that cluster assignment was marginally significant in explaining the city-to-city heterogeneity. The health effects estimates in cities with older, smaller homes with less AC (Cluster 1) and cities with newer, smaller homes with a large prevalence of AC (Cluster 3) were significantly lower than the cluster consisting of cities with older, larger homes with a small percentage of AC.
Conclusions: This is the first study that attempted to examine whether multiple exposure factors could explain the heterogeneity in PM2.5-mortality associations. The results of this study were found to explain a small portion (6%) of this heterogeneity.
Keywords: Cluster analysis; Epidemiology; Exposure; Meta-regression; Particulate matter.
Figures
References
MeSH terms
Substances
LinkOut - more resources
Full Text Sources
Other Literature Sources
