. 2017 Jan 3;16(1):1.
doi: 10.1186/s12936-016-1650-6.

Incidence and admission rates for severe malaria and their impact on mortality in Africa

Affiliations

Incidence and admission rates for severe malaria and their impact on mortality in Africa

Flavia Camponovo et al. Malar J. .

Abstract

Background: Appropriate treatment of life-threatening Plasmodium falciparum malaria requires in-patient care. Although the proportion of severe cases accessing in-patient care in endemic settings strongly affects overall case fatality rates and thus disease burden, this proportion is generally unknown. At present, estimates of malaria mortality are driven by prevalence or overall clinical incidence data, ignoring differences in case fatality resulting from variations in access. Consequently, the overall impact of preventive interventions on disease burden have not been validly compared with those of improvements in access to case management or its quality.

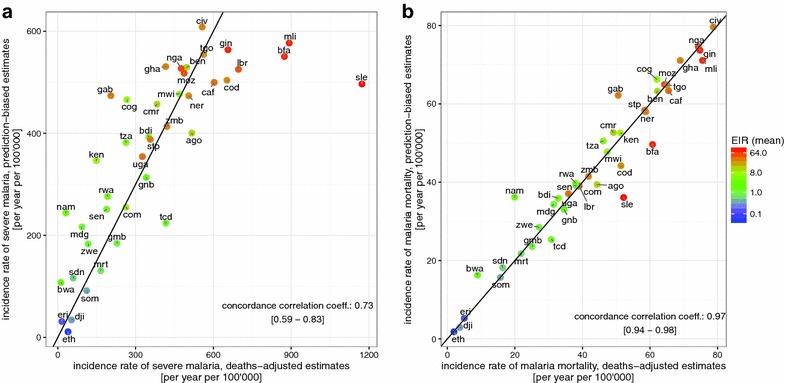
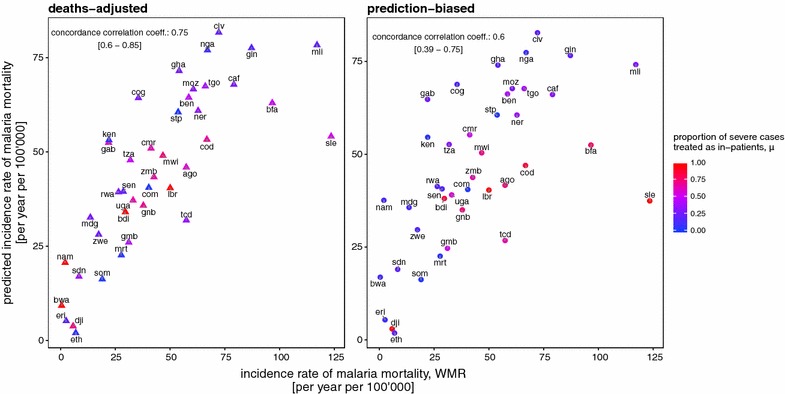
Methods: Using a simulation-based approach, severe malaria admission rates and the subsequent severe malaria disease and mortality rates for 41 malaria endemic countries of sub-Saharan Africa were estimated. Country differences in transmission and health care settings were captured by use of high spatial resolution data on demographics and falciparum malaria prevalence, as well as national level estimates of effective coverage of treatment for uncomplicated malaria. Reported and modelled estimates of cases, admissions and malaria deaths from the World Malaria Report, along with predicted burden from simulations, were combined to provide revised estimates of access to in-patient care and case fatality rates.

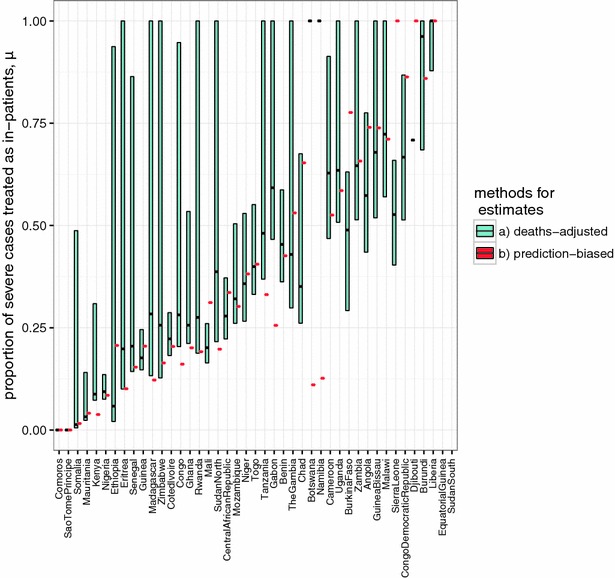
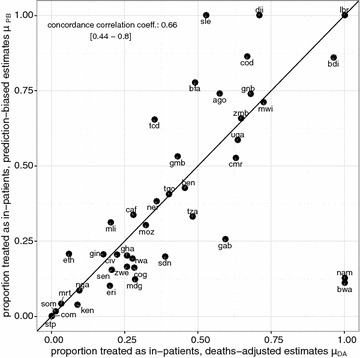
Results: There is substantial variation between countries' in-patient admission rates and estimated levels of case fatality rates. It was found that for many African countries, most patients admitted for in-patient treatment would not meet strict criteria for severe disease and that for some countries only a small proportion of the total severe cases are admitted. Estimates are highly sensitive to the assumed community case fatality rates. Re-estimation of national level malaria mortality rates suggests that there is substantial burden attributable to inefficient in-patient access and treatment of severe disease.

Conclusions: The model-based methods proposed here offer a standardized approach to estimate the numbers of severe malaria cases and deaths based on national level reporting, allowing for coverage of both curative and preventive interventions. This makes possible direct comparisons of the potential benefits of scaling-up either category of interventions. The profound uncertainties around these estimates highlight the need for better data.


Figures

Fig. 1
Fig. 1
Estimates of proportion of severe cases receiving in-patient care: country estimates of the proportion of severe cases receiving in-patient care, μ, by method of estimation. Colour indicates method with the prediction biased estimate (μPB) in orange and the deaths-adjusted estimate (μDA) in green. For the deaths adjusted estimate the bar indicates the min and max range, and black the mean
Fig. 2
Fig. 2
Relationship between mean estimates of the proportion of severe cases treated as in-patients for the two estimation methods. Country specific mean estimates of the prediction biased estimate of severe access to care (μPB) is shown on the vertical axis and the mean deaths-adjusted estimate (μDA) on the horizontal axis. The concordance correlation co-efficient was estimated as 0.66 with a confidence interval of [0.44–0.8] indicating close agreement between the two estimates. The black line indicates μPB = μDA line, and each country is indicated via their country code (Table 2)
Fig. 3
Fig. 3
Predicted national levels of severe incidence and malaria mortality rates. a Severe incidence (per year per 100,000) and (b) malaria mortality (per year per 100,000). In both panels, the horizontal axis indicates predicted national levels assuming the deaths-adjusted estimate of the proportion of severe cases treated as in-patients. The vertical axis indicates predicted national levels when assuming the prediction-biased estimate of the proportion of severe cases treated as in-patients. Mean EIR for each country is indicated by colour, with red high and blue low. The concordance correlation co-efficient was estimated as 0.73 with a confidence interval of [0.59–0.83] in a, and 0.97 with a confidence interval of [0.94–0.98] in b, indicating close agreement between the two estimates. Each country is indicated via their country code (Table 2) and the black line represents the line of equality between the two estimates
Fig. 4
Fig. 4
Predicted national levels of mortality rates compared with WMR estimates. In both panels, the horizontal axis indicates the WMR estimates of national mortality rates (per year per 100,000). The vertical axis indicates predicted national levels of malaria mortality when assuming; a the prediction-biased proportion of severe cases treated as in-patients, b the deaths-adjusted proportion of severe cases treated as in-patients. Mean estimates of proportion of severe cases receiving in-patient care is indicated by colour, with red high and blue low. The concordance correlation co-efficient was estimated as 0.74 with a confidence interval of [0.59–0.84] in a and 0.6 with a confidence interval of [0.38–0.75] in b. Each country is indicated via their country code (Table 2)
Fig. 5
Fig. 5
Expected national mortality reduction if access to severe in-patient treatment was universal. a prediction of the potential reduction in mortality rate (per year per 100,000) and (b) predictions of the potential reduction in mortality as a proportion of current predicted burden achieved by improving access to in-patient care. In both panels, the horizontal axis indicates predictions assuming the deaths-adjusted estimation method and the vertical axis indicates predictions assuming the prediction-biased estimation method. Each country is indicated via their country code (Table 2) and the black line represents the line of equality between the two estimates. In a the concordance correlation co-efficient was estimated as 0.87 with confidence interval of [0.77–0.93] indicating close agreement between the two mortality estimates. In b the concordance correlation co-efficient was estimated as 0.57 with confidence interval of [0.32–0.75] indicating moderate agreement between the two estimates

References

    1. Bhatt S, Weiss DJ, Cameron E, Bisanzio D, Mappin B, Dalrymple U, et al. The effect of malaria control on Plasmodium falciparum in Africa between 2000 and 2015. Nature. 2015;526:207–211. doi: 10.1038/nature15535. - DOI - PMC - PubMed
    1. Olliaro P. Mortality associated with severe Plasmodium falciparum malaria increases with age. Clin Infect Dis. 2008;47:158–160. doi: 10.1086/589288. - DOI - PubMed
    1. Dondorp AM, Lee SJ, Faiz MA, Mishra S, Price R, Tjitra E, et al. The relationship between age and the manifestations of and mortality associated with severe malaria. Clin Infect Dis. 2008;47:151–157. doi: 10.1086/589287. - DOI - PubMed
    1. Thwing J, Eisele TP, Steketee RW. Protective efficacy of malaria case management and intermittent preventive treatment for preventing malaria mortality in children: a systematic review for the Lives Saved Tool. BMC Public Health. 2011;11(Suppl 3):S14. doi: 10.1186/1471-2458-11-S3-S14. - DOI - PMC - PubMed
    1. WHO . World malaria report 2015. Geneva: World Health Organization; 2015.

Publication types