. 2017 Jan;205(1):409-420.
doi: 10.1534/genetics.116.193979. Epub 2016 Nov 9.

Widespread Historical Contingency in Influenza Viruses

Affiliations

Widespread Historical Contingency in Influenza Viruses

Jean Claude Nshogozabahizi et al. Genetics. 2017 Jan.

Abstract

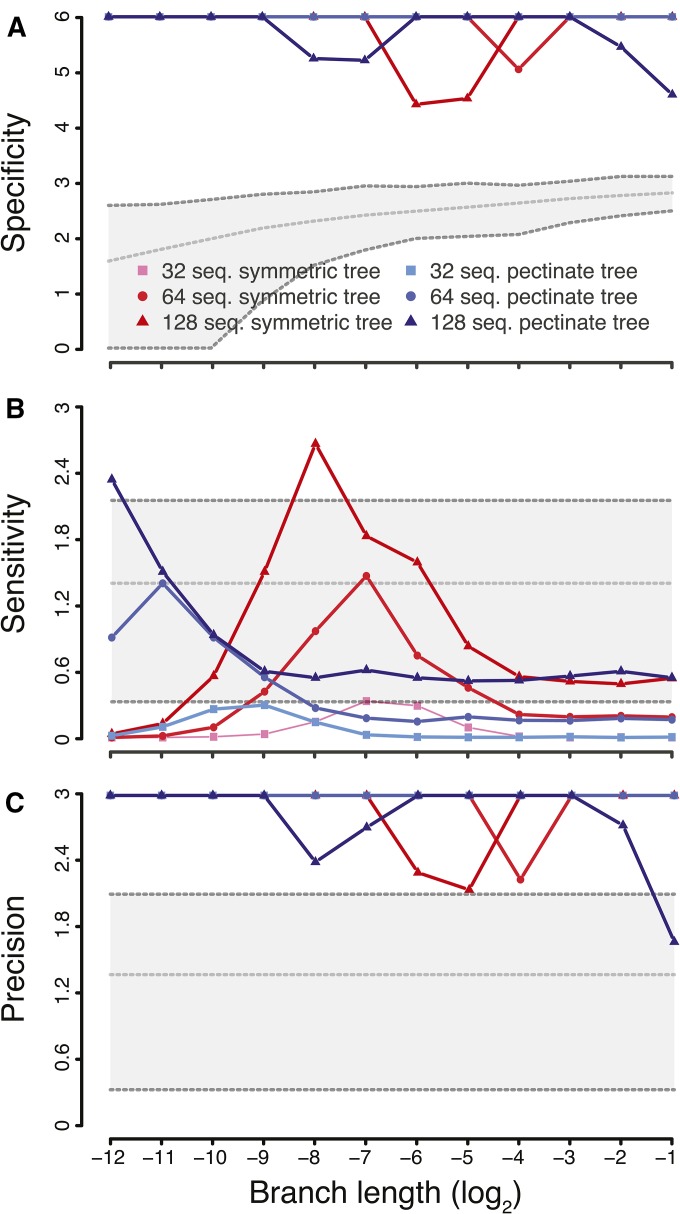
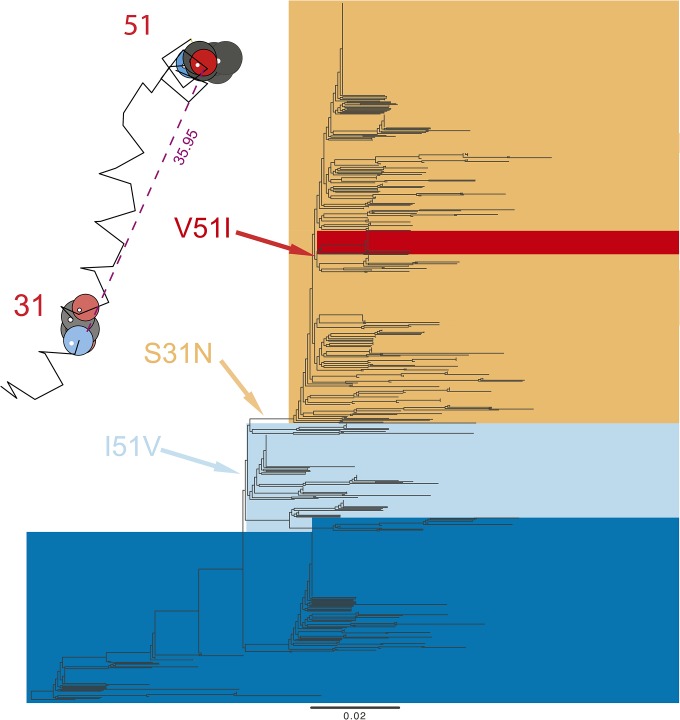
In systems biology and genomics, epistasis characterizes the impact that a substitution at a particular location in a genome can have on a substitution at another location. This phenomenon is often implicated in the evolution of drug resistance or to explain why particular "disease-causing" mutations do not have the same outcome in all individuals. Hence, uncovering these mutations and their locations in a genome is a central question in biology. However, epistasis is notoriously difficult to uncover, especially in fast-evolving organisms. Here, we present a novel statistical approach that replies on a model developed in ecology and that we adapt to analyze genetic data in fast-evolving systems such as the influenza A virus. We validate the approach using a two-pronged strategy: extensive simulations demonstrate a low-to-moderate sensitivity with excellent specificity and precision, while analyses of experimentally validated data recover known interactions, including in a eukaryotic system. We further evaluate the ability of our approach to detect correlated evolution during antigenic shifts or at the emergence of drug resistance. We show that in all cases, correlated evolution is prevalent in influenza A viruses, involving many pairs of sites linked together in chains; a hallmark of historical contingency. Strikingly, interacting sites are separated by large physical distances, which entails either long-range conformational changes or functional tradeoffs, for which we find support with the emergence of drug resistance. Our work paves a new way for the unbiased detection of epistasis in a wide range of organisms by performing whole-genome scans.

Keywords: correlated evolution; epistasis; influenza; networks.


Figures

Figure 1
Figure 1
Specificity, sensitivity, and precision results, from simulated data, of our novel epistasis detection method. Results are shown for alignments with 32 (▪), 64 (○) and 128 (▴) sequences. Tree shapes are color coded (symmetric in red; pectinate in blue). Branch lengths were varied on a log2 scale. All y-axes show the mean of log10(1summarystatistic) to highlight the performance of our method as a summary statistic approaches 1; when this value is 1, we arbitrarily assigned it a value 10% larger than the largest finite value within the set. (A) shows specificity (true negative rate) with a gray shaded polygon which illustrates thresholds for excellent specificity in parameter space. The thresholds were established by subtracting three (the number of epistatic pairs simulated) from the minimum (bottom dashed line), mean (middle dashed line), and maximum (top dashed line) number of pairwise comparisons performed across all simulations with the same branch length. These thresholds represent the number of calculable true negatives and allow us to demonstrate our method’s excellent specificity. (B and C) show sensitivity (true positive rate) and precision (positive predictive value), respectively. Each panel includes a gray shaded polygon which illustrates thresholds for 50% (bottom dashed line), 95% (middle dashed line), and 99% (top dashed line) detection. These thresholds were arbitrarily chosen to demonstrate idealized benchmarks of performance. Seq, sequence.
Figure 2
Figure 2
Epistatic pairs of AAs detected in the Gong13NP data set with the outgroup /ingroup recoding. (A) The epistatic mutations that we detected are plotted on the NP phylogenetic tree. The substitutions in red were experimentally validated (Gong et al. 2013). (B) Chained epistasis of interacting AAs. (C) The epistatic sites are mapped on a three-dimensional NP protein structure (based on template 3ZDP). The numbers show the AA positions experimentally validated (in red) and those detected only in this study (in black). The numbers in purple show the physical distance between epistatic sites (in Å).
Figure 3
Figure 3
Epistatic pairs of AAs detected in the Duan14NA data set. The epistatic mutations that we detected are plotted on the NA phylogenetic tree. Inset: the epistatic sites are mapped on a three-dimensional NA protein structure (based on template 1HA0). The numbers show the AA positions experimentally validated (in red). The numbers in purple show the physical distance between epistatic sites (in Å).
Figure 4
Figure 4
Epistatic pairs of AAs detected in the Koel13HA data set. (A) The epistatic mutations that we detected are plotted on the HA phylogenetic tree. The substitutions in red were experimentally validated to be responsible for cluster change (Koel et al. 2013). The antigenic clusters are named after the first vaccine strain in the cluster, with letters and digits referring to location and year of isolation (HK, Hong Kong; EN, England; VI, Victoria; TX, Texas; BK, Bangkok; SI, Sichuan; BE, Beijing; WU, Wuhan; SY, Sydney; FU, Fujian). (B) The thickness of the links is proportional to log10P-values, the strength of evidence supporting the interaction. (C) The epistatic sites are mapped on a three-dimensional HA protein structure (based on template 3WHE). The numbers show the AA positions experimentally validated (in red) and those detected only in this study (in black). The numbers in purple show the physical distance between epistatic sites (in Å).
Figure 5
Figure 5
Epistatic pairs of AAs detected in the Adam03M2 data set. The epistatic mutations that we detected are plotted on the M2 phylogenetic tree. Inset: the epistatic sites are mapped on a three-dimensional M2 protein structure (based on template 2KIH). The numbers show the AA positions detected (in red). The numbers in purple show the physical distance between epistatic sites (in Å).

References

    1. Abed Y., Goyette N., Boivin G., 2005. Generation and characterization of recombinant influenza A (H1N1) viruses harboring amantadine resistance mutations. Antimicrob. Agents Chemother. 49: 556–559. - PMC - PubMed
    1. Anisimova M., Gascuel O., 2006. Approximate likelihood-ratio test for branches: a fast, accurate, and powerful alternative. Syst. Biol. 55: 539–552. - PubMed
    1. Aris-Brosou S., Rodrigue N., 2012. The essentials of computational molecular evolution. Methods Mol. Biol. 855: 111–152. - PubMed
    1. Atchley W. R., Wollenberg K. R., Fitch W. M., Terhalle W., Dress A. W., 2000. Correlations among amino acid sites in bhlh protein domains: an information theoretic analysis. Mol. Biol. Evol. 17: 164–178. - PubMed
    1. Atilgan A. R., Akan P., Baysal C., 2004. Small-world communication of residues and significance for protein dynamics. Biophys. J. 86: 85–91. - PMC - PubMed

Publication types

Substances

LinkOut - more resources