. 2017 Feb 17;292(7):2881-2892.
doi: 10.1074/jbc.M116.749374. Epub 2017 Jan 3.

Biochemical Evidence for a Nuclear Modifier Allele (A10S) in TRMU (Methylaminomethyl-2-thiouridylate-methyltransferase) Related to Mitochondrial tRNA Modification in the Phenotypic Manifestation of Deafness-associated 12S rRNA Mutation

Affiliations

Biochemical Evidence for a Nuclear Modifier Allele (A10S) in TRMU (Methylaminomethyl-2-thiouridylate-methyltransferase) Related to Mitochondrial tRNA Modification in the Phenotypic Manifestation of Deafness-associated 12S rRNA Mutation

Feilong Meng et al. J Biol Chem. .

Abstract

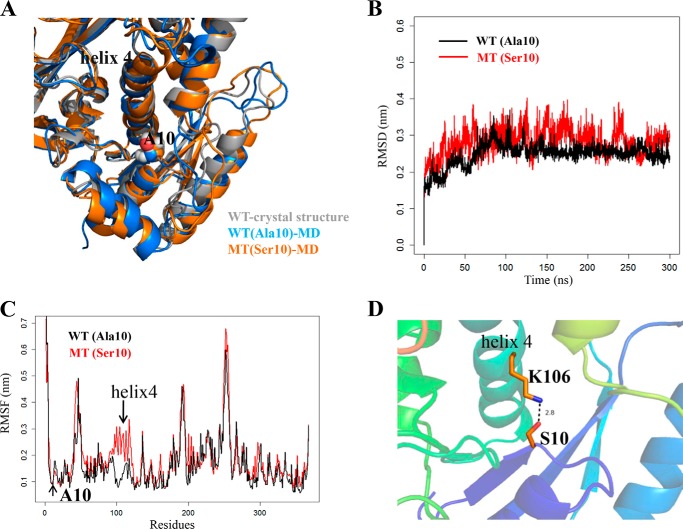
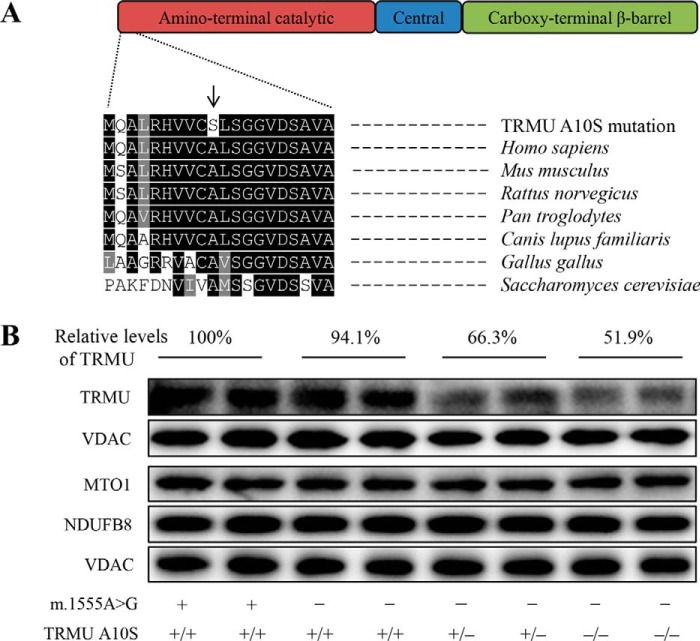
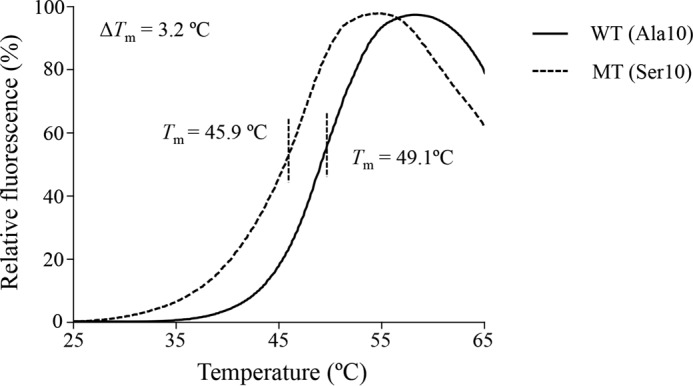
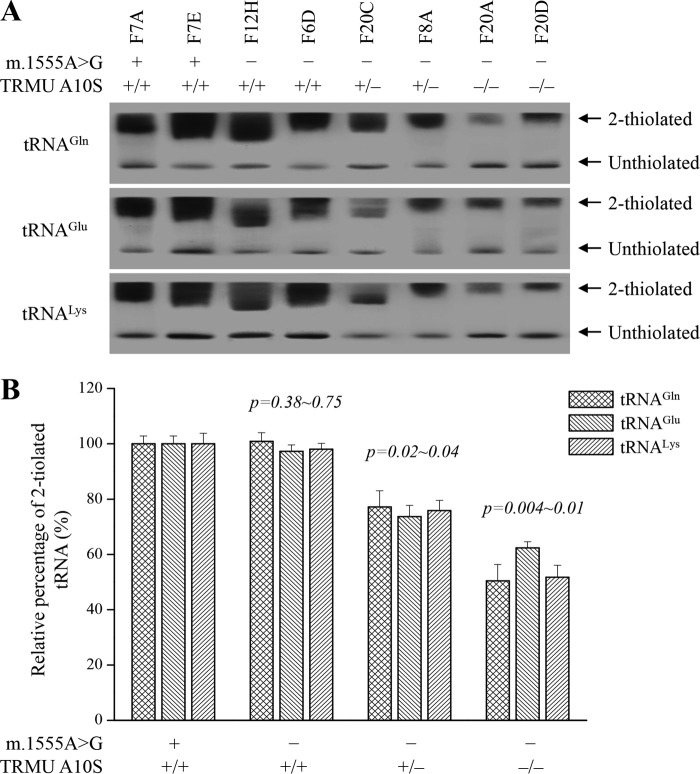
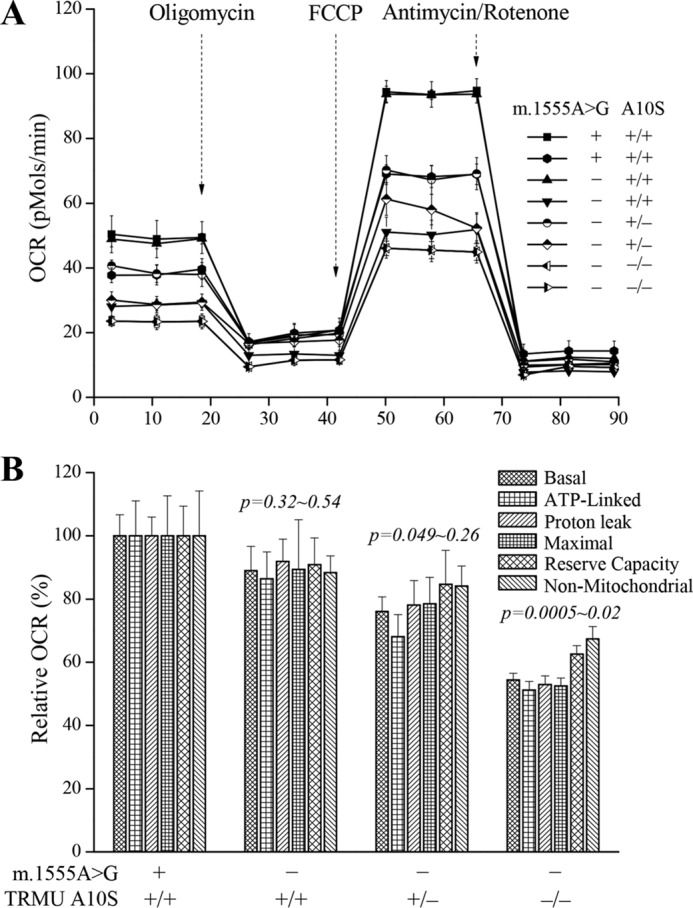
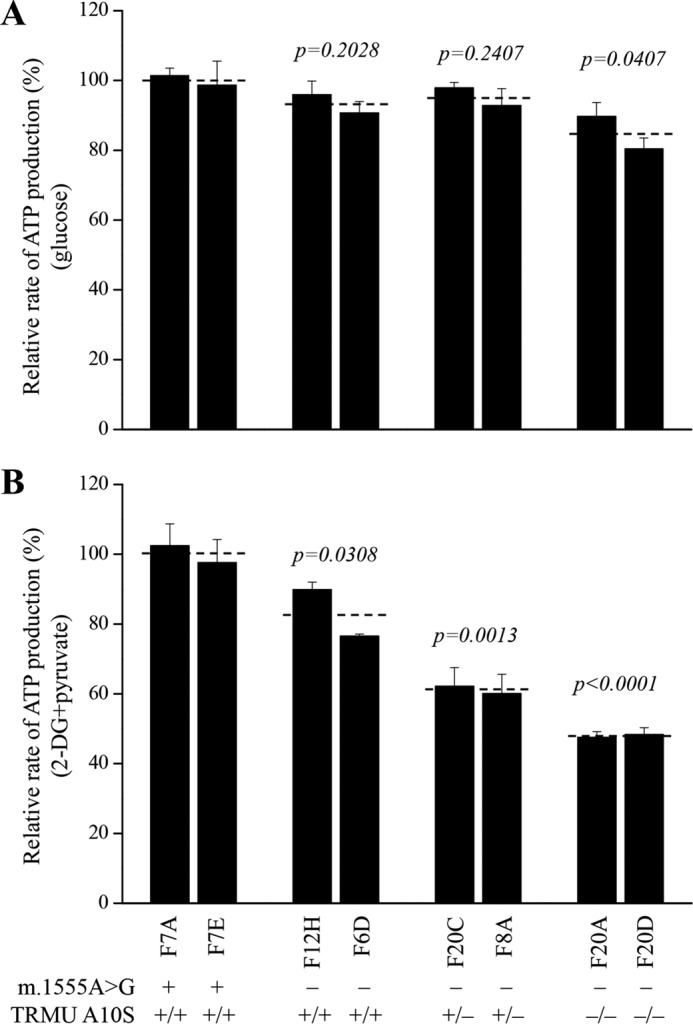
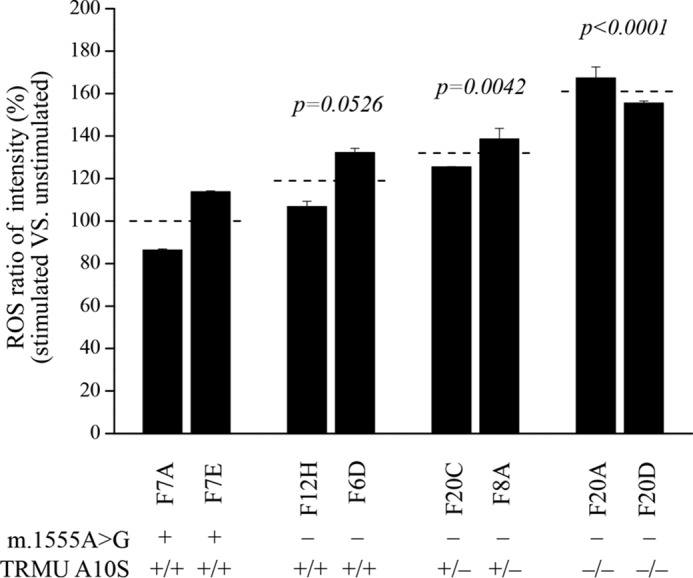
Nuclear modifier gene(s) was proposed to modulate the phenotypic expression of mitochondrial DNA mutation(s). Our previous investigations revealed that a nuclear modifier allele (A10S) in TRMU (methylaminomethyl-2-thiouridylate-methyltransferase) related to tRNA modification interacts with 12S rRNA 1555A→G mutation to cause deafness. The A10S mutation resided at a highly conserved residue of the N-terminal sequence. It was hypothesized that the A10S mutation altered the structure and function of TRMU, thereby causing mitochondrial dysfunction. Using molecular dynamics simulations, we showed that the A10S mutation introduced the Ser10 dynamic electrostatic interaction with the Lys106 residue of helix 4 within the catalytic domain of TRMU. The Western blotting analysis displayed the reduced levels of TRMU in mutant cells carrying the A10S mutation. The thermal shift assay revealed the Tm value of mutant TRMU protein, lower than that of the wild-type counterpart. The A10S mutation caused marked decreases in 2-thiouridine modification of U34 of tRNALys, tRNAGlu and tRNAGln However, the A10S mutation mildly increased the aminoacylated efficiency of tRNAs. The altered 2-thiouridine modification worsened the impairment of mitochondrial translation associated with the m.1555A→G mutation. The defective translation resulted in the reduced activities of mitochondrial respiration chains. The respiratory deficiency caused the reduction of mitochondrial ATP production and elevated the production of reactive oxidative species. As a result, mutated TRMU worsened mitochondrial dysfunctions associated with m.1555A→G mutation, exceeding the threshold for expressing a deafness phenotype. Our findings provided new insights into the pathophysiology of maternally inherited deafness that was manifested by interaction between mtDNA mutation and nuclear modifier gene.

Keywords: hearing; mitochondrial DNA (mtDNA); mitochondrial disease; molecular modeling; oxygen radicals; post-translational modification (PTM); respiration; ribosomal ribonucleic acid (rRNA) (ribosomal RNA); transfer RNA (tRNA); translation.


Conflict of interest statement

The authors declare that they have no conflicts of interest with the contents of this article

Figures

FIGURE 1.
FIGURE 1.
MD simulations on the wild-type and mutated TRMU proteins. A, superimposition of the crystal structure (gray) with the structures of wild-type (blue) and A10S mutant (orange) proteins at the end of the simulations. B, time evolution of the root mean square deviation (RMSD) values of all Cα atoms for the wild-type (black lines) and A10S mutant (red lines) proteins. C, RMSF curves were generated from the backbone atoms for the wild-type (black lines) and A10S mutant (red lines) proteins. D, electrostatic interactions formed between Ser10 and Lys106 in the mutant protein.
FIGURE 2.
FIGURE 2.
The A10S mutation caused the reduced levels of TRMU. A, scheme for the multiple sequence alignment of the TRMU homologues. The position of A10S mutation is marked with an arrow. B, Western blotting analysis of six mutant and two control cell lines. 20 μg of total cellular proteins from various cell lines were electrophoresed through a denaturing polyacrylamide gel, electroblotted and hybridized with TRMU, MTO1, and NDUFB8, respectively, and with VDAC as a loading control. Quantifications of TRMU levels were determined as described elsewhere (15). The values for the mutant cell lines are expressed as percentages of the average values for the control cell lines. Cell lines harboring homozygous (−/−), heterozygous (+/−), or wild-type (+/+) TRMU mutations are indicated. Cell lines carrying the m.1555A→G (−) or wild type (+) are indicated.
FIGURE 3.
FIGURE 3.
Thermal stability of wild-type and mutant TRMU. The thermal denaturation was induced heating wild-type (solid line) and mutant (dashed line) TRMU proteins from 25 to 95 °C. Relative fluorescence curves were generated with the equation (FTFmin)/(FmaxFmin), where T indicates fluorescence at temperature T, Fmin indicates the minimum fluorescence, and Fmax indicates the maximum fluorescence. ΔTm indicates the difference of Tm value between wild-type and mutant TRMU. The calculations were based on three to four determinations.
FIGURE 4.
FIGURE 4.
APM gel electrophoresis combined with Northern blotting of mitochondrial tRNAs. A, equal amounts (2 μg) of total mitochondrial RNAs were separated by polyacrylamide gel electrophoresis that contains 0.05 mg/ml APM and electroblotted onto a positively charged membrane and hybridized with DIG-labeled oligonucleotide probes specific for the tRNALys. The blots were then stripped and rehybridized with DIG-labeled probes for tRNAGlu and tRNAGln, respectively. The retarded bands of 2-thiolated tRNAs and non-retarded bands of tRNA without thiolation are marked by arrows. B, proportion in vivo of the 2-thiouridine modification levels of tRNAs. The proportion values for the mutant cell lines are expressed as percentages of the average values for the control cell lines. The calculations were based on three independent determinations of each tRNA in each cell line. The error bars indicate standard deviation; P indicates the significance, according to Student's t test, of the difference between mutant and control for each tRNA.
FIGURE 5.
FIGURE 5.
In vivo aminoacylation assays. A, 2 μg of total mitochondrial RNAs purified from eight cell lines under acid conditions were electrophoresed at 4 °C through an acid (pH 5.2) 10% polyacrylamide with 7 m urea gel, electroblotted, and hybridized with a DIG-labeled oligonucleotide probe-specific for the tRNALys, tRNATyr, tRNALeu(CUN), and tRNASer(AGY), respectively. B, in vivo aminoacylated proportions of tRNALys, tRNATyr, tRNALeu(CUN), and tRNASer(AGY) in the mutant and controls. The calculations were based on three independent determinations. Graph details and symbols are explained in the legend to Fig. 4.
FIGURE 6.
FIGURE 6.
Western blotting analysis of mitochondrial proteins. A, 20 μg of total cellular proteins from lymphoblastoid cell lines were electrophoresed through a SDS-polyacrylamide gel, electroblotted, and hybridized with seven respiratory complex subunits in mutant and control cells with VADC as a loading control. CO2, subunit II of cytochrome c oxidase; ND1, ND4, ND5, and ND6, subunits 1, 4, 5, and 6 of the reduced nicotinamide-adenine dinucleotide dehydrogenase; A6, subunit 6 of the H+-ATPase; and CYTB, apocytochrome b. B, quantification of mitochondrial protein levels. Average content of CO2, ND1, ND4, ND5, ND6, A6 and CYTB per cell, normalized to the average content of VADC per cell in mutant cell lines and controls. The values for the mutant cell lines are expressed as percentages of the average values for the control cell lines. The horizontal dashed lines represent the average value for each group. The calculations were based on three independent determinations. Graph details and symbols are explained in the legend to Fig. 4.
FIGURE 7.
FIGURE 7.
Respiration assays. A, an analysis of O2 consumption in the various cell lines using different inhibitors. The OCRs were first measured on 5 × 10⁴ cells of each cell line under basal condition and then sequentially added to oligomycin (1.5 μm), carbonyl cyanide p-(trifluoromethoxy) phenylhydrazone (FCCP) (0.8 μm), rotenone (1 μm), and antimycin A (5 μm) at indicated times to determine different parameters of mitochondrial functions. B, graphs presented the ATP-linked OCR, proton leak OCR, maximal OCR, reserve capacity, and non-mitochondrial OCR in mutant and control cell lines. Non-mitochondrial OCR was determined as the OCR after rotenone/antimycin A treatment. Basal OCR was determined as OCR before oligomycin minus OCR after rotenone/antimycin. ATP-linked OCR was determined as OCR before oligomycin minus OCR after oligomycin. Proton leak was determined as basal OCR minus ATP-linked OCR. Maximal OCR was determined as the OCR after FCCP minus non-mitochondrial OCR. Reserve capacity was defined as the difference between maximal OCR after FCCP minus basal OCR. The average of four determinations for each cell line is shown. The horizontal dashed lines represent the average value for each group. Graph details and symbols are explained in the legend to Fig. 4.
FIGURE 8.
FIGURE 8.
Measurement of cellular and mitochondrial ATP levels using bioluminescence assay. The cells were incubated with 10 mm glucose or 5 mm 2-deoxy-d-glucose plus 5 mm pyruvate to determine ATP generation under mitochondrial ATP synthesis. The average rates of ATP level per cell line are shown. A, ATP level in total cells. B, ATP level in mitochondria. Six to seven determinations were made for each cell line. Graph details and symbols are explained in the legend to Fig. 4.
FIGURE 9.
FIGURE 9.
Ratio of geometric mean intensity between levels of the ROS generation in the vital cells with or without H2O2 stimulation. The rates of production in ROS from mutant cell lines and control cell lines were analyzed by BD-LSR II flow cytometer system with or without H2O2 stimulation. The relative ratio of intensity (stimulated versus unstimulated with H2O2) was calculated. The average of four determinations for each cell line is shown. Graph details and symbols are explained in the legend to Fig. 4.

References

    1. Jacobs H. (2003) Disorders of mitochondrial protein synthesis. Hum. Mol. Genet. 12, R293–R301 - PubMed
    1. Rötig A. (2011) Human diseases with impaired mitochondrial protein synthesis. Biochim. Biophys. Acta. 1807, 1198–1205 - PubMed
    1. Fischel-Ghodsian N. (1999) Mitochondrial deafness mutations reviewed. Hum. Mutat. 13, 261–270 - PubMed
    1. Guan M. X. (2011) Mitochondrial 12S rRNA mutations associated with aminoglycoside ototoxicity. Mitochondrion 11, 237–245 - PubMed
    1. Zheng J., Ji Y., and Guan M. X. (2012) Mitochondrial tRNA mutations associated with deafness. Mitochondrion 12, 406–413 - PubMed

Publication types

Associated data