. 2017 Feb 10;292(6):2379-2394.
doi: 10.1074/jbc.M116.765362. Epub 2017 Jan 3.

Allosteric Transmission along a Loosely Structured Backbone Allows a Cardiac Troponin C Mutant to Function with Only One Ca2+ Ion

Affiliations

Allosteric Transmission along a Loosely Structured Backbone Allows a Cardiac Troponin C Mutant to Function with Only One Ca2+ Ion

Mayra de A Marques et al. J Biol Chem. .

Abstract

Hypertrophic cardiomyopathy (HCM) is one of the most common cardiomyopathies and a major cause of sudden death in young athletes. The Ca2+ sensor of the sarcomere, cardiac troponin C (cTnC), plays an important role in regulating muscle contraction. Although several cardiomyopathy-causing mutations have been identified in cTnC, the limited information about their structural defects has been mapped to the HCM phenotype. Here, we used high-resolution electron-spray ionization mass spectrometry (ESI-MS), Carr-Purcell-Meiboom-Gill relaxation dispersion (CPMG-RD), and affinity measurements of cTnC for the thin filament in reconstituted papillary muscles to provide evidence of an allosteric mechanism in mutant cTnC that may play a role to the HCM phenotype. We showed that the D145E mutation leads to altered dynamics on a μs-ms time scale and deactivates both of the divalent cation-binding sites of the cTnC C-domain. CPMG-RD captured a low populated protein-folding conformation triggered by the Glu-145 replacement of Asp. Paradoxically, although D145E C-domain was unable to bind Ca2+, these changes along its backbone allowed it to attach more firmly to thin filaments than the wild-type isoform, providing evidence for an allosteric response of the Ca2+-binding site II in the N-domain. Our findings explain how the effects of an HCM mutation in the C-domain reflect up into the N-domain to cause an increase of Ca2+ affinity in site II, thus opening up new insights into the HCM phenotype.

Keywords: calcium-binding protein; cardiomyopathy; nuclear magnetic resonance (NMR); protein structure; small-angle X-ray scattering (SAXS); troponin.


Conflict of interest statement

The authors declare that they have no conflicts of interest with the contents of this article

Figures

FIGURE 1.
FIGURE 1.
D145E C-domain adopts an open conformation. A, Ca2+ titrations in WT and HCM-related mutants. F0 corresponds to the background fluorescence of cTnC with bis-ANS at 488 nm before the addition of Ca2+. pCa represents −log[Ca2+]. Black lines show fittings with a two-transition sigmoidal equation. B, bis-ANS fluorescence at λmax (i.e. 488 nm) at pCa 9.0 and 4.0 for WT and studied mutants. Each point shows independent experiments. Bars represent the average ± S.E.
FIGURE 2.
FIGURE 2.
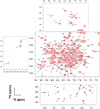
1H-15N HSQC spectrum showing the backbone assignment of NH cross-peaks for holo-WT cTnC.
FIGURE 3.
FIGURE 3.
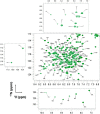
1H-15N HSQC spectrum showing the backbone assignment of NH cross-peaks for holo-D145E cTnC.
FIGURE 4.
FIGURE 4.
D145E eliminates the binding of two Ca2+ ions in cTnC. A, CSP plots as a function of residue, comparing pCa 2.5 (black) and pCa 6.0 (red) against pCa 7.0 for WT and D145E. Average values of CSP among residues ± S.D. were 0.104 ± 0.114 for pCa 2.5 WT, 0.131 ± 0.138 for pCa 2.5 D145E, 0.033 ± 0.036 for pCa 6.0 WT, and 0.018 ± 0.022 for pCa 6.0 D145E. Solid, dashed, and dotted blue lines show average CSP values for pCa 2.5, average ± 1 S.D., and average ± 2 S.D., respectively. B, residues exhibiting CSP values greater than 1 S.D. above the average taken across all evaluated residues are highlighted in different stick colors in the cTnC subunit (gray ribbon) of the cTn complex (PDB code 1J1E) for WT and D145E at both studied pCa values. The structure is tilted at different angles for better visualization of the highlighted residues. C, schematic representation of MALDI-TOF/MS (red) and ESI-MS (black) m/z and Δm/z values for WT and D145E in apo- and holo-states. The X marks the position of the mutation in Ca2+-binding site IV. Empty Ca2+-binding sites are shown in gray and filled sites in red.
FIGURE 5.
FIGURE 5.
SDS-PAGE and ESI-MS analysis of WT and D145E. A and B, the accurate molecular masses and purity of 15N cTnC WT (A) and D145E (B) were determined by MALDI-TOF/MS. Samples were prepared in the absence of Ca2+. A, inset shows an SDS-PAGE to demonstrate protein purities. Lanes: 1, WT; 2, WT 5× concentrated; 3, D145E; 4, D145E 5× concentrated. C–F, the average molecular masses and binding of Ca2+ to WT and D145E were determined by ESI-MS analysis (Table 2). All samples were mixed in similar molar concentrations, and direct injection was performed at a constant flow rate (0.4 ml · min−1) using 50% acetonitrile. Intensity (%) is shown as a function of m/z for 15N-cTnC WT apo (C) and holo (D) and D145E apo (E) and holo (F).
FIGURE 6.
FIGURE 6.
Melting temperatures (Tm) for WT and three mutants in apo- and holo-states obtained by fitting to a two-transition model. Points represent the Tm values of independent experiments (n = 3). *, significantly different from WT (p < 0.05); **, (p < 0.01); and ***, (p < 0.001).
FIGURE 7.
FIGURE 7.
The overall structure of cTnC D145E is similar to WT. A, per-residue secondary structure content (SS) obtained from TALOS+ for holo-WT (upper plot) and holo-D145E (lower plot). α-Helical regions are shown in red, β-sheet regions in cyan, and loops as open spaces. B, scattering intensities I(s) in log scale versus s obtained from SAXS for holo-WT (filled circles) and holo-D145E (open circles). Inset, represents Guinier plots for each construct showing no evidence of aggregation. C, pair-distance distribution functions of interatomic vectors (P(r)) obtained from the scattering intensities for WT (black) and D145E (red) exhibit the radius of one domain and the distance between two domains (first and second peak, respectively). D, schematic representation of [P(r)] values for WT and D145E obtained in C. E, Kratky plots in the presence of 5 m urea for WT (top) and D145E (bottom) in the presence (black) and absence (red) of Ca2+.
FIGURE 8.
FIGURE 8.
Small-angle X-ray scattering data for WT and cTnC mutants. A–D, relative distance distribution functions (P(r)) of mutants in the apo (dark cyan)- and holo-states (orange) for WT (A), A31S (B), A8V (C), and D145E (D), respectively.
FIGURE 9.
FIGURE 9.
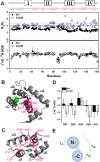
Backbone dynamics of holo-WT and holo-D145E. A, upper panel, R2/R1 relaxation ratio per residue for WT (filled circles) and D145E (open circles). The solid and dashed blue lines represent the R2/R1 average values among residues for D145E and 1 S.D. from the average, respectively. Ca2+-binding sites and secondary structure elements are shown schematically along the top; the dashed box represents inactive binding site I. Lower panel, {1H}-15N NOE data per residue. B and C, residues of D145E with R2/R1 values > average + 1 S.D. are highlighted in magenta in the structure of cTnC (PDB code 1J1E). Sites for Ca2+ are shown as a green sphere in B and as empty circles in C. D, {1H}-15N NOE values for the linker residues connecting N- to C-domains. E, schematic showing different correlation times (τc1, τc2, and τcG) for the N-domain, the C-domain, and the overall WT cTnC.
FIGURE 10.
FIGURE 10.
Quantitative analysis of exchange dynamics in D145E. A, R2eff values for each residue obtained by CPMG relaxation dispersion of WT and D145E in the holo-state at 50 Hz (filled circles) and 1000 Hz (open circles). Upper panels, 25 °C; lower panels, 37 °C. B, residues experiencing intermediate exchange at 37 °C are mapped in blue on the surface of the cTnC structure (gray) for WT and D145E. Residues mapped in pink present fast-exchange rates. C, effective transverse relaxation rates (R2,eff) at 37 °C plotted as a function of frequency (υCPMG) for the representative residues Arg-102, Asp-131, Lys-138, and Met-157 at 500 and 800 MHz for holo-D145E (open and filled symbols, respectively).
FIGURE 11.
FIGURE 11.
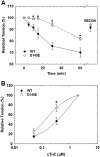
Dissociation from and binding of cTnC D145E to thin filaments in skinned rat cardiac fibers. A, the D145E mutation significantly slows the dissociation of cTnC from the thin filament. Native cTnC was extracted and fibers were reconstituted with human recombinant cTnC WT or D145E. The dissociation of cTnC is represented by the fall in tension after cTnC extraction and reconstitution. RECON, tension recovery following incubation with the same protein after the dissociation curve. B, the D145E mutation significantly increases cTnC binding affinity to the thin filament. Native cTnC was extracted, and fibers were successively incubated with increasing concentrations of human recombinant cTnC WT or D145E (see “Experimental Procedures” for further details). *, p < 0.05 for D145E versus WT at the same time point (A) or at same cTnC concentration (B).
FIGURE 12.
FIGURE 12.
Illustration of the structural effects of D145E on thin filaments. The proposed allosteric mechanism of Ca2+ binding with higher affinity to the N-domain site II due to a loose D145E C-terminal domain is presumably transferred through the connecting elements, linker D/E and αD, and is extended to a higher affinity of D145E to the thin filament (dark green). The structure of actin-tropomyosin was obtained from PDB 4A7F. The structure of the core domain of troponin complex was obtained from PDB 1J1E.

References

    1. Lan F., Lee A. S., Liang P., Sanchez-Freire V., Nguyen P. K., Wang L., Han L., Yen M., Wang Y., Sun N., Abilez O. J, Hu S., Ebert A. D., Navarrete E. G., Simmons C. S., et al. (2013) Abnormal calcium handling properties underlie familial hypertrophic cardiomyopathy pathology in patient-specific induced pluripotent stem cells. Cell Stem Cell 12, 101–113 - PMC - PubMed
    1. Writing Group Members, Mozaffarian D., Benjamin E. J., Go A. S., Arnett D. K., Blaha M. J., Cushman M., Das S. R., de Ferranti S., Després J. P., Fullerton H. J., Howard V. J., Huffman M. D., Isasi C. R., Jiménez M. C., Judd S. E., et al. (2016) Heart disease and stroke statistics-2016 update: a report from the American Heart Association. Circulation 133, e38–e60 - PubMed
    1. Maron B. J., Towbin J. A., Thiene G., Antzelevitch C., Corrado D., Arnett D., Moss A. J., Seidman C. E., Young J. B., American Heart Association, Council on Clinical Cardiology, Heart Failure and Transplantation Committee, Quality of Care and Outcomes Research and Functional Genomics and Translational Biology Interdisciplinary Working Groups, and Council on Epidemiology and Prevention (2006) Contemporary definitions and classification of the cardiomyopathies: an American Heart Association Scientific Statement from the Council on Clinical Cardiology, Heart Failure and Transplantation Committee; Quality of Care and Outcomes Research and Functional Genomics and Translational Biology Interdisciplinary Working Groups; and Council on Epidemiology and Prevention. Circulation 113, 1807–1816 - PubMed
    1. Landstrom A. P., Parvatiyar M. S., Pinto J. R., Marquardt M. L., Bos J. M., Tester D. J., Ommen S. R., Potter J. D., and Ackerman M. J. (2008) Molecular and functional characterization of novel hypertrophic cardiomyopathy susceptibility mutations in TNNC1-encoded troponin C. J. Mol. Cell. Cardiol. 45, 281–288 - PMC - PubMed
    1. Parvatiyar M. S., Landstrom A. P., Figueiredo-Freitas C., Potter J. D., Ackerman M. J., and Pinto J. R. (2012) A mutation in TNNC1-encoded cardiac troponin C, TNNC1-A31S, predisposes to hypertrophic cardiomyopathy and ventricular fibrillation. J. Biol. Chem. 287, 31845–31855 - PMC - PubMed

Publication types

LinkOut - more resources