Randomized Controlled Trial
. 2017 Jan 17;114(3):E367-E375.
doi: 10.1073/pnas.1606722113. Epub 2017 Jan 3.

Impact of short-chain galactooligosaccharides on the gut microbiome of lactose-intolerant individuals

Affiliations
Randomized Controlled Trial

Impact of short-chain galactooligosaccharides on the gut microbiome of lactose-intolerant individuals

M Andrea Azcarate-Peril et al. Proc Natl Acad Sci U S A. .

Abstract

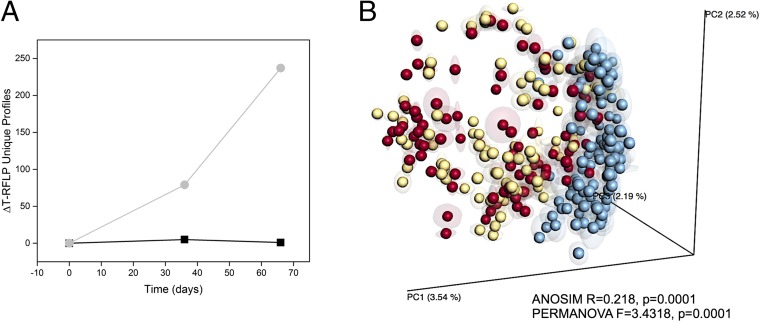
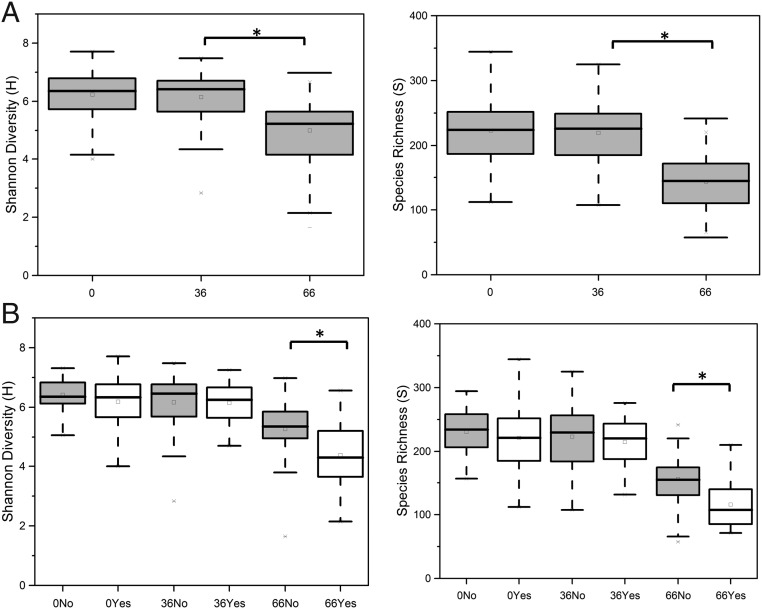
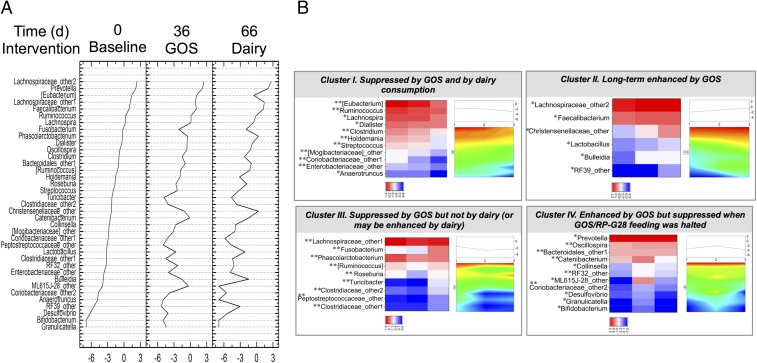
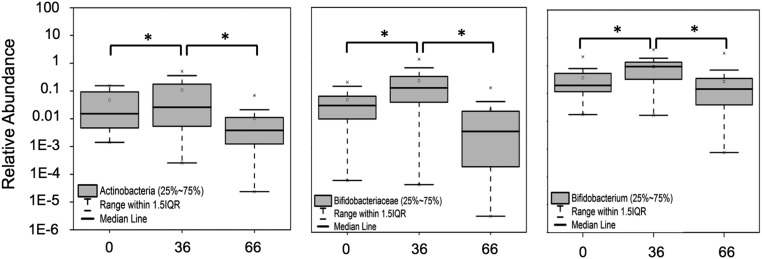
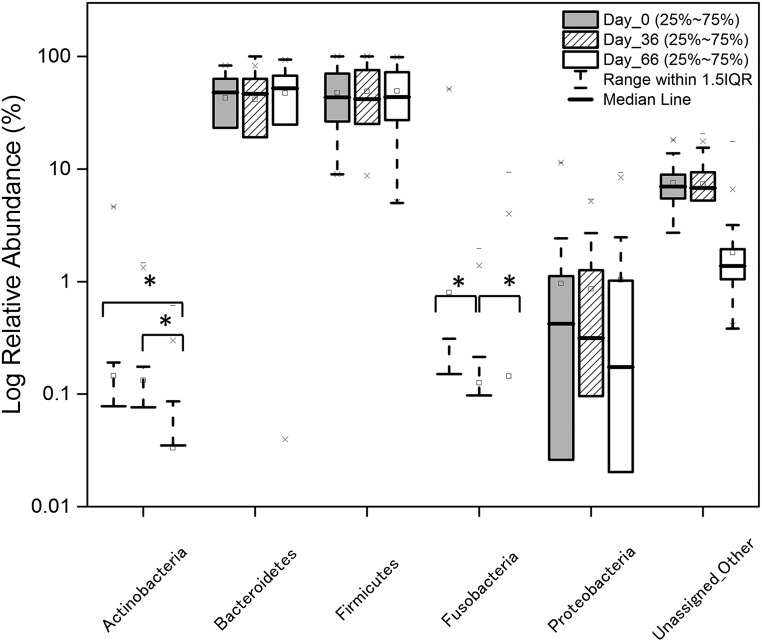
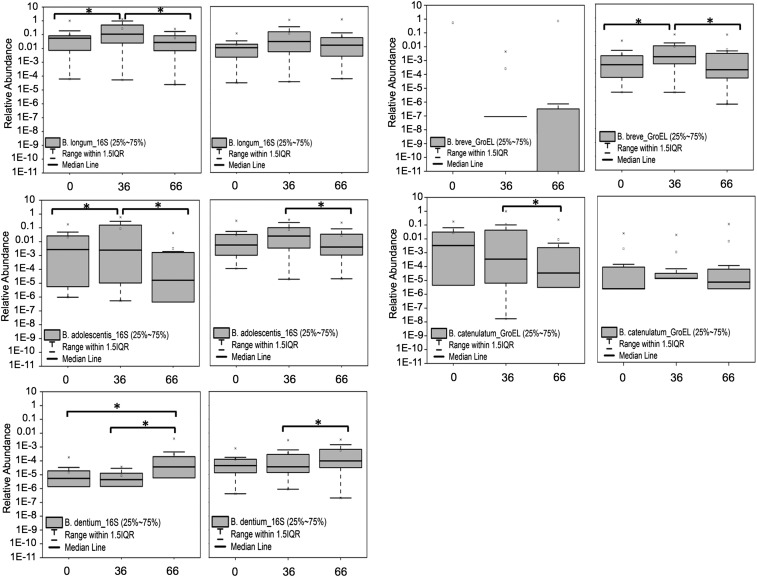
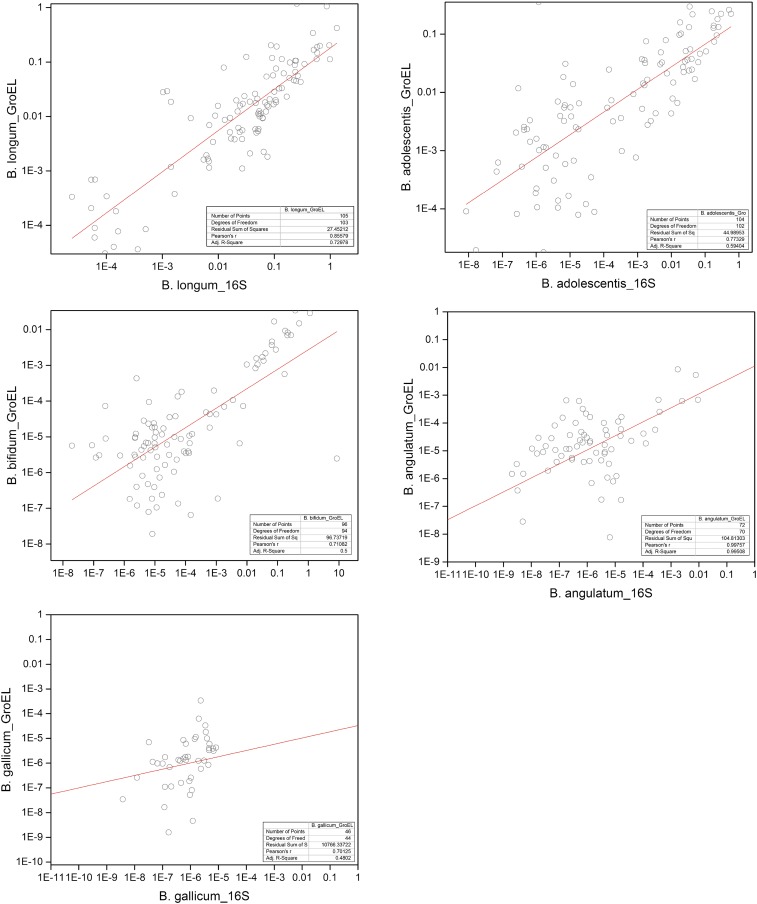
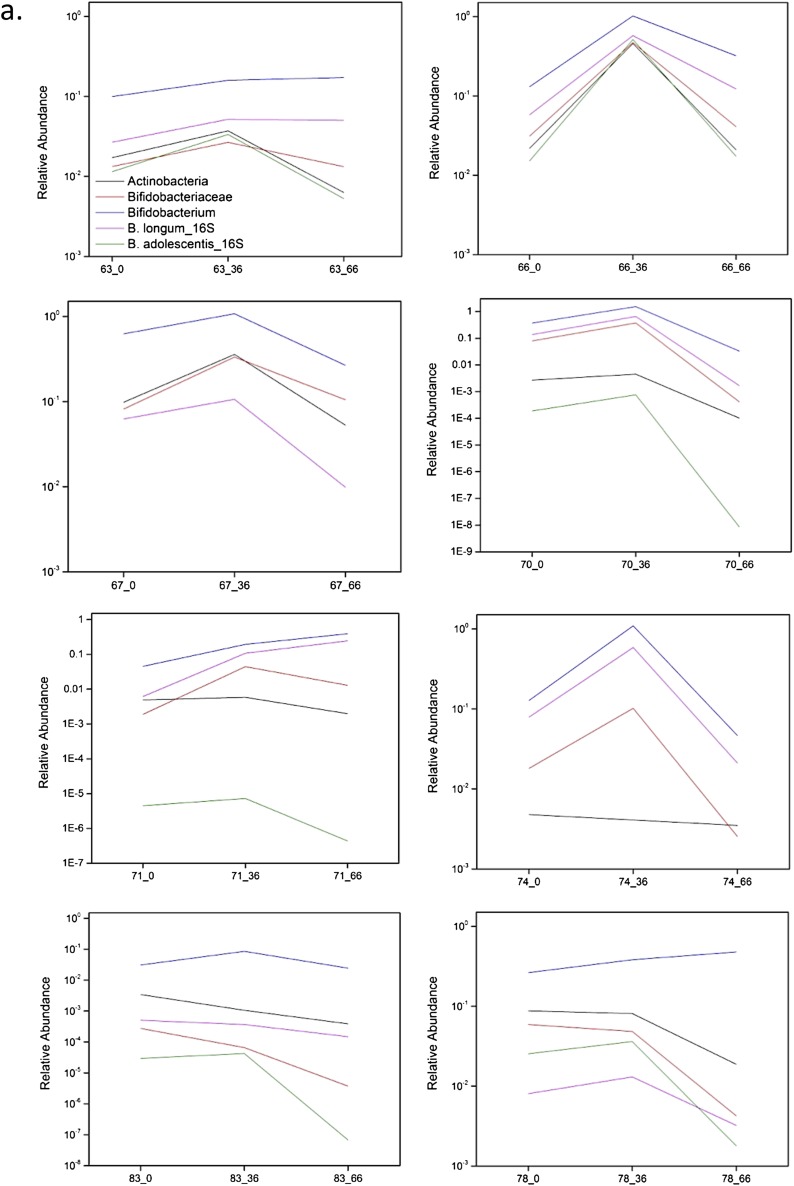
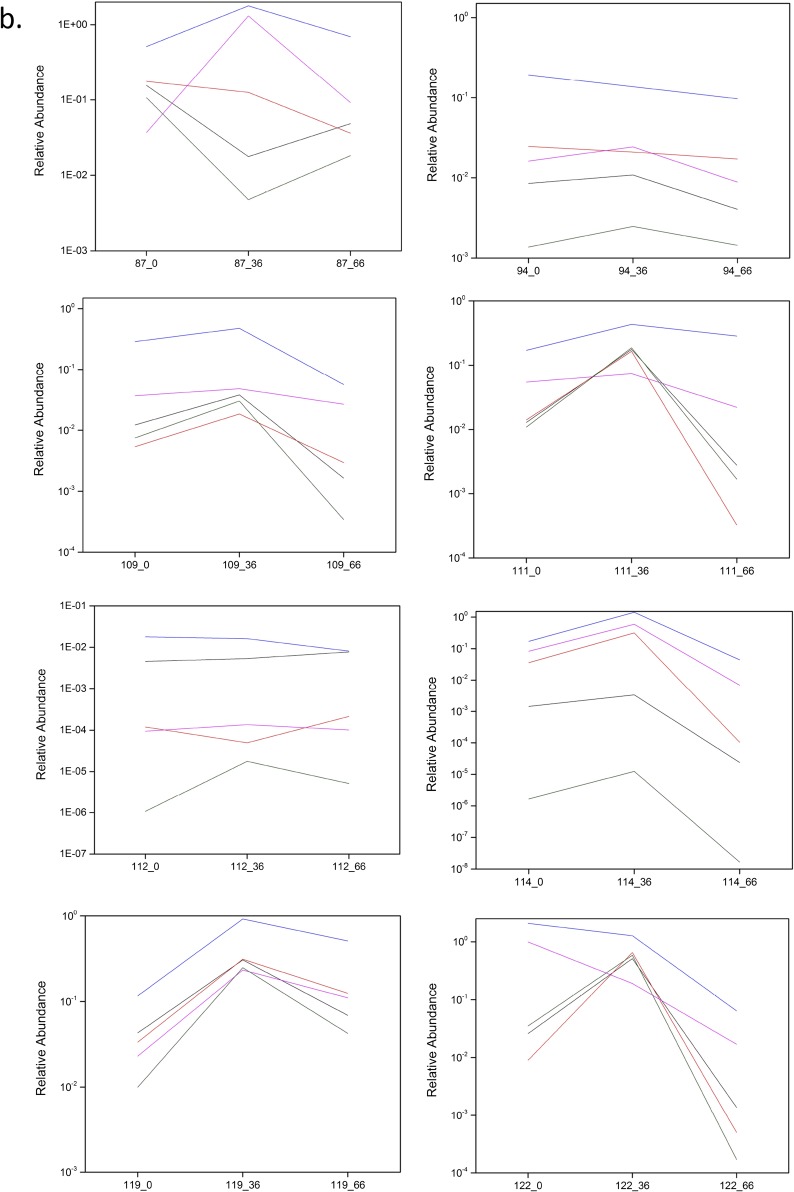
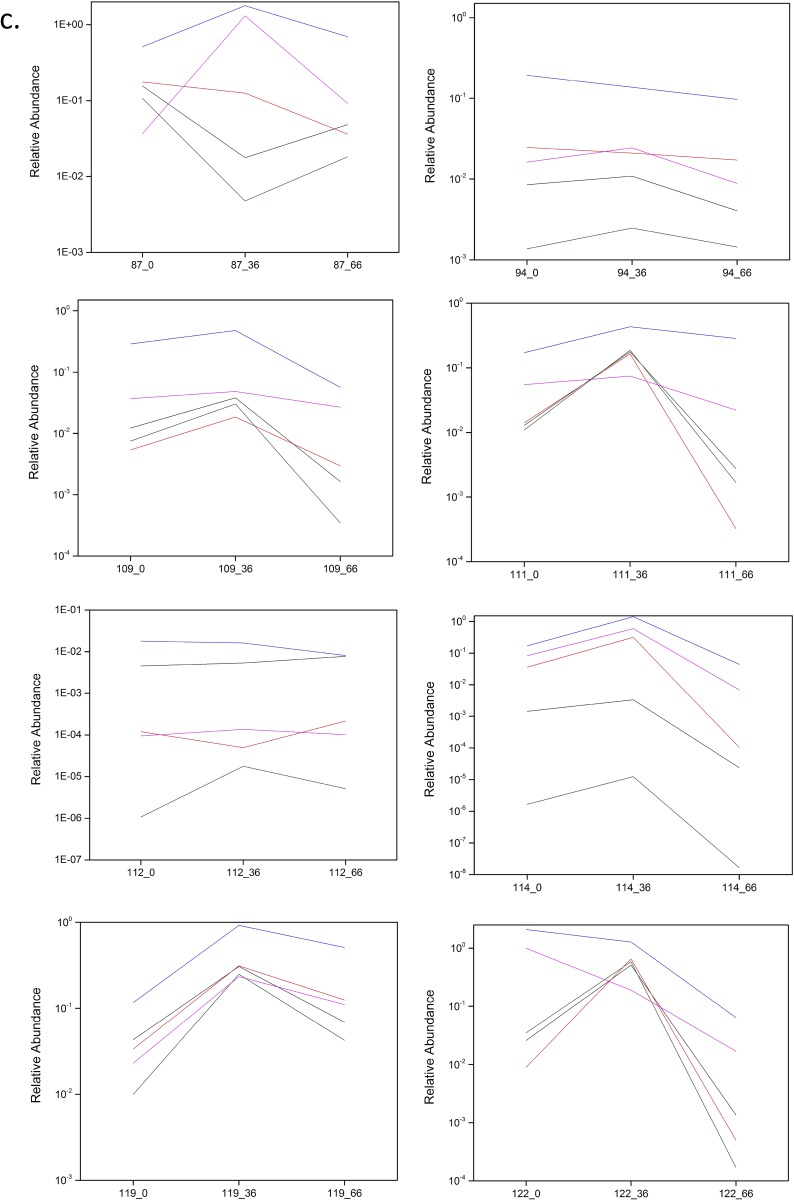
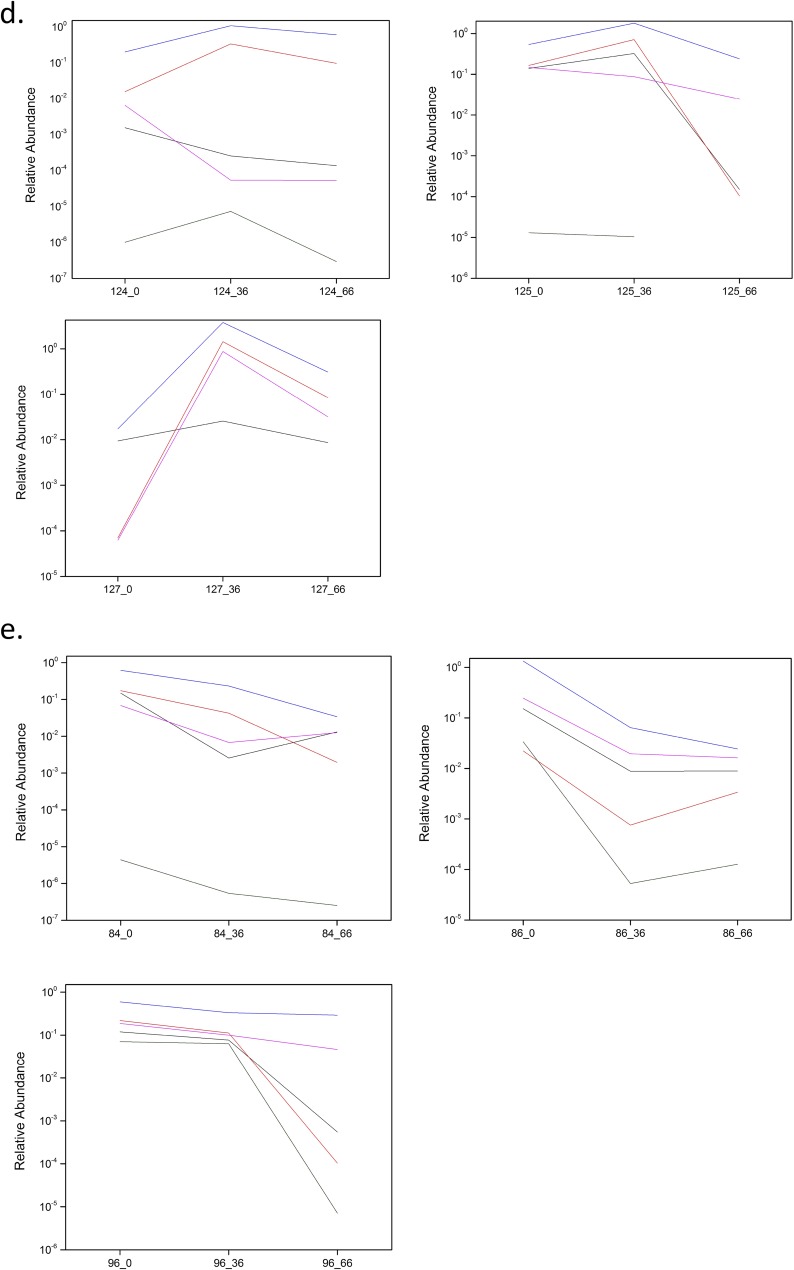
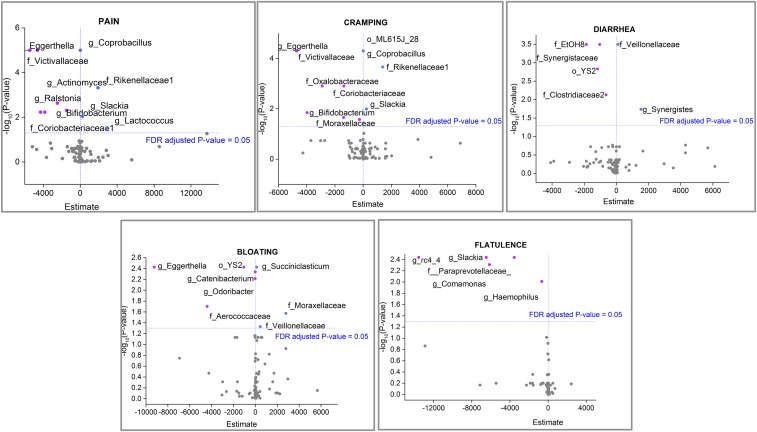
Directed modulation of the colonic bacteria to metabolize lactose effectively is a potentially useful approach to improve lactose digestion and tolerance. A randomized, double-blind, multisite placebo-controlled trial conducted in human subjects demonstrated that administration of a highly purified (>95%) short-chain galactooligosaccharide (GOS), designated "RP-G28," significantly improved clinical outcomes for lactose digestion and tolerance. In these individuals, stool samples were collected pretreatment (day 0), after GOS treatment (day 36), and 30 d after GOS feeding stopped and consumption of dairy products was encouraged (day 66). In this study, changes in the fecal microbiome were investigated using 16S rRNA amplicon pyrosequencing and high-throughput quantitative PCR. At day 36, bifidobacterial populations were increased in 27 of 30 of GOS subjects (90%), demonstrating a bifidogenic response in vivo. Relative abundance of lactose-fermenting Bifidobacterium, Faecalibacterium, and Lactobacillus were significantly increased in response to GOS. When dairy was introduced into the diet, lactose-fermenting Roseburia species increased from day 36 to day 66. The results indicated a definitive change in the fecal microbiome of lactose-intolerant individuals, increasing the abundance of lactose-metabolizing bacteria that were responsive to dietary adaptation to GOS. This change correlated with clinical outcomes of improved lactose tolerance.

Keywords: GOS; lactose intolerance; microbiome; prebiotic.


Conflict of interest statement

This study was funded by Ritter Pharmaceuticals, Inc., of which A.J.R. is the founder, and by the North Carolina Agriculture Foundation. T.R.K. and D.S. are on the scientific advisory board for Ritter Pharmaceuticals, Inc. and assisted in the design, management, and conduct of the study and in the interpretation of data from the study. The work at the University of North Carolina at Chapel Hill Microbiome Center also was funded in part by Ritter Pharmaceuticals, Inc. and by the North Carolina Agriculture Foundation. Ritter Pharmaceuticals, Inc. was the sole source of highly purified galactooligosaccharide (>95%) GOS that was available for the study. The results of these studies have been scientifically judged and interpreted independently by the authors without bias based on the funding or industrial partners involved.

Figures

Fig. 1.
Fig. 1.
Overall microbiome analysis of individuals fed GOS/dairy. (A) Unique TRFs differentially represented in each time point compared with day 0 for subjects fed GOS (light gray line) versus the placebo/control groups (black line). Peak files for all samples were compressed in silico to identify unique TRFs. The analysis represents only changes in the number of unique TRFs without discriminating between positive or negative changes. (B) Unweighted UniFrac-based PCoA of microbial communities from individuals at day 0 (pretreatment; red dots), day 36 (GOS consumption; yellow dots), and day 66 (GOS halted, dairy consumption encouraged; blue dots). Fecal samples were obtained in triplicate from each subject at three time points (a total of nine samples per individual) were included in this analysis. ANOSIM- and PERMANOVA-generated parameters are indicated in the plot. PC1 and PC2, principal components 1 and 2.
Fig. 2.
Fig. 2.
Comparisons of Shannon diversity (H; number of species and species evenness) (Left) and species richness (S; number of species) (Right) indexes at day 0, day 36, and day 66 in all individuals (A) and in individuals reporting cramping (B). ANOVA analysis and Tukey tests were performed to identify statistically significant differences in relative abundance between time points (P < 0.05). Yes, subject reports cramping; No, subject reports no cramping. Boxes represent 25–75%, and whiskers represent the 1.5 interquartile range. Horizontal lines within boxes represent median values.
Fig. 3.
Fig. 3.
(A) Statistically significant changes to the microbiome profiles of subjects at day 36 when receiving GOS and at day 66 d after dairy consumption was resumed. The y axis shows the relative abundance of taxa impacted by either or both treatments. (B) Cluster analysis of taxa impacted by treatments. Each panel represents the identified trends in log2-transformed relative abundances of bacteria in response to GOS and dairy. Two-dimensional heat maps and trend plots of clusters I, II, III, and IV at the genus level provide visual representations of the direction and intensity of the changes in relative abundances caused by each treatment. *P < 0.05, uncorrected Wilcoxon signed-rank test; **P < 0.05, FDR-corrected Wilcoxon signed-rank test.
Fig. 4.
Fig. 4.
High-throughput qPCR determination of the relative abundance of Actinobacteria (Left), Bifidobacteriaceae (Center), and Bifidobacterium (Right) at day 0 (pretreatment), day 36 (GOS consumption), and day 66 (GOS halted, dairy consumption encouraged). ANOVA analysis and Tukey tests were performed to identify statistically significant differences in relative abundance between time points. *P < 0.05.
Fig. S1.
Fig. S1.
Relative abundance of phyla at day 0 (pretreatment), day 36 (GOS consumption), and day 66 (GOS halted, dairy consumption encouraged). Wilcoxon signed-rank tests with FDR corrections were performed to identify statistically significant differences in relative abundance between time points. *P < 0.05.
Fig. 5.
Fig. 5.
Relative abundance of Bifidobacterium species at day 0 (pretreatment), day 36 (GOS consumption), and day 66 (GOS halted, dairy consumption encouraged) using 16S rRNA-specific (Left) and groEL-specific (Right) primers. 16S rRNA-specific primers did not permit accurate quantification of B. breve at days 0 and 36. ANOVA analysis and Tukey tests were performed to identify statistically significant differences in relative abundance between time points. *P < 0.05.
Fig. S2.
Fig. S2.
Linear fit analysis to assess the correlation between the 16S rRNA and GroEL primers for detection of the same Bifidobacterium species.
Fig. S3.
Fig. S3.
(AD) High-throughput qPCR determination of the relative abundance of Actinobacteria, Bifidobacteriaceae, Bifidobacterium, and Bifidobacterium species in responders at day 0 (pretreatment), day 36 (GOS/RP-G28 consumption), and day 66 (GOS/RP-G28 halted, dairy consumption encouraged). (E) High-throughput qPCR determination of the relative abundance of Actinobacteria, Bifidobacteriaceae, Bifidobacterium, and Bifidobacterium species in nonresponders at day 0 (pretreatment), day 36 (GOS/RP-G28 consumption), and day 66 (GOS/RP-G28 halted, dairy consumption encouraged).
Fig. S3.
Fig. S3.
(AD) High-throughput qPCR determination of the relative abundance of Actinobacteria, Bifidobacteriaceae, Bifidobacterium, and Bifidobacterium species in responders at day 0 (pretreatment), day 36 (GOS/RP-G28 consumption), and day 66 (GOS/RP-G28 halted, dairy consumption encouraged). (E) High-throughput qPCR determination of the relative abundance of Actinobacteria, Bifidobacteriaceae, Bifidobacterium, and Bifidobacterium species in nonresponders at day 0 (pretreatment), day 36 (GOS/RP-G28 consumption), and day 66 (GOS/RP-G28 halted, dairy consumption encouraged).
Fig. 6.
Fig. 6.
Volcano plots showing the −log10 (P value) (x axis) versus estimate values (y axis) of taxa significantly associated with specific symptoms. Estimate values indicate how much the response (log odds of reporting each symptom) increases with a one-unit increase in the predictor (bacteria). A positive estimate value means an increase in the group was associated with an increased likelihood of outcome. A negative estimate value means an increase in the group was associated with a decreased likelihood of outcome. Significant estimate values (FDR-adjusted P value <0.05) are represented in pink (negative) and blue (positive).

References

    1. Itan Y, Jones BL, Ingram CJ, Swallow DM, Thomas MG. A worldwide correlation of lactase persistence phenotype and genotypes. BMC Evol Biol. 2010;10:36. - PMC - PubMed
    1. Scrimshaw NS, Murray EB. The acceptability of milk and milk products in populations with a high prevalence of lactose intolerance. Am J Clin Nutr. 1988;48(4) Suppl:1079–1159. - PubMed
    1. Hertzler SR, Savaiano DA, Levitt MD. Fecal hydrogen production and consumption measurements. Response to daily lactose ingestion by lactose maldigesters. Dig Dis Sci. 1997;42(2):348–353. - PubMed
    1. Savaiano DA, et al. Improving lactose digestion and symptoms of lactose intolerance with a novel galacto-oligosaccharide (RP-G28): A randomized, double-blind clinical trial. Nutr J. 2013;12:160. - PMC - PubMed
    1. Davis LM, Martínez I, Walter J, Goin C, Hutkins RW. Barcoded pyrosequencing reveals that consumption of galactooligosaccharides results in a highly specific bifidogenic response in humans. PLoS One. 2011;6(9):e25200. - PMC - PubMed

Publication types