. 2017 Jan 17;114(3):E416-E425.
doi: 10.1073/pnas.1612383114. Epub 2017 Jan 3.

Tbx20 controls the expression of the KCNH2 gene and of hERG channels

Affiliations

Tbx20 controls the expression of the KCNH2 gene and of hERG channels

Ricardo Caballero et al. Proc Natl Acad Sci U S A. .

Abstract

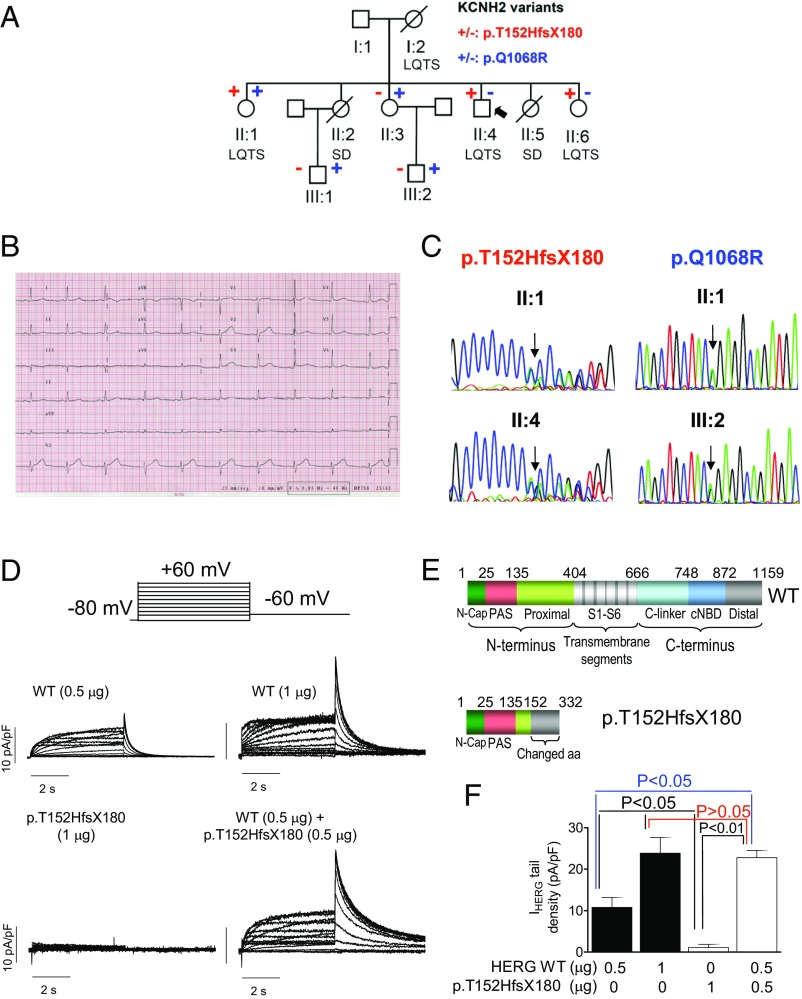
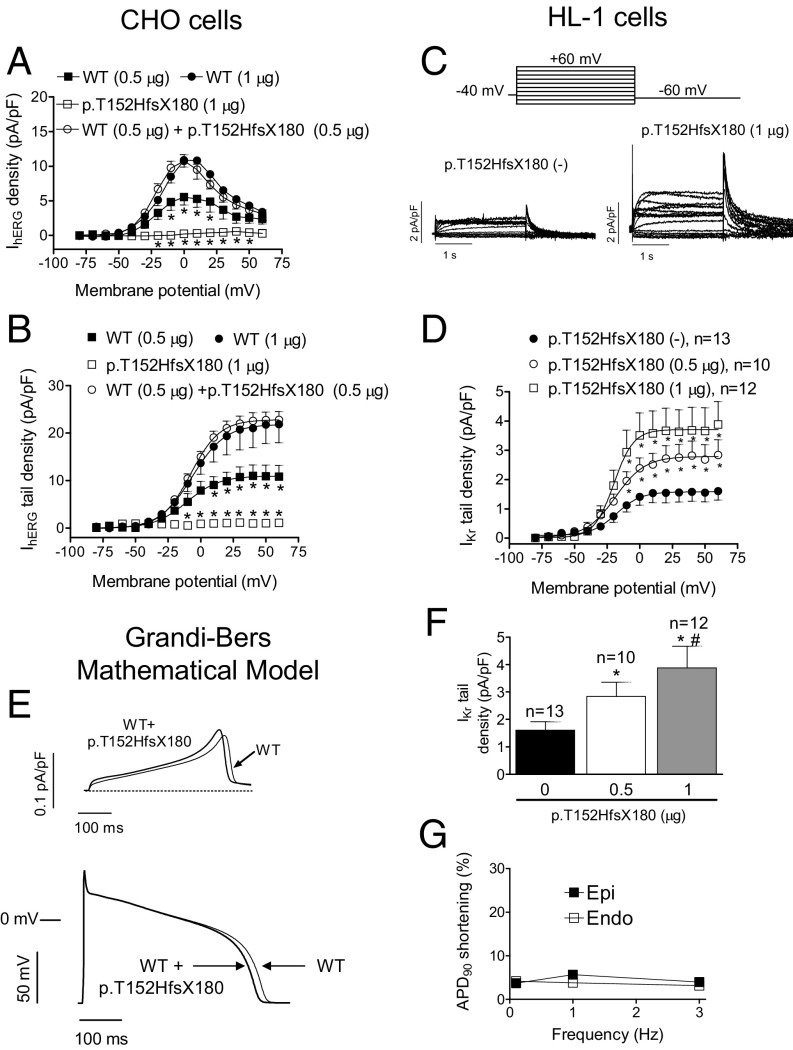
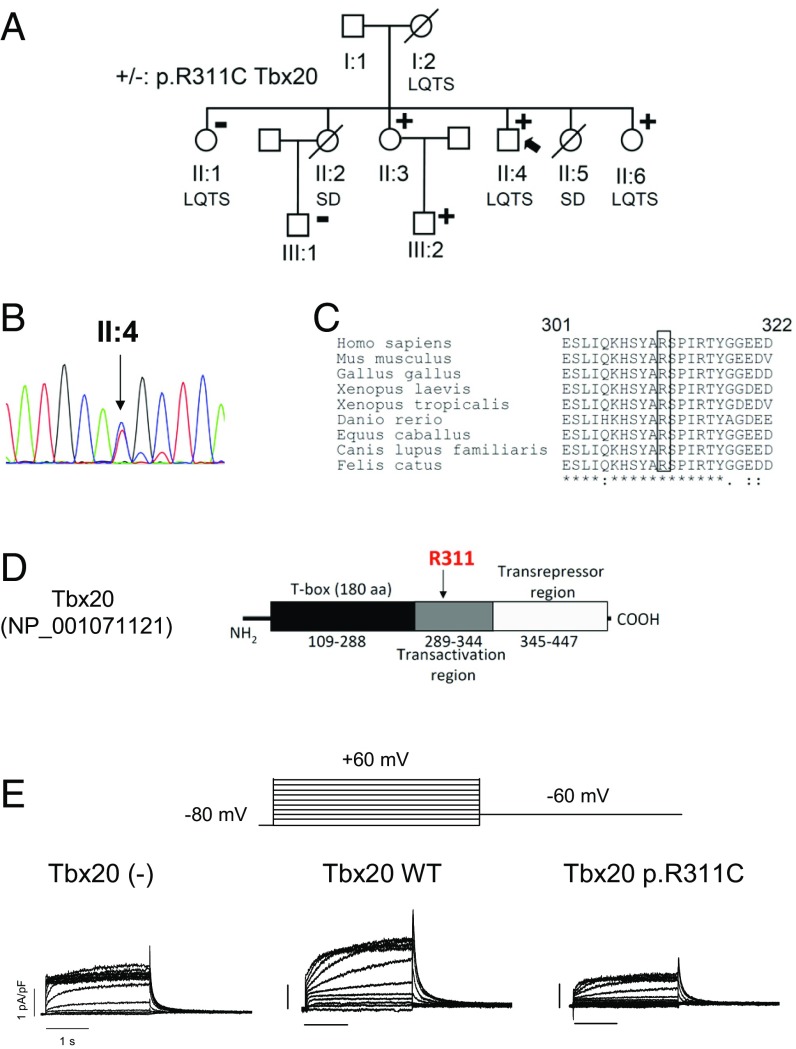
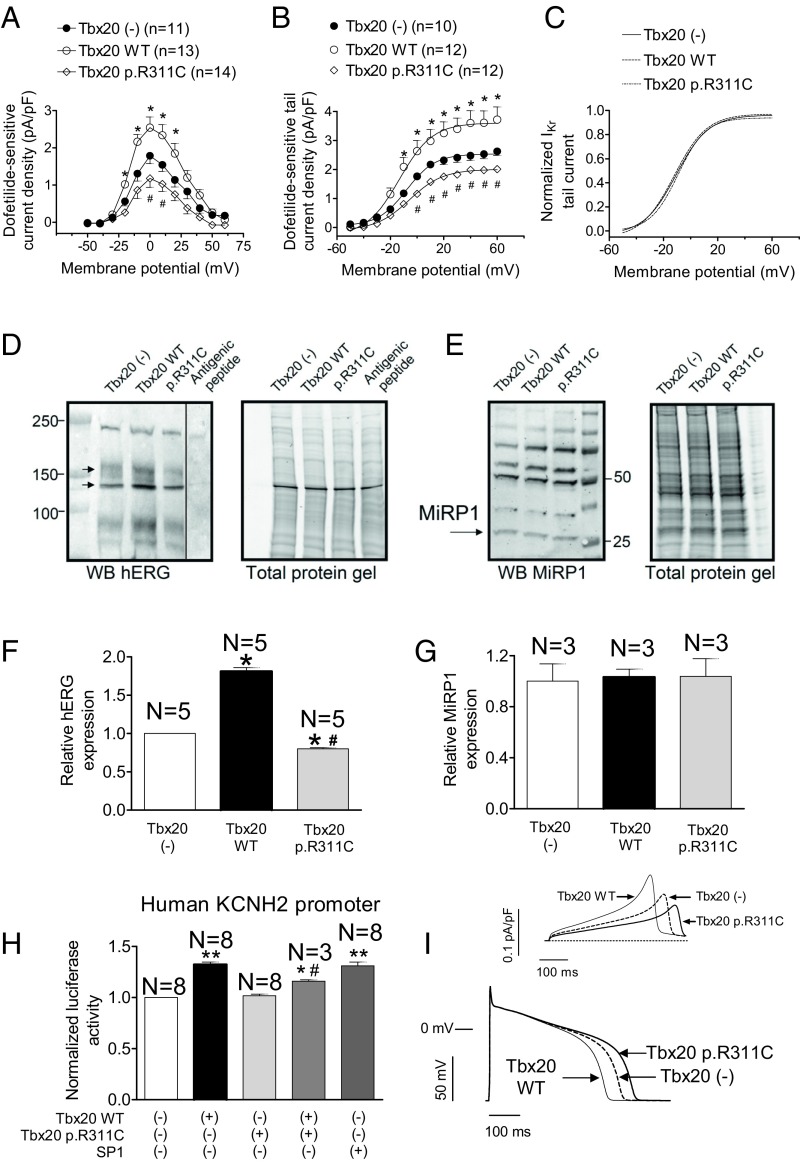
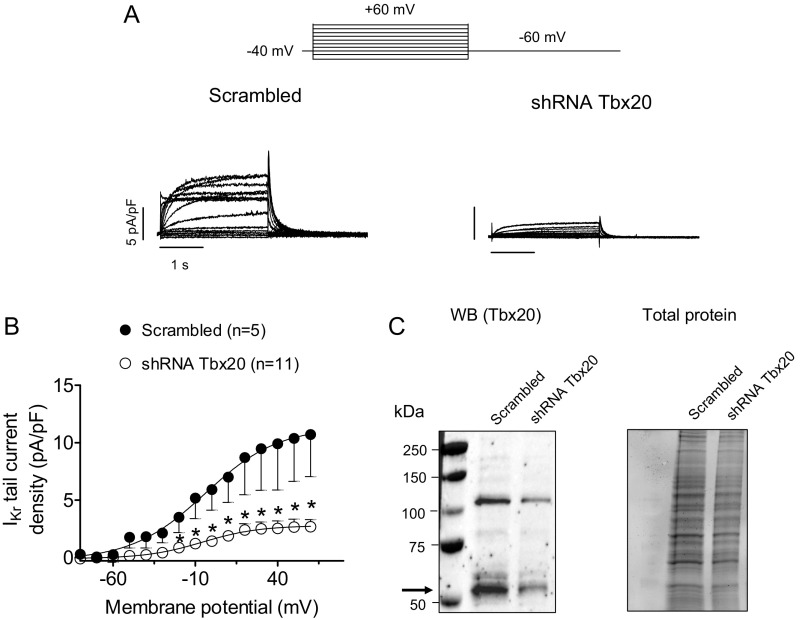
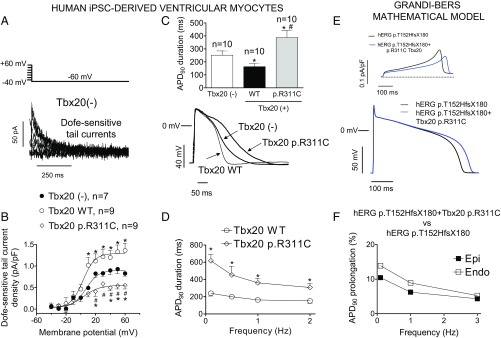
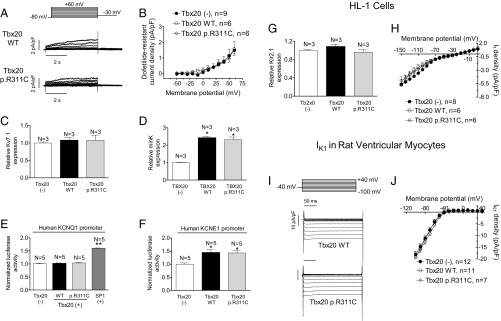
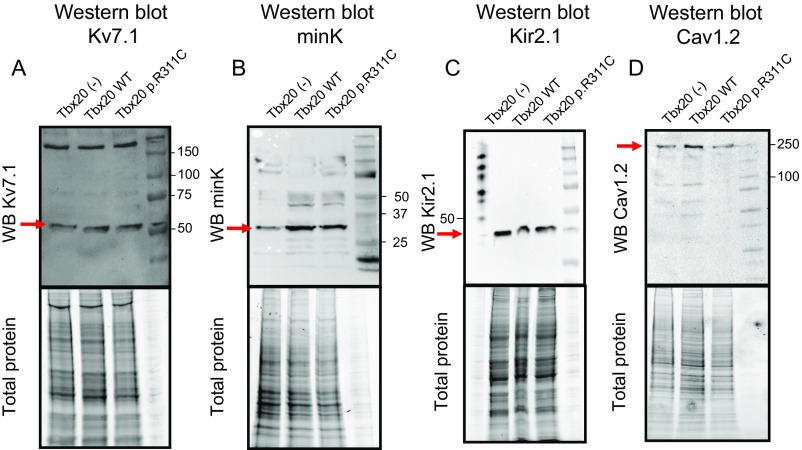
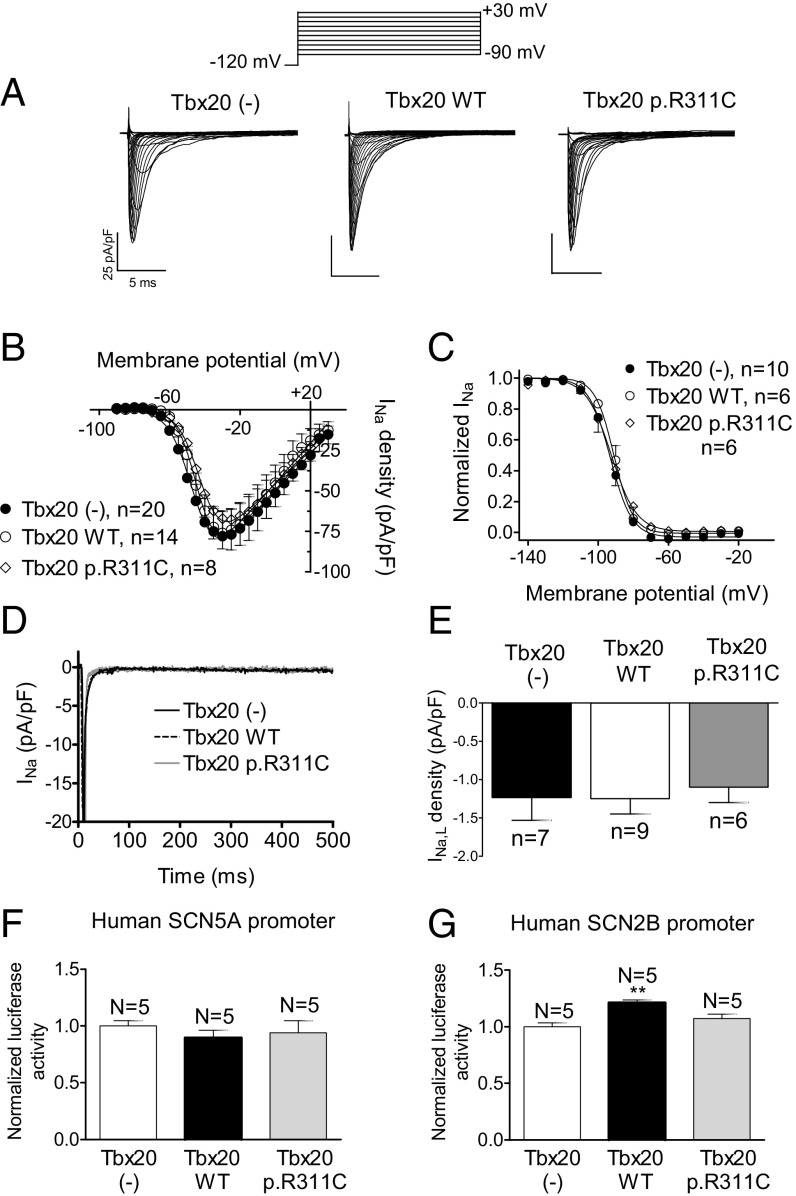
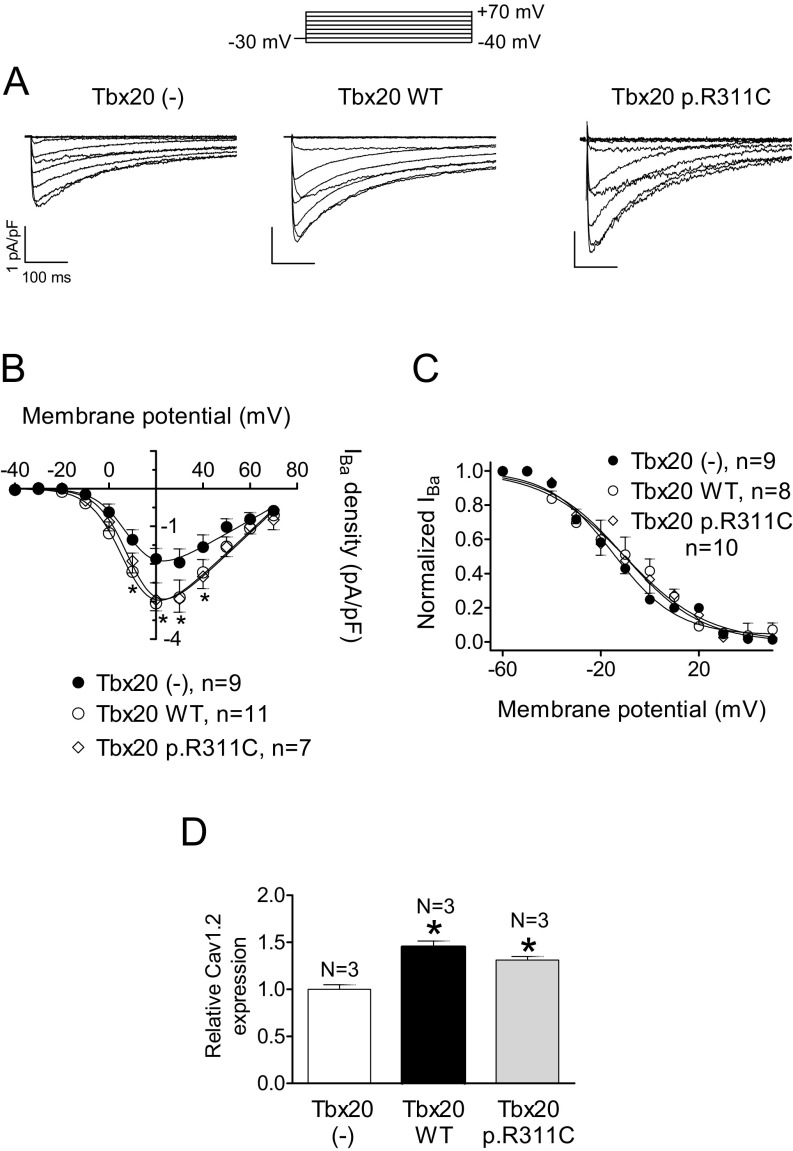
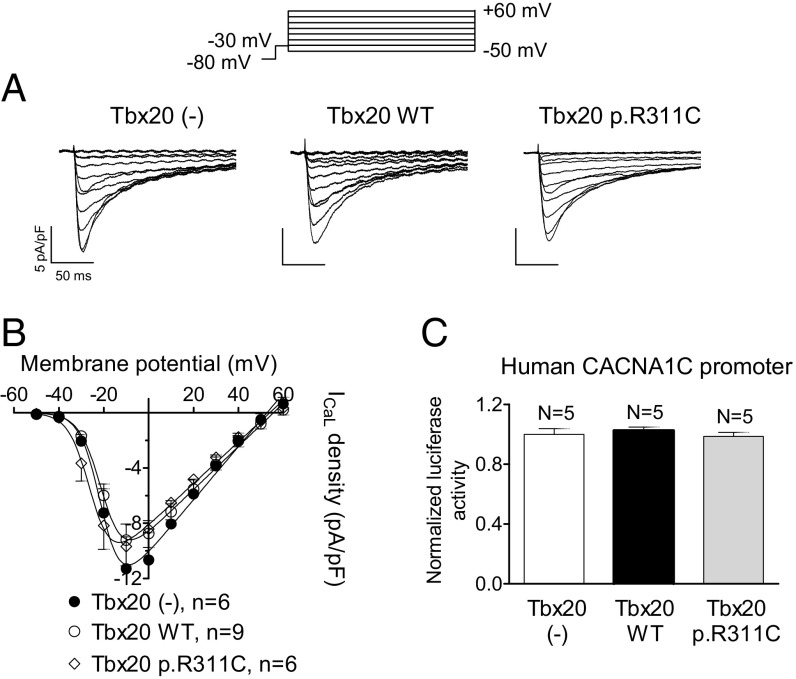
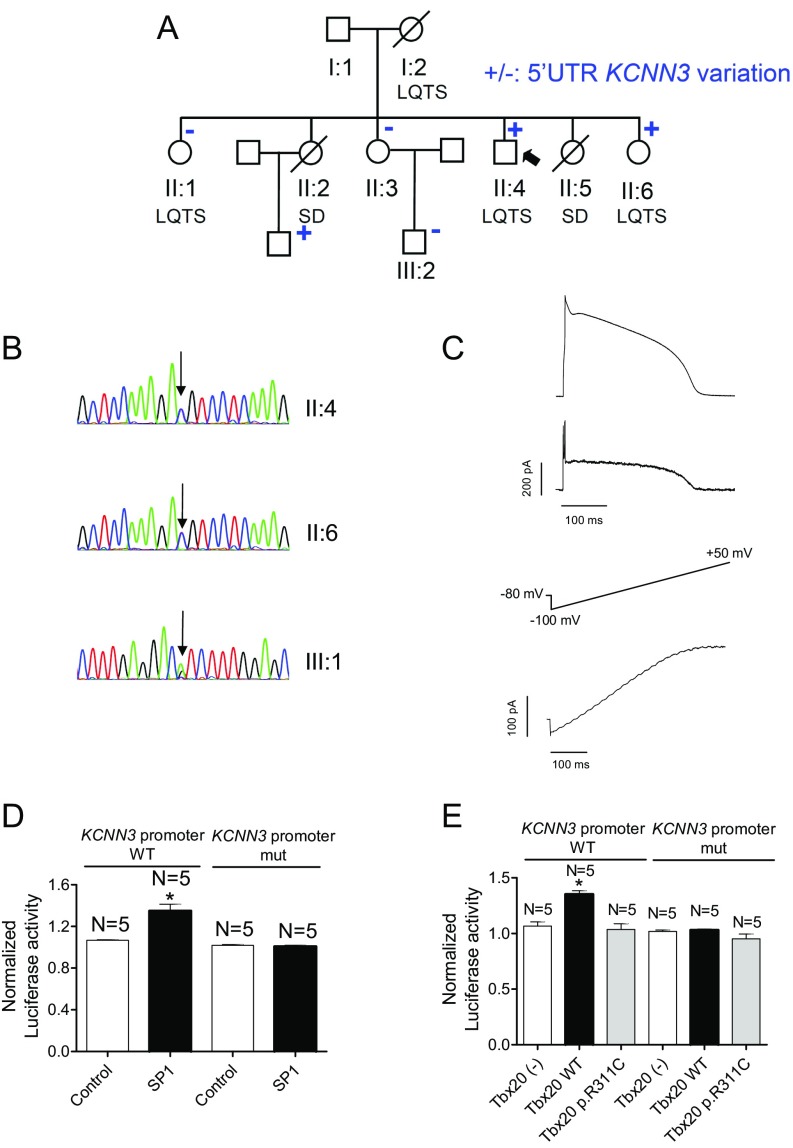
Long QT syndrome (LQTS) exhibits great phenotype variability among family members carrying the same mutation, which can be partially attributed to genetic factors. We functionally analyzed the KCNH2 (encoding for Kv11.1 or hERG channels) and TBX20 (encoding for the transcription factor Tbx20) variants found by next-generation sequencing in two siblings with LQTS in a Spanish family of African ancestry. Affected relatives harbor a heterozygous mutation in KCNH2 that encodes for p.T152HfsX180 Kv11.1 (hERG). This peptide, by itself, failed to generate any current when transfected into Chinese hamster ovary (CHO) cells but, surprisingly, exerted "chaperone-like" effects over native hERG channels in both CHO cells and mouse atrial-derived HL-1 cells. Therefore, heterozygous transfection of native (WT) and p.T152HfsX180 hERG channels generated a current that was indistinguishable from that generated by WT channels alone. Some affected relatives also harbor the p.R311C mutation in Tbx20. In human induced pluripotent stem cell-derived cardiomyocytes (hiPSC-CMs), Tbx20 enhanced human KCNH2 gene expression and hERG currents (IhERG) and shortened action-potential duration (APD). However, Tbx20 did not modify the expression or activity of any other channel involved in ventricular repolarization. Conversely, p.R311C Tbx20 did not increase KCNH2 expression in hiPSC-CMs, which led to decreased IhERG and increased APD. Our results suggest that Tbx20 controls the expression of hERG channels responsible for the rapid component of the delayed rectifier current. On the contrary, p.R311C Tbx20 specifically disables the Tbx20 protranscriptional activity over KCNH2 Therefore, TBX20 can be considered a KCNH2-modifying gene.

Keywords: Tbx20; cardiomyocytes; hERG channels; human induced pluripotent stem cells; long QT syndrome.


Conflict of interest statement

The authors declare no conflict of interest.

Figures

Fig. 1.
Fig. 1.
(A) Pedigree of the studied family. The arrow indicates the proband. Circles and squares represent females and males, respectively. + and – represent subjects with and without the p.T152HfsX180 and p.Q1068R hERG variants, respectively. (B) Twelve-lead electrocardiogram of the proband (paper speed 25 mm/s). (C) DNA sequence chromatograms depicting the heterozygous c.453dupC and the c.3203A>G changes of the KCNH2 gene in different family members. (D) Traces were obtained by applying the protocol (Top) for currents recorded in CHO cells transfected with WT, p.T152HfsX180, and WT/p.T152HfsX180 hERG channels. (E) Schematic representation of the WT and p.T152HfsX180 hERG protein domains. (F) hERG tail current density recorded in CHO cells transfected with WT, p.T152HfsX180, and WT/p.T152HfsX180 hERG channels after pulses to +60 mV (n ≥ 6). Each bar represents mean ± SEM of the data (n 8 cells).
Fig. S1.
Fig. S1.
Twelve lead ECGs of sister II:6 under basal conditions (Top) and after adrenaline bolus injection (Bottom) (paper speed 25 mm/s). Basal ECG shows normal PR (140 ms), QRS (90 ms), sinus bradycardia (48 bpm), and low-voltage wide QT waves (QTc 460 ms). As shown, the adrenaline test was positive, because QTc was prolonged to 618 ms, the amplitude of the T waves exhibited alternance, and polymorphic ventricular extrasystoles were developed. Adrenaline tests were developed in all relatives following the protocol described by Shimizu et al. (33).
Fig. 2.
Fig. 2.
(A and B) Maximum current density (current density–voltage relationships) (A) and tail currents (activation curves) (B) generated by WT and p.T152HfsX180 hERG channels alone or when they are cotransfected in CHO cells, as a function of the membrane potential. In B, solid lines represent the fit of a Boltzmann equation. *P < 0.05 vs. hERG WT (1 µg) (n ≥ 6). (C) IKr traces recorded in IKr-predominant HL-1 cells transfected or not with p.T152HfsX180 hERG. (D) IKr tail current densities recorded in HL-1 cells transfected or not with p.T152HfsX180 hERG. (E) Simulated IKr traces (Top) and APs (Bottom) obtained at 0.1 Hz by using the Grandi–Bers mathematical model of human ventricular endocardial cells by introducing the modifications produced by p.T152HfsX180 hERG on the IKr. (F) IKr tail current densities recorded in HL-1 cells transfected or not with p.T152HfsX180 hERG after pulses to +60 mV. (G) Percentage of APD90 shortening in APs simulated at different frequencies in epicardial and endocardial cells. Points/bars represent mean ± SEM of the data. In D and F, n, number of cells; *P < 0.05 vs. nontransfected cells; #P < 0.05 vs. p.T152HfsX180 0.5 μg transfected cells.
Fig. 3.
Fig. 3.
(A) Pedigree of the studied family. The arrow indicates the proband. Circles and squares represent females and males, respectively. + and – represent subjects with and without the p.R311C Tbx20 mutation, respectively. (B) DNA sequence chromatograms of the proband depicting the heterozygous change (c.931C>T) of the TBX20 gene. (C) Sequence alignment of the region surrounding R311 in Tbx20 in several species. The box highlights the conservation of this residue. (D) Schematic representation of the Tbx20 sequence, indicating the T box, and the transactivation and transrepressor regions. (E) IKr traces recorded in IKr-predominant HL-1 cells transfected or not with either WT or p.R311C Tbx20 by applying the pulse protocol (Top).
Fig. 4.
Fig. 4.
(A and B) Maximum IKr density–voltage relationships (A) and activation curves (B) for currents recorded in IKr-predominant and -intermediate HL-1 cells transfected or not with either WT or p.R311C Tbx20. (C) Normalized activation curves for currents recorded in the three experimental groups. In B and C, solid lines represent the fit of a Boltzmann equation. (D and E) Western blot (WB) images and their corresponding stain-free gels showing hERG (arrows in D) and miRP1 (E) expression in HL-1 cells transfected or not with either WT or p.R311C Tbx20. In D, the sample of the last right lane was run in the same gel but was separated (continuous line) when incubating with the primary antibody together with the antigenic peptide. (F and G) Mean densitometric analysis of hERG (F) and MiRP1 (G) levels normalized to total protein. (H) Normalized luciferase activity in HL-1 cells expressing the pLightSwitch_Prom vector carrying the human KCNH2 promoter cotransfected or not with SP1 and either WT or p.R311C Tbx20. (I) Simulated IKr traces (Top) and APs (Bottom) obtained at 0.1 Hz by using the Grandi–Bers mathematical model of human ventricular endocardial cells by introducing the modifications produced by Tbx20 WT and p.R311C on the IKr. Points/bars represent mean ± SEM of the data. n, number of cells; N, number of dishes. *P < 0.05 vs. Tbx20 (-); #P < 0.05 vs. Tbx20 WT; **P < 0.01 vs. Tbx20 (-).
Fig. S2.
Fig. S2.
(A and B) IKr traces (A) and mean activation curves (B) recorded in IKr-predominant HL-1 cells infected with lentivirus encoding either a negative control (Scrambled) or short hairpin RNA (shRNA) Tbx20 for silencing Tbx20 by applying the pulse protocol (Top). In B, results are expressed as mean ± SEM of n experiments. *P < 0.05 vs. cells infected with scrambled shRNA. (C) Representative immunoblots after detection of Tbx20 (arrow) immunoreactivity and chemiluminescence (Left) in HL-1 cells cultured for 48 h with lentivirus-encoding scrambled or shRNA Tbx20 (17). The corresponding stain-free gel is depicted (Right) to show the total protein. To further confirm the transcriptional effect of Tbx20 on the KCNH2 gene, IKr was recorded in HL-1 cells in which endogenous Tbx20 was silenced with lentiviral constructs containing shRNA for Tbx20 together with GFP (A and B). Control cells were infected with a lentivirus containing a scrambled shRNA and GFP. Western blot analysis demonstrates that 48 h postinfection, Tbx20 expression was decreased by 58% (C). As can be observed in A and B, peak IKr tail density was markedly (by ∼75%) and significantly decreased in Tbx20-silenced cells compared with those cells infected with the scrambled shRNA (n ≥ 5, P < 0.05). However, Tbx20 silencing did not produce any modification in current kinetics or voltage dependence of activation.
Fig. 5.
Fig. 5.
(A) Dofetilide (1 µmol/L)-sensitive (IKr) tail currents obtained by digital subtraction in a noninfected hiPSC-derived cardiomyocytes. (B) IKr density in a hiPSC-derived cardiomyocyte infected or not with either WT or p.R311C Tbx20. Solid lines represent the fit of a Boltzmann equation. (C) Superimposed APs recorded at 1 Hz in three hiPSC-derived cardiomyocytes infected or not with either WT or p.R311C Tbx20. (Top) The APD90 of each experimental group. (D) APD90 at different stimulation frequencies in cells infected with Tbx20 WT or p.R311C. (E) Simulated IKr traces (Top) and APs (Bottom) obtained at 0.1 Hz by using the Grandi–Bers mathematical model of human ventricular endocardial cells by introducing the modifications produced by heterozygous p.T152HfsX180 hERG alone or in combination with p.R311C Tbx20 on the IKr. (F) Percentage of APD90 prolongation in APs simulated at different frequencies in epicardial and endocardial cells. In BD, points/bars represent mean ± SEM of ≥7 experiments in each group. *P < 0.05 vs. Tbx20(-); #P < 0.05 vs. Tbx20 WT.
Fig. 6.
Fig. 6.
(A) Traces of dofetilide-resistant current (IKs) recorded in IKs-predominant HL-1 cells transfected with WT or p.R311C Tbx20 by applying the pulse protocol (Top). (B) Current density–voltage relationships for IKs recorded in HL-1 cells transfected or not with WT or p.R311C Tbx20. (C and D) Mean densitometric analysis of Kv7.1 (C) and minK (D) levels normalized to total protein. (E and F) Normalized luciferase activity in HL-1 cells expressing the pLightSwitch_Prom vector carrying the human KCNQ1 (E) or KCNE1 (F) promoters cotransfected or not with WT or p.R311C Tbx20. (G) Mean densitometric analysis of Kir2.1 levels normalized to total protein. (H) Current density–voltage relationships for If recorded in HL-1 cells transfected or not with WT or p.R311C Tbx20. (I) IK1 traces recorded in two rat myocytes infected with WT and p.R311C Tbx20. (J) Mean current density–voltage curves for IK1 recorded in rat ventricular myocytes infected or not with lentiviral constructs encoding WT and p.R311C Tbx20. Each point/bar represents mean ± SEM of n cells or N dishes of cells in each group. *P < 0.05 vs. Tbx20 (-); **P < 0.01 vs. Tbx20 (-).
Fig. S3.
Fig. S3.
Western blot images and their corresponding total protein gels showing Kv7.1, minK, Kir2.1, and Cav1.2 expression (arrows) in HL-1 cells transfected or not with Tbx20 WT or p.R311C. As depicted in A and C, the presence of any form of Tbx20 did not modify either Kv7.1 or Kir2.1 protein expression compared with untransfected cells. On the other hand, B displays that both WT and p.R311C Tbx20 increased minK expression in HL-1 cells. Finally, D shows that both WT and p.R311C similarly increased Cav1.2 expression in accordance with the increase in the ICaL density observed in the electrophysiological experiments.
Fig. 7.
Fig. 7.
(A) INa traces recorded in HL-1 cells transfected or not with WT or p.R311C Tbx20 by applying the pulse protocol (Top). (B and C) Current density–voltage relationships (B) and steady-state inactivation (C) for INa recorded in the three experimental groups. (D and E) Superimposed INa traces (D) recorded in HL-1 cells transfected or not with WT or p.R311C Tbx20 by applying 500-ms pulses from −120 to −20 mV and bar graph (E) showing the mean INaL recorded at 500 ms. (F and G) Normalized luciferase activity in HL-1 cells expressing the pLightSwitch_Prom vector carrying the human SCN5A (F) or SCN2B (G) promoters cotransfected or not with WT or p.R311C Tbx20. Each point/bar represents the mean ± SEM of n cells or N dishes of cells in each group. **P < 0.01 vs. Tbx20 (-).
Fig. S4.
Fig. S4.
(A) IBa traces recorded in HL-1 cells transfected or not with WT or p.R311C Tbx20 by applying the pulse protocol (Top). (B and C) Current density–voltage relationships (B) and steady-state inactivation (C) for IBa recorded in the three experimental groups. (D) Mean densitometric analysis of Cav1.2 levels normalized to total protein. Each point/bar represents the mean ± SEM of n cells or N dishes of cells in each group. *P < 0.05 vs. Tbx20 (-). In these experiments, ICaL was measured using Ba2+ as a charge carrier (15, 18). WT Tbx20 slightly but significantly increased the IBa density (A and B) (n ≥ 9, P < 0.05). Moreover, p.R311C Tbx20 also increased the IBa density similar to Tbx20 WT (n = 7, P > 0.05 vs. Tbx20 WT). However, neither WT nor mutated Tbx20 affected the voltage dependence of activation or inactivation of the channel (C) (Table S3). Western blot analysis in HL-1 cells (D) (Fig. S3) demonstrated that both WT and p.R311C Tbx20 significantly and similarly increase Cav1.2 expression, consistent with the presence of the Tbx20 binding site in the mouse, but not the human, CACNA1C gene promoter (Table S4).
Fig. 8.
Fig. 8.
(A) ICaL traces recorded in hiPSC-CMs infected or not with WT or p.R311C Tbx20 by applying the pulse protocol (Top). (B) Current density-voltage relationships for ICaL recorded in the three experimental groups. (C) Normalized luciferase activity in HL-1 cells expressing the pLightSwitch_Prom vector carrying the human CACNA1C promoter cotransfected or not with WT or p.R311C Tbx20. Each point/bar represents the mean ± SEM of n cells or N dishes of cells in each group.
Fig. S5.
Fig. S5.
Functional analysis of the c.-66A>G variation of KCNN3. (A) Pedigree of the studied family. The arrow indicates the proband. Circles and squares represent females and males, respectively. + and – represent subjects with and without the 5′ UTR KCNN3 mutation, respectively. (B) DNA sequence chromatograms of the proband (II:4), sister II:6, and nephew III:1 depicting the heterozygous c.-66A>G variation at the 5′ UTR of the KCNN3 gene. (C, Top) Current trace elicited by AP command signals (Upper) as the voltage protocol recorded in CHO cells expressing SK3 channels. (C, Bottom) Current elicited in CHO cells expressing SK3 channels by applying a ramp pulse from ‒100 to +50 mV. (D) Normalized luciferase activity in HL-1 cells expressing the pLightSwitch_Prom luciferase expression reporter vector carrying the human KCNN3 promoter in its WT or mutated form cotransfected with SP1. (E) Normalized luciferase activity in HL-1 cells expressing the pLightSwitch_Prom luciferase expression reporter vector carrying the human KCNN3 promoter in its WT or mutated form, cotransfected with Tbx20(-), Tbx20 WT, or Tbx20 p.R311C. In D and E, bars represent mean ± SEM of five independent batches of cells for each group. In D, *P < 0.05 vs. Control. In E, *P < 0.05 vs. Tbx20 (-). The proband, sister II:6, and nephew III:1 also carry a variation at the 5′ UTR of the KCNN3 gene (NM_001204087.1:c.-66A>G) that encodes the α-subunit of the small-conductance Ca2+-activated K+ channel type 3 (SK3) (19) (A and B). This variation has already been annotated (rs76040784). Luciferase experiments demonstrated that expression of mutated KCNN3 cannot be activated by SP1 or Tbx20 (D), whose binding sites are present in the human gene promoter (Table S4). (E) Tbx20 WT slightly but significantly increased the expression of KCNN3 (n = 5, P < 0.05), whereas p.R311C did not (n = 5, P < 0.05). Moreover, Tbx20, either WT or mutated, did not modify the expression of mutated KCNN3. CHO cells transiently transfected with KCNN3 cDNA were stimulated with pulses, with the morphology of endocardial APs recorded in human ventricular samples (C, Top). Time dependence of the SK3 conductance resembles the AP morphology, because it is almost linear to the voltage at this range of membrane potentials (see current elicited by ramp pulses in C, Bottom). The c.-66A>G variation completely abolished KCNN3 transcription, thus leading to haploinsufficiency. SK3 channels are detected in human ventricles, even though their presence seems to be much more abundant in human atria (31). In fact, treatment of human multicellular ventricular preparations with apamin (a selective SK blocker) does not modify APD (20). If SK3 channels actually participated in ventricular repolarization, the KCNN3 variant would further decrease the ventricular repolarization reserve in the carriers. Additionally, the proband also carries a SNP already described in KCND2 that encodes Kv4.2 channels, which are expressed in the human ventricular myocardium and contribute to the transient outward K current (Ito) (Table S2). However, this SNP is present in a deep intronic region of the gene and is suspected not to affect its expression.

References

    1. Nakano Y, Shimizu W. Genetics of long-QT syndrome. J Hum Genet. 2016;61(1):51–55. - PubMed
    1. Havakuk O, Viskin S. A tale of 2 diseases: The history of long-QT syndrome and Brugada syndrome. J Am Coll Cardiol. 2016;67(1):100–108. - PubMed
    1. Keating MT, Sanguinetti MC. Molecular and cellular mechanisms of cardiac arrhythmias. Cell. 2001;104(4):569–580. - PubMed
    1. Sakabe NJ, et al. Dual transcriptional activator and repressor roles of TBX20 regulate adult cardiac structure and function. Hum Mol Genet. 2012;21(10):2194–2204. - PMC - PubMed
    1. Qian L, et al. Transcription factor neuromancer/TBX20 is required for cardiac function in Drosophila with implications for human heart disease. Proc Natl Acad Sci USA. 2008;105(50):19833–19838. - PMC - PubMed

Publication types

MeSH terms