

A large-scale comparison of cortical thickness and volume methods for measuring Alzheimer's disease severity
- PMID: 28050342
- PMCID: PMC5187496
- DOI: 10.1016/j.nicl.2016.05.017
A large-scale comparison of cortical thickness and volume methods for measuring Alzheimer's disease severity
Abstract
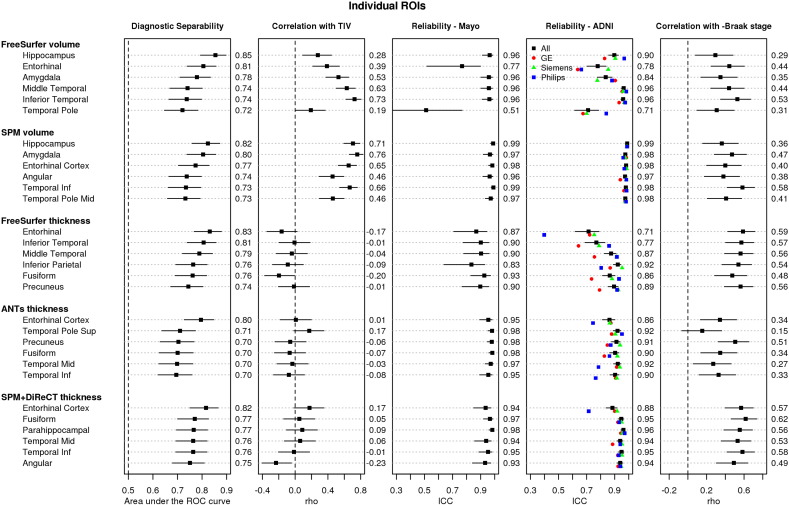
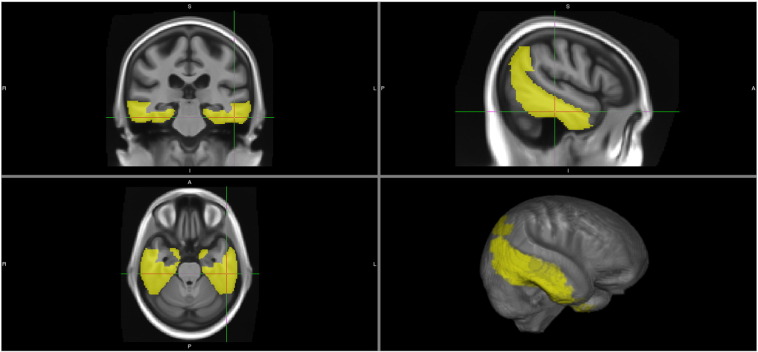
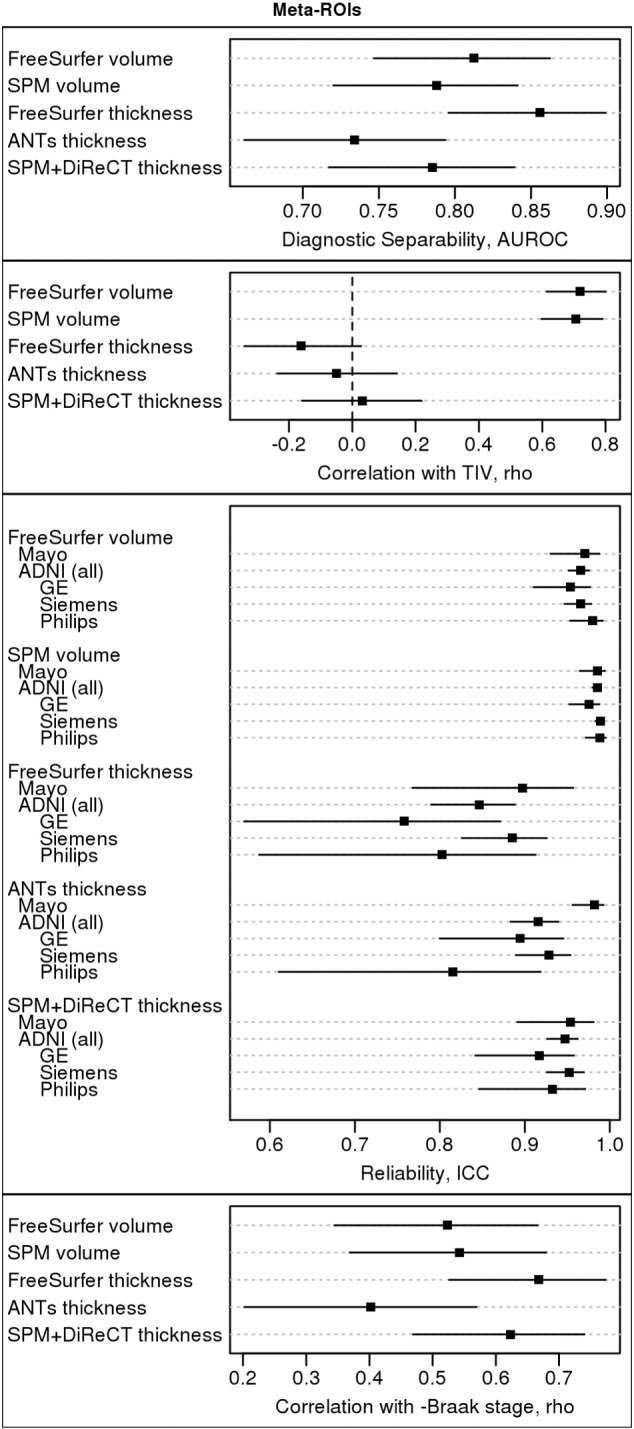
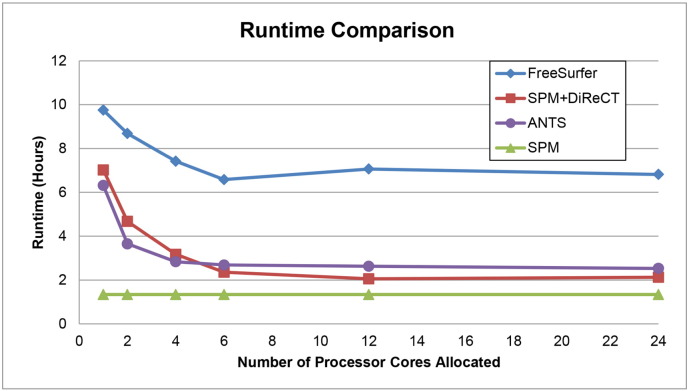
Alzheimer's disease (AD) researchers commonly use MRI as a quantitative measure of disease severity. Historically, hippocampal volume has been favored. Recently, "AD signature" measurements of gray matter (GM) volumes or cortical thicknesses have gained attention. Here, we systematically evaluate multiple thickness- and volume-based candidate-methods side-by-side, built using the popular FreeSurfer, SPM, and ANTs packages, according to the following criteria: (a) ability to separate clinically normal individuals from those with AD; (b) (extent of) correlation with head size, a nuisance covariatel (c) reliability on repeated scans; and (d) correlation with Braak neurofibrillary tangle stage in a group with autopsy. We show that volume- and thickness-based measures generally perform similarly for separating clinically normal from AD populations, and in correlation with Braak neurofibrillary tangle stage at autopsy. Volume-based measures are generally more reliable than thickness measures. As expected, volume measures are highly correlated with head size, while thickness measures are generally not. Because approaches to statistically correcting volumes for head size vary and may be inadequate to deal with this underlying confound, and because our goal is to determine a measure which can be used to examine age and sex effects in a cohort across a large age range, we thus recommend thickness-based measures. Ultimately, based on these criteria and additional practical considerations of run-time and failure rates, we recommend an AD signature measure formed from a composite of thickness measurements in the entorhinal, fusiform, parahippocampal, mid-temporal, inferior-temporal, and angular gyrus ROIs using ANTs with input segmentations from SPM12.
Figures
References
-
- ADNI Home . 2013. [WWW Document] (URL www.adni-info.org (accessed 1.1.15))
-
- Ashburner J. A fast diffeomorphic image registration algorithm. NeuroImage. 2007;38:95–113. - PubMed
-
- Ashburner J., Friston K.J. Unified segmentation. NeuroImage. 2005;26:839–851. - PubMed
Publication types
MeSH terms
Grants and funding
LinkOut - more resources
Full Text Sources
Other Literature Sources
Medical
Research Materials
