. 2017 Jan 4:7:39873.
doi: 10.1038/srep39873.

The metastasis suppressor RARRES3 as an endogenous inhibitor of the immunoproteasome expression in breast cancer cells

Affiliations

The metastasis suppressor RARRES3 as an endogenous inhibitor of the immunoproteasome expression in breast cancer cells

Alison M Anderson et al. Sci Rep. .

Abstract

In breast cancer metastasis, the dynamic continuum involving pro- and anti-inflammatory regulators can become compromised. Over 600 genes have been implicated in metastasis to bone, lung or brain but how these genes might contribute to perturbation of immune function is poorly understood. To gain insight, we adopted a gene co-expression network approach that draws on the functional parallels between naturally occurring bone marrow-derived mesenchymal stem cells (BM-MSCs) and cancer stem cells (CSCs). Our network analyses indicate a key role for metastasis suppressor RARRES3, including potential to regulate the immunoproteasome (IP), a specialized proteasome induced under inflammatory conditions. Knockdown of RARRES3 in near-normal mammary epithelial and breast cancer cell lines increases overall transcript and protein levels of the IP subunits, but not of their constitutively expressed counterparts. RARRES3 mRNA expression is controlled by interferon regulatory factor IRF1, an inducer of the IP, and is sensitive to depletion of the retinoid-related receptor RORA that regulates various physiological processes including immunity through modulation of gene expression. Collectively, these findings identify a novel regulatory role for RARRES3 as an endogenous inhibitor of IP expression, and contribute to our evolving understanding of potential pathways underlying breast cancer driven immune modulation.


Figures

Figure 1
Figure 1
(A) BM-MSC 14-gene clique. A clique is a sub-network in which each gene is connected to all others (PCC > |0.40| adjusted p < 0.05). Cliques can identify genes that are associated with a specific biological function. A clique comprising 14 genes was identified using the largest.clique function available within the R igraph library. (B) A177-gene module comprising genes implicated in breast cancer metastasis to bone, lung and/or brain. The co-expression network was derived from BM-MSCs (PCC > |0.40|, adjusted p-value < 0.05). Node color indicates the site of metastasis the gene has been associated with. Pink = bone, green = lung, orange = brain, mauve = bone and brain, blue = bone and lung, brown = brain and lung and forest green = bone, brain and lung.
Figure 2
Figure 2. Co-expression patterns involving RARRES3 and proteasome subunits.
(A) RARRES3 expression is positively correlated with IP subunits and negatively correlated with CP subunits (PCC indicated on edges, adjusted p-value < 0.05). (B) First neighbors common to both CP and IP subunits consistently show opposing direction of correlation with these genes (PCC > |0.40|, adjusted p-value < 0.05). Solid lines represent positive and broken lines negative, co-expression between linked genes. IP subunits are shown in blue, CP subunits in green and neighbours (and where applicable, common neighbours) are coloured according to common function (orange = chemokine ligands and receptors, turquoise = chromatin modifiers, pink = BM-MSC surface markers, red = nuclear receptors).
Figure 3
Figure 3. RARRES3 and IP subunits show significant positive correlation with proteasome activators and transporter genes.
CP subunits PSMB5 and PSMB6 are negatively correlated (rounded Pearson correlation coefficients are shown on graph squares, p < 0.01), while no significant correlation is observed for PSMB7.
Figure 4
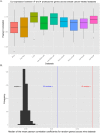
Figure 4. Proteasome subunit co-expression profiles across breast cancer-related datasets.
(A) Pearson correlation coefficient (PCC)s between seven genes: three IP catalytic subunits (PSMB8, PSMB9 and PSMB10), proteasome activators PSME1 and PSME2 and transporter genes TAP1 and TAP2 across cancer cells, and eight datasets representing breast cancer tumour tissue’s. (B) The mean PCC among seven randomly selected genes was calculated for each of nine datasets. This was conducted 1000 times. The distribution of the median mean across datasets centres around zero and is shown on the left of the graph. In comparison, the median mean PCC between CP catalytic subunits, proteasome activators (PSME1 and PSME2), and TAP genes (TAP1 and TAP2) across the nine datasets is 0.31 and indicated by a blue line. The red line indicates the mean PCC of the IP catalytic subunits and proteasome genes (0.65).
Figure 5
Figure 5. Positive correlation between RARRES3 and IP subunits, but not CP subunits, is conserved across tissue datasets obtained from the METABRIC resource.
Interim analysis was conducted using different subtypes and node status networks.
Figure 6
Figure 6
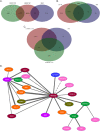
Venn diagrams show the number of correlated gene pairs that are common to the metastatic module (MM) and either the node-positive (NP), node-negative (NN), or both networks representing HER2+ (A), luminal A (B) and triple-negative (TN) (C) breast cancer subtypes. (D) 30 pairs of correlated genes were observed within multiple subtype- and node-specific networks, and link together to form a gene hub. Line thickness indicates the number of networks in which the gene pair were observed (ranging between 1 (thinnest) and 4 (thickest)). Node colour indicates the site of metastasis with which the gene has been associated: pink = bone, green = lung, orange = brain, mauve = bone and brain, blue = bone and lung, brown = brain and lung and forest green = bone, brain and lung.
Figure 7
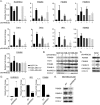
Figure 7. RARRES3 knockdown modulates the catalytic subunits of IP both at mRNA and protein levels in breast cancer cell lines.
(A) mRNA expression of genes involved in IP and CP subunits was determined following RARRES3 knockdown in breast cancer lines. Relative fold change was calculated to scramble siRNA transfected cells after 24 hours post-transfection with 10 nM of pooled siRNA against RARRES3. Error bars represent the standard error of the mean from two independent experiments. (B,C) Immunoblot analysis with indicated antibodies was performed following RARRES3 knockdown after 48 post transfection to determine the expression of representative IP proteins. COX-IV served as a loading control. (D) mRNA expression of IRF1 and PSMB8 following forced expression of RARRES3 in MDA-MB-231LM2 cell line and (E) corresponding immunoblot analysis of PSMB6, 8 and 10. COX-IV served as a loading control.
Figure 8
Figure 8. RARRES3 modulates the catalytic subunits of IP through IRF1 induction.
(A) mRNA expression of genes involved in IP subunits was determined following single and combined RARRES3 and IRF1 knockdown in MCF10A cell line. Relative fold change was calculated to scramble siRNA transfected cells after 24 hours post-transfection with 10 nM of pooled siRNA against RARRES3 and IRF1. Error bars represent the standard error of the mean from two independent experiments. (B) Immunoblot analysis with indicated antibodies was performed following single and combined RARRES3 and IRF1 knockdown. (C,E) Immunoblot analysis with indicated antibodies was performed following RARRES3 or RORA knockdown after 48 post-transfection to determine the expression of representative IP proteins in both MCF10A and MDA-MB-361 respectively. COX-IV served as a loading control. (D) mRNA expression of RORA using two independent siRNAs to confirm the extent of depletion.

Similar articles

Cited by

References

    1. Bottoni P., Isgro M. A. & Scatena R. The epithelial-mesenchymal transition in cancer: a potential critical topic for translational proteomic research. Expert Review of Proteomics 13, 115–133, doi: 10.1586/14789450.2016.1112742 (2016). - DOI - PubMed
    1. Crusz S. M. & Balkwill F. R. Inflammation and cancer: advances and new agents. Nature Reviews Clinical Oncology 12, 584–596, doi: 10.1038/nrclinonc.2015.105 (2015). - DOI - PubMed
    1. Gilroy D. & De Maeyer R. New insights into the resolution of inflammation. Seminars in Immunology 27, 161–168, doi: 10.1016/j.smim.2015.05.003 (2015). - DOI - PubMed
    1. Vlashi E. & Pajonk F. Cancer stem cells, cancer cell plasticity and radiation therapy. Seminars in Cancer Biology 31, 28–35, doi: 10.1016/j.semcancer.2014.07.001 (2015). - DOI - PMC - PubMed
    1. Liu S. L. et al.. Breast Cancer Stem Cells Transition between Epithelial and Mesenchymal States Reflective of their Normal Counterparts. Stem Cell Reports 2, 78–91, doi: 10.1016/j.stemcr.2013.11.009 (2014). - DOI - PMC - PubMed

Publication types

MeSH terms

Substances

LinkOut - more resources