

H2O2-Responsive Vesicles Integrated with Transcutaneous Patches for Glucose-Mediated Insulin Delivery
- PMID: 28051306
- PMCID: PMC5568789
- DOI: 10.1021/acsnano.6b06892
H2O2-Responsive Vesicles Integrated with Transcutaneous Patches for Glucose-Mediated Insulin Delivery
Abstract
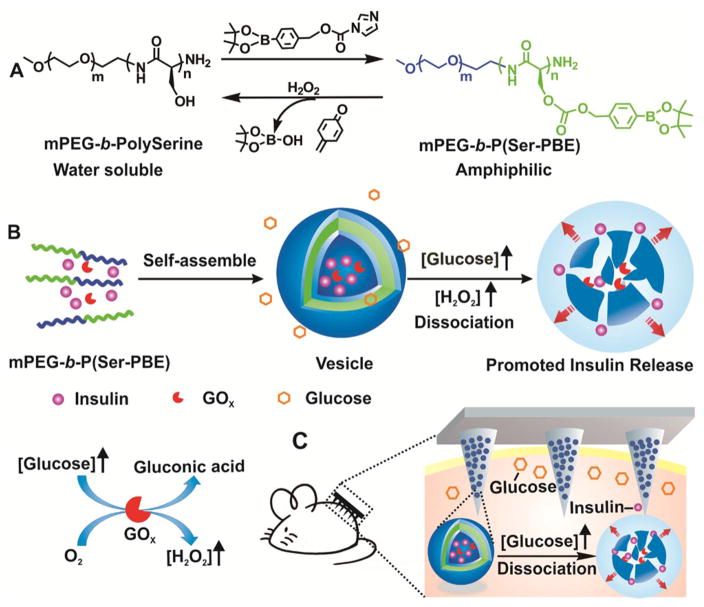
A self-regulated "smart" insulin administration system would be highly desirable for diabetes management. Here, a glucose-responsive insulin delivery device, which integrates H2O2-responsive polymeric vesicles (PVs) with a transcutaneous microneedle-array patch was prepared to achieve a fast response, excellent biocompatibility, and painless administration. The PVs are self-assembled from block copolymer incorporated with polyethylene glycol (PEG) and phenylboronic ester (PBE)-conjugated polyserine (designated mPEG-b-P(Ser-PBE)) and loaded with glucose oxidase (GOx) and insulin. The polymeric vesicles function as both moieties of the glucose sensing element (GOx) and the insulin release actuator to provide basal insulin release as well as promote insulin release in response to hyperglycemic states. In the current study, insulin release responds quickly to elevated glucose and its kinetics can be modulated by adjusting the concentration of GOx loaded into the microneedles. In vivo testing indicates that a single patch can regulate glucose levels effectively with reduced risk of hypoglycemia.
Keywords: diabetes; drug delivery; glucose-responsive; insulin; polymersome; vesicles.
Conflict of interest statement
The authors declare no competing financial interest.
Figures
Similar articles
-
Glucose- and H2O2-Responsive Polymeric Vesicles Integrated with Microneedle Patches for Glucose-Sensitive Transcutaneous Delivery of Insulin in Diabetic Rats.ACS Appl Mater Interfaces. 2018 Jun 13;10(23):20014-20024. doi: 10.1021/acsami.8b04484. Epub 2018 May 31. ACS Appl Mater Interfaces. 2018. PMID: 29787231
-
Microneedle-array patches loaded with hypoxia-sensitive vesicles provide fast glucose-responsive insulin delivery.Proc Natl Acad Sci U S A. 2015 Jul 7;112(27):8260-5. doi: 10.1073/pnas.1505405112. Epub 2015 Jun 22. Proc Natl Acad Sci U S A. 2015. PMID: 26100900 Free PMC article.
-
Hypoxia and H2O2 Dual-Sensitive Vesicles for Enhanced Glucose-Responsive Insulin Delivery.Nano Lett. 2017 Feb 8;17(2):733-739. doi: 10.1021/acs.nanolett.6b03848. Epub 2017 Jan 12. Nano Lett. 2017. PMID: 28079384
-
Glucose-Responsive Microneedle Patches for Diabetes Treatment.J Diabetes Sci Technol. 2019 Jan;13(1):41-48. doi: 10.1177/1932296818778607. Epub 2018 May 31. J Diabetes Sci Technol. 2019. PMID: 29848105 Free PMC article. Review.
-
Responsive materials for self-regulated insulin delivery.Macromol Biosci. 2013 Nov;13(11):1464-77. doi: 10.1002/mabi.201300120. Epub 2013 Jul 9. Macromol Biosci. 2013. PMID: 23839986 Review.
Cited by
-
Boronates as hydrogen peroxide-reactive warheads in the design of detection probes, prodrugs, and nanomedicines used in tumors and other diseases.Drug Deliv Transl Res. 2023 May;13(5):1305-1321. doi: 10.1007/s13346-022-01248-w. Epub 2022 Oct 18. Drug Deliv Transl Res. 2023. PMID: 36258159 Review.
-
Microneedle-based interstitial fluid extraction for drug analysis: Advances, challenges, and prospects.J Pharm Anal. 2023 Feb;13(2):111-126. doi: 10.1016/j.jpha.2022.12.004. Epub 2023 Jan 6. J Pharm Anal. 2023. PMID: 36908860 Free PMC article. Review.
-
Glucose Oxidase-Based Glucose-Sensitive Drug Delivery for Diabetes Treatment.Polymers (Basel). 2017 Jun 29;9(7):255. doi: 10.3390/polym9070255. Polymers (Basel). 2017. PMID: 30970930 Free PMC article. Review.
-
Persistent prolate polymersomes for enhanced co-delivery of hydrophilic and hydrophobic drugs.Nanotechnology. 2020 Apr 24;31(17):175103. doi: 10.1088/1361-6528/ab6bf1. Epub 2020 Jan 15. Nanotechnology. 2020. PMID: 31940601 Free PMC article.
-
Recent advances in microneedles-mediated transdermal delivery of protein and peptide drugs.Acta Pharm Sin B. 2021 Aug;11(8):2326-2343. doi: 10.1016/j.apsb.2021.03.003. Epub 2021 Mar 10. Acta Pharm Sin B. 2021. PMID: 34522590 Free PMC article. Review.
References
-
- Stumvoll M, Goldstein BJ, van Haeften TW. Type 2 Diabetes: Principles of Athogenesis and Therapy. Lancet. 2005;365:1333–1346. - PubMed
-
- Mo R, Jiang T, Di J, Tai W, Gu Z. Emerging Micro- and Nanotechnology Based Synthetic Approaches for Insulin Delivery. Chem Soc Rev. 2014;43:3595–3629. - PubMed
-
- Shaw JE, Sicree RA, Zimmet PZ. Global Estimates of the Prevalence of Diabetes for 2010 and 2030. Diabetes Res Clin Pract. 2010;87:4–14. - PubMed
-
- Wild S, Roglic G, Green A, Sicree R, King H. Global Prevalence of Diabetes Estimates for the Year 2000 and Projections for 2030. Diabetes Care. 2004;27:1047–1053. - PubMed
-
- Raskin P, Allen E, Hollander P, Lewin A, Gabbay RA, Hu P, Bode B, Garber A. Initiating Insulin Therapy in Type 2 Diabetes A comparison of Biphasic and Basal Insulin Analogs. Diabetes Care. 2005;28:260–265. - PubMed
Publication types
MeSH terms
Substances
Grants and funding
LinkOut - more resources
Full Text Sources
Other Literature Sources
Medical
Research Materials
