

Characterizing Teamwork in Cardiovascular Care Outcomes: A Network Analytics Approach
- PMID: 28051772
- PMCID: PMC5217475
- DOI: 10.1161/CIRCOUTCOMES.116.003041
Characterizing Teamwork in Cardiovascular Care Outcomes: A Network Analytics Approach
Abstract
Background: The nature of teamwork in healthcare is complex and interdisciplinary, and provider collaboration based on shared patient encounters is crucial to its success. Characterizing the intensity of working relationships with risk-adjusted patient outcomes supplies insight into provider interactions in a hospital environment.
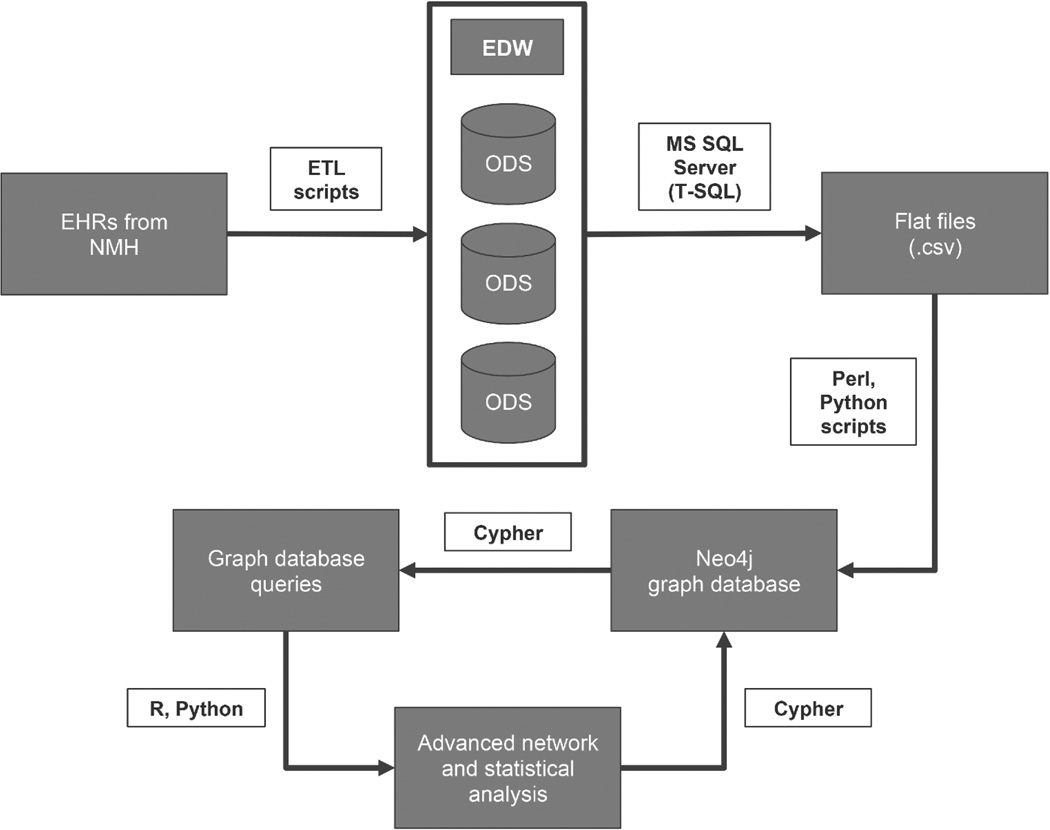
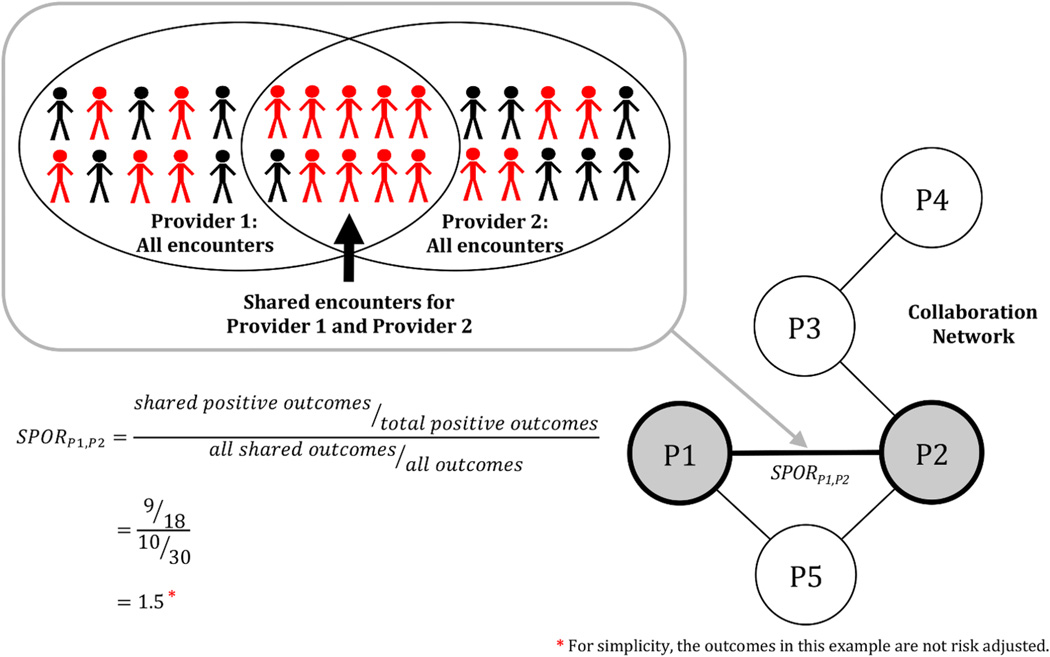
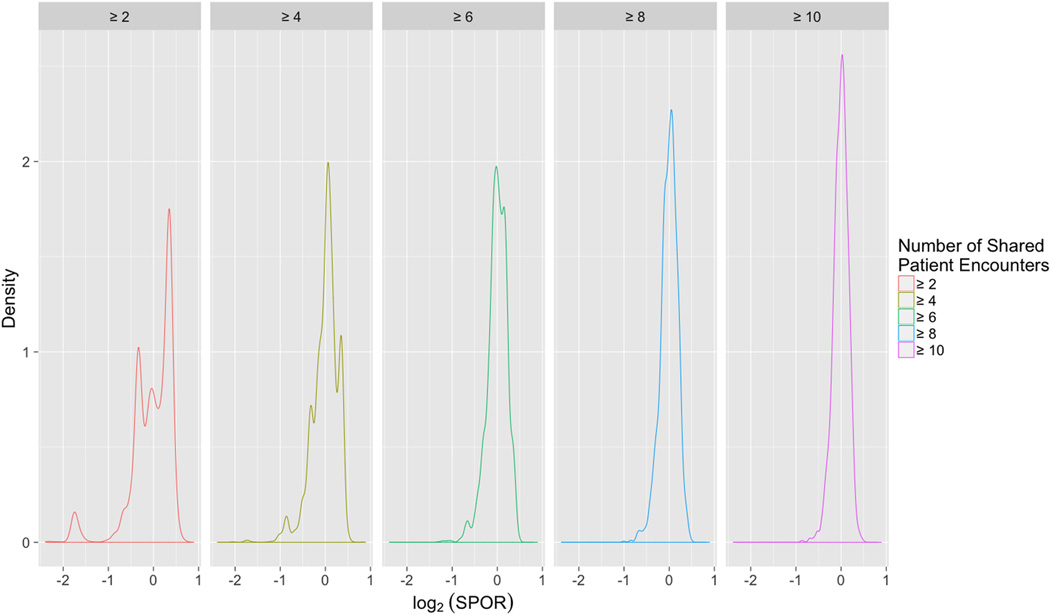
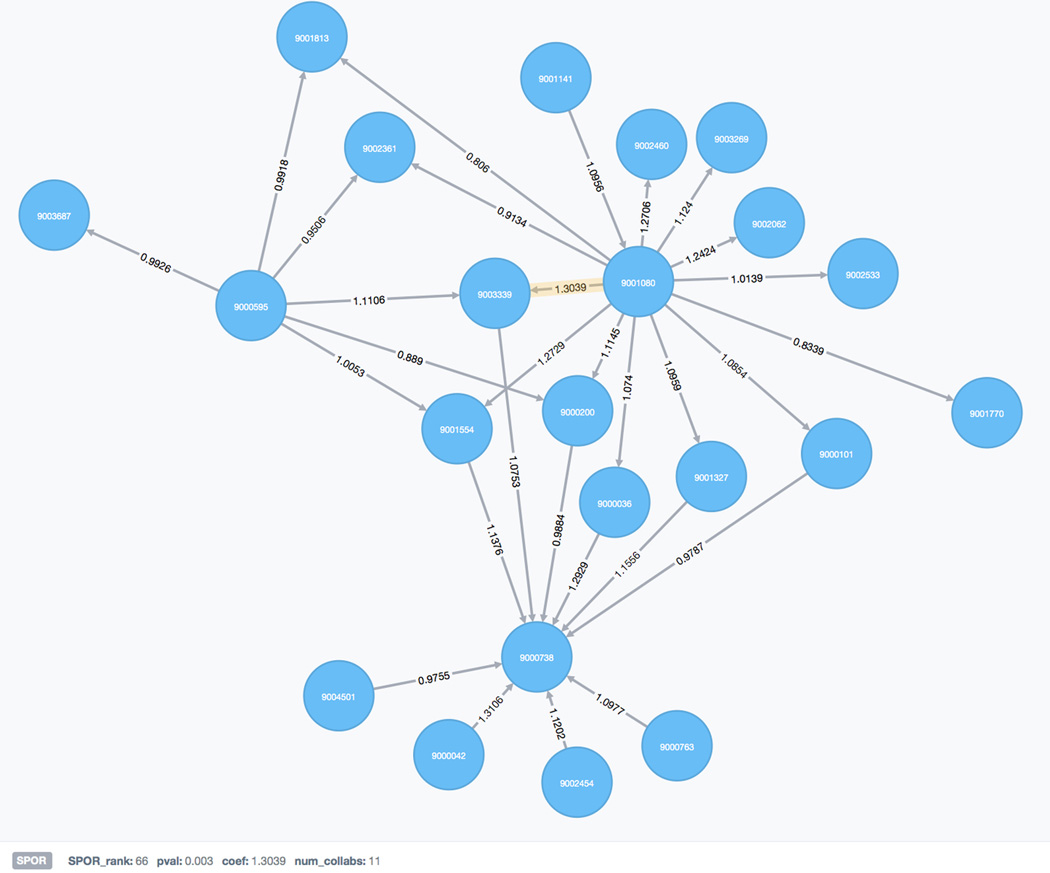
Methods and results: We extracted 4 years of patient, provider, and activity data for encounters in an inpatient cardiology unit from Northwestern Medicine's Enterprise Data Warehouse. We then created a provider-patient network to identify healthcare providers who jointly participated in patient encounters and calculated satisfaction rates for provider-provider pairs. We demonstrated the application of a novel parameter, the shared positive outcome ratio, a measure that assesses the strength of a patient-sharing relationship between 2 providers based on risk-adjusted encounter outcomes. We compared an observed collaboration network of 334 providers and 3453 relationships to 1000 networks with shared positive outcome ratio scores based on randomized outcomes and found 188 collaborative relationships between pairs of providers that showed significantly higher than expected patient satisfaction ratings. A group of 22 providers performed exceptionally in terms of patient satisfaction. Our results indicate high variability in collaboration scores across the network and highlight our ability to identify relationships with both higher and lower than expected scores across a set of shared patient encounters.
Conclusions: Satisfaction rates seem to vary across different teams of providers. Team collaboration can be quantified using a composite measure of collaboration across provider pairs. Tracking provider pair outcomes over a sufficient set of shared encounters may inform quality improvement strategies such as optimizing team staffing, identifying characteristics and practices of high-performing teams, developing evidence-based team guidelines, and redesigning inpatient care processes.
Keywords: cardiology; data mining; inpatients; patient satisfaction; quality improvement; statistical model.
© 2016 American Heart Association, Inc.
Conflict of interest statement
Disclosures: None.
Figures
References
-
- Centers for Medicare & Medicaid Services. Readmissions Reduction Program. [Accessed August, 2015]; http://www.cms.gov/Medicare/Medicare-Fee-for-Service-Payment/AcuteInpati....
-
- Care Coordination Measures Atlas Update. Agency for Healthcare Research and Quality (AHRQ) [Accessed August, 2014];2014 Jun; http://www.ahrq.gov/professionals/prevention-chronic-care/improve/coordi....
-
- Benham-Hutchins MM, Effken JA. Multi-professional patterns and methods of communication during patient handoffs. Int J Med Inform. 2010;79:252–267. - PubMed
MeSH terms
Grants and funding
LinkOut - more resources
Full Text Sources
Other Literature Sources
