

TLR-activated plasmacytoid dendritic cells inhibit breast cancer cell growth in vitro and in vivo
- PMID: 28052019
- PMCID: PMC5355297
- DOI: 10.18632/oncotarget.14315
TLR-activated plasmacytoid dendritic cells inhibit breast cancer cell growth in vitro and in vivo
Abstract
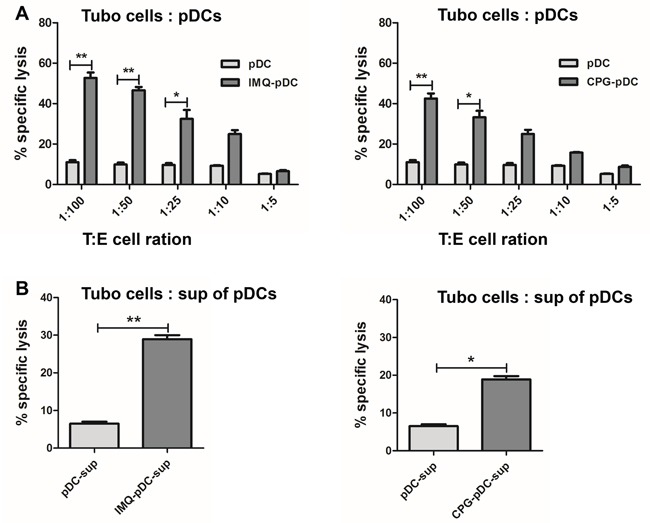
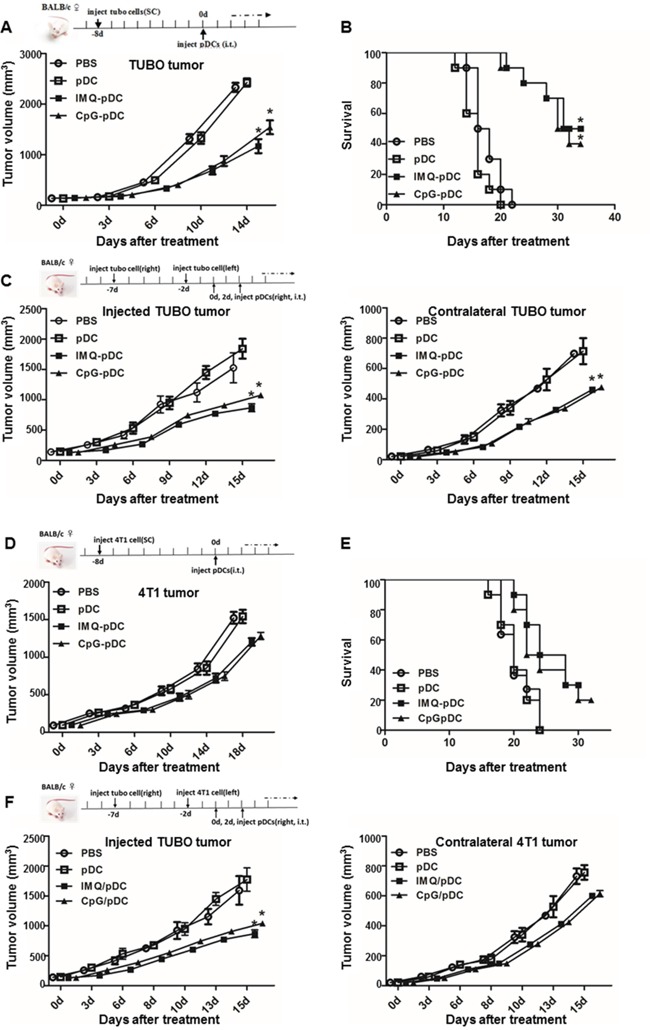
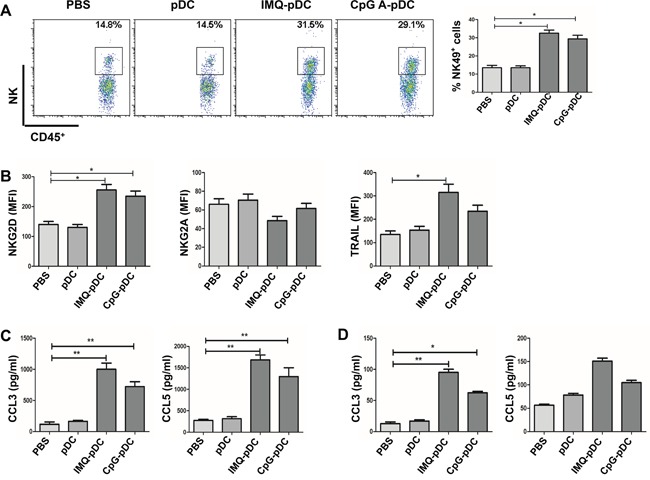
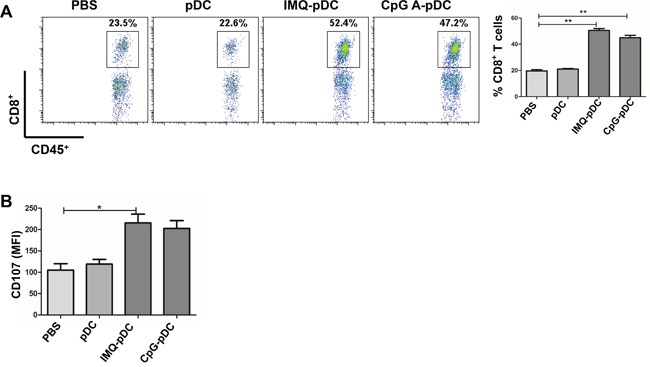
Plasmacytoid dendritic cells (pDCs) are a unique subset of naturally occurring dendritic cells, which triggers the production of large amounts of type I interferons (IFNs) after viral infections through Toll-like receptor (TLR) 7 and TLR9. Recent studies have demonstrated that the activation of pDCs kills melanoma cells. However, the role of activated pDCs in breast cancer remains to be determined. In the present study, we generated mouse models of breast cancer and demonstrated that activated pDCs can directly kill breast tumor cells through TRAIL and Granzyme B. Furthermore, we established that pDCs initiate the sequential activation of NK cells and CD8+ T cells, and ultimately inhibit breast tumor growth. Understanding the role of activated pDCs in breast cancer may help to develop new strategies for manipulating the function of pDCs and induce anti-tumor immunity in breast cancer.
Keywords: CpG; Imiquimod; Toll-like receptor; breast cancer; plasmacytoid dendritic cells.
Conflict of interest statement
The authors declare no conflicts of interest.
Figures


Similar articles
-
TRAIL(+) human plasmacytoid dendritic cells kill tumor cells in vitro: mechanisms of imiquimod- and IFN-α-mediated antitumor reactivity.J Immunol. 2012 Feb 15;188(4):1583-91. doi: 10.4049/jimmunol.1102437. Epub 2012 Jan 9. J Immunol. 2012. PMID: 22231699
-
pDC Activation by TLR7/8 Ligand CL097 Compared to TLR7 Ligand IMQ or TLR9 Ligand CpG.J Immunol Res. 2019 Apr 9;2019:1749803. doi: 10.1155/2019/1749803. eCollection 2019. J Immunol Res. 2019. PMID: 31093508 Free PMC article.
-
TRAIL-mediated killing of acute lymphoblastic leukemia by plasmacytoid dendritic cell-activated natural killer cells.Oncotarget. 2015 Oct 6;6(30):29440-55. doi: 10.18632/oncotarget.4984. Oncotarget. 2015. PMID: 26320191 Free PMC article.
-
Plasmacytoid dendritic cell role in cutaneous malignancies.J Dermatol Sci. 2016 Jul;83(1):3-9. doi: 10.1016/j.jdermsci.2016.05.008. Epub 2016 May 13. J Dermatol Sci. 2016. PMID: 27236509 Review.
-
Impaired Toll-like receptor 7 and 9 signaling: from chronic viral infections to cancer.Trends Immunol. 2010 Oct;31(10):391-7. doi: 10.1016/j.it.2010.07.004. Epub 2010 Sep 9. Trends Immunol. 2010. PMID: 20832362 Review.
Cited by
-
Human Plasmacytoid Dendritic Cells and Cutaneous Melanoma.Cells. 2020 Feb 11;9(2):417. doi: 10.3390/cells9020417. Cells. 2020. PMID: 32054102 Free PMC article. Review.
-
Correlation Between Immune Lymphoid Cells and Plasmacytoid Dendritic Cells in Human Colon Cancer.Front Immunol. 2021 Feb 23;12:601611. doi: 10.3389/fimmu.2021.601611. eCollection 2021. Front Immunol. 2021. PMID: 33708200 Free PMC article.
-
Recent advances in understanding dendritic cell development, classification, and phenotype.F1000Res. 2018 Sep 26;7:F1000 Faculty Rev-1558. doi: 10.12688/f1000research.14793.1. eCollection 2018. F1000Res. 2018. PMID: 30345015 Free PMC article. Review.
-
Therapeutic Inducers of Natural Killer cell Killing (ThINKK): preclinical assessment of safety and efficacy in allogeneic hematopoietic stem cell transplant settings.J Immunother Cancer. 2024 May 15;12(5):e008435. doi: 10.1136/jitc-2023-008435. J Immunother Cancer. 2024. PMID: 38754915 Free PMC article.
-
Transcriptome and proteome profiling reveals stress-induced expression signatures of imiquimod-treated Tasmanian devil facial tumor disease (DFTD) cells.Oncotarget. 2018 Mar 23;9(22):15895-15914. doi: 10.18632/oncotarget.24634. eCollection 2018 Mar 23. Oncotarget. 2018. PMID: 29662615 Free PMC article.
References
-
- Guermonprez P, Valladeau J, Zitvogel L, Thery C, Amigorena S. Antigen presentation and T cell stimulation by dendritic cells. Annu Rev Immunol. 2002;20:621–667. - PubMed
-
- Liu YJ. IPC: professional type 1 interferon-producing cells and plasmacytoid dendritic cell precursors. Annu Rev Immunol. 2005;23:275–306. - PubMed
MeSH terms
Substances
LinkOut - more resources
Full Text Sources
Other Literature Sources
Research Materials
