. 2017 Jan 12;541(7636):233-236.
doi: 10.1038/nature20792. Epub 2017 Jan 4.

Genome-wide in vivo screen identifies novel host regulators of metastatic colonization

Affiliations

Genome-wide in vivo screen identifies novel host regulators of metastatic colonization

Louise van der Weyden et al. Nature. .

Abstract

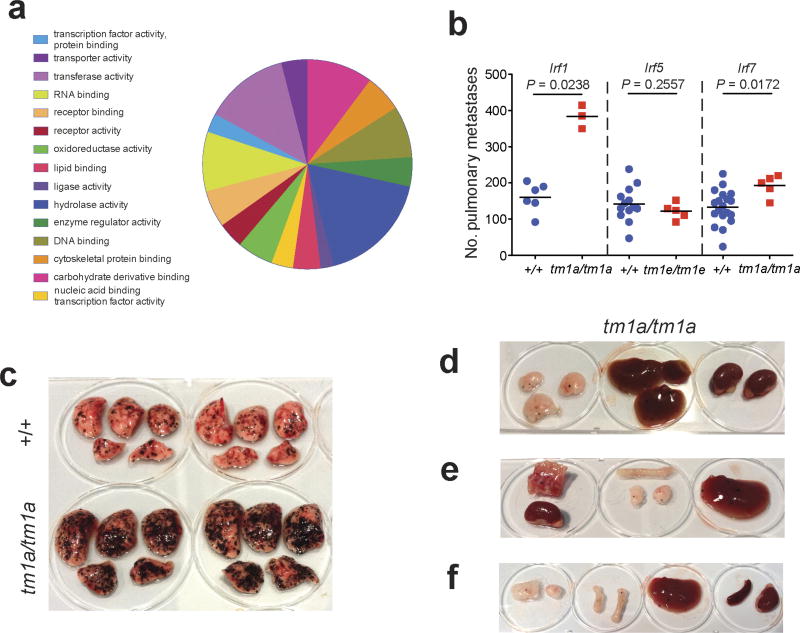
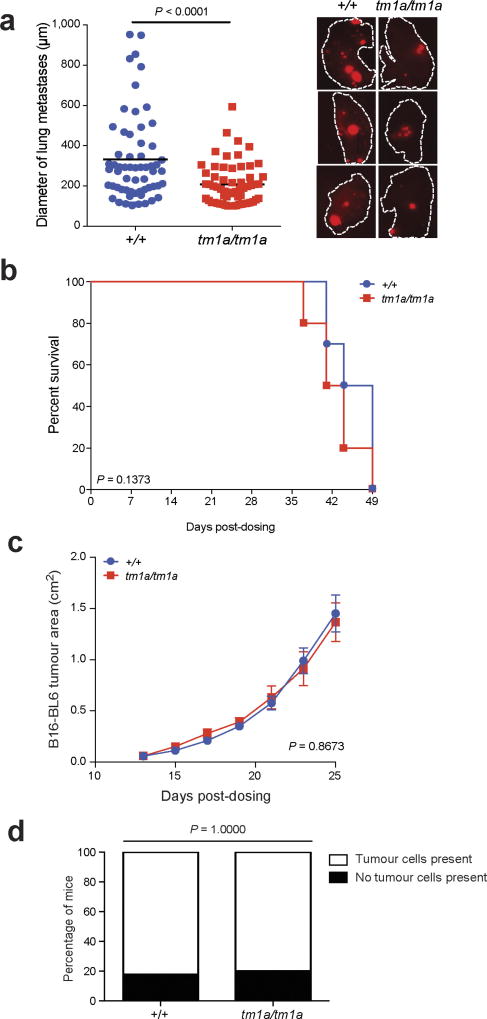
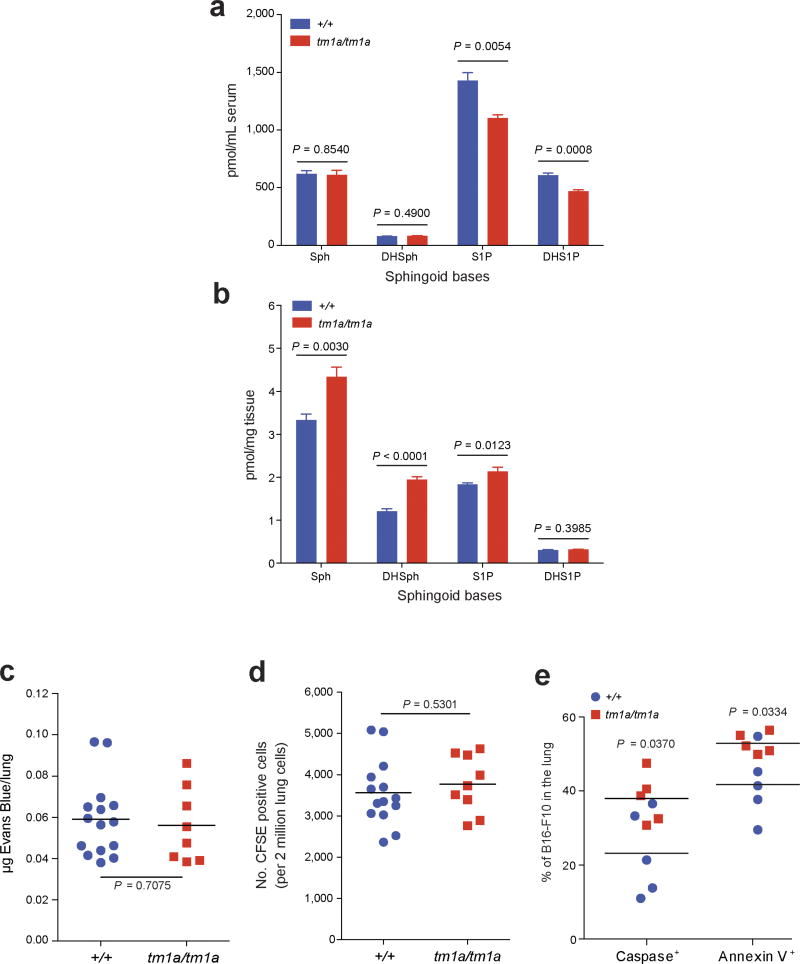
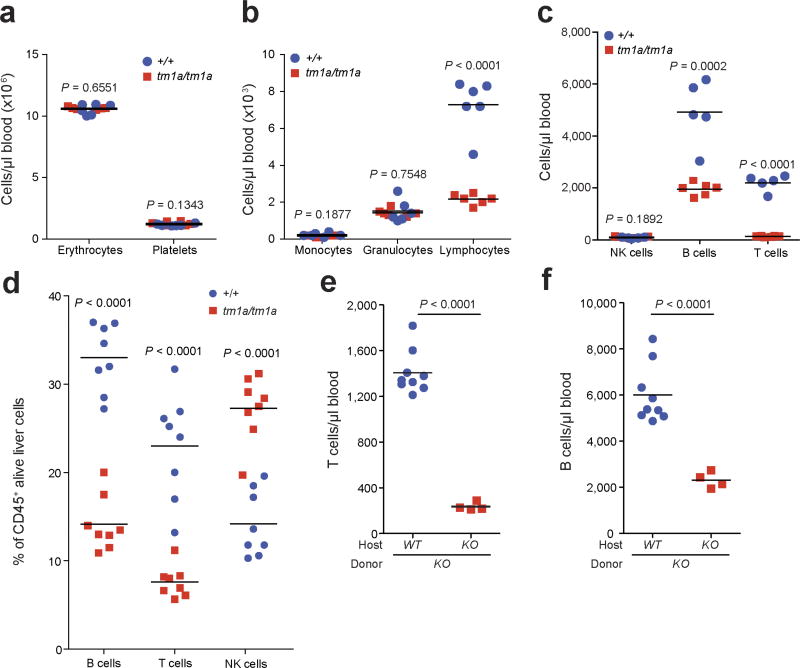
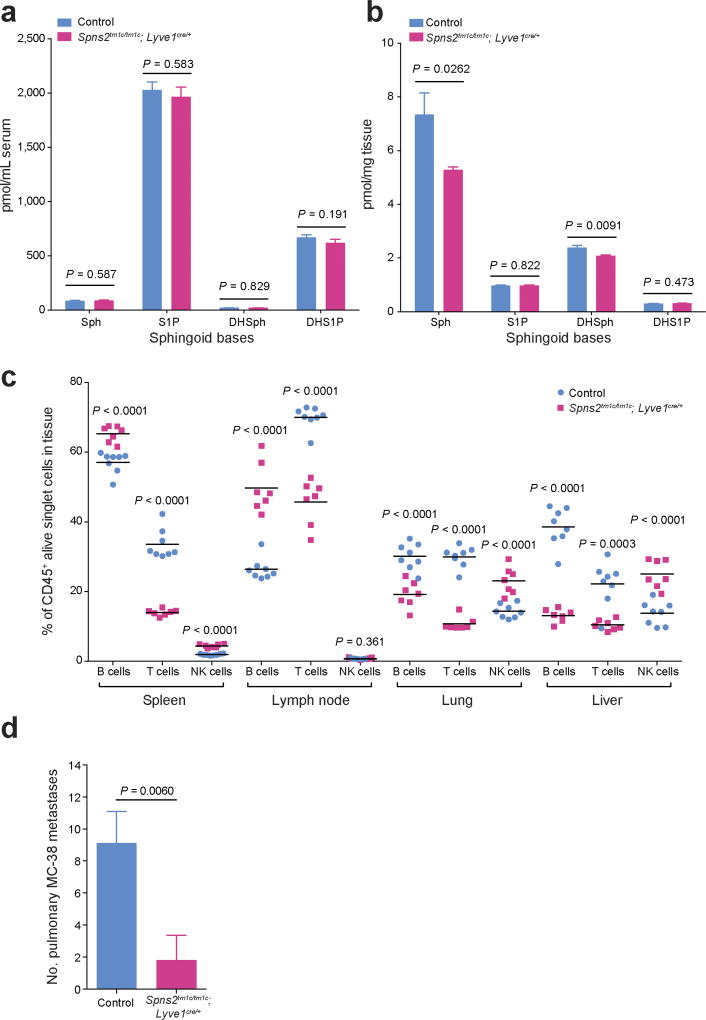
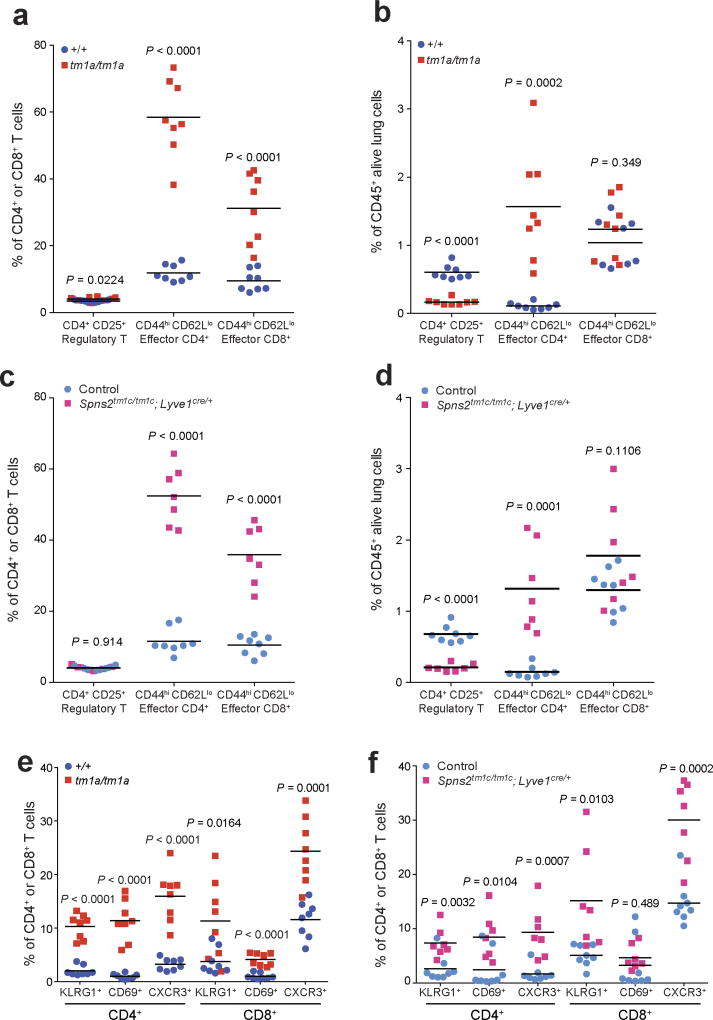
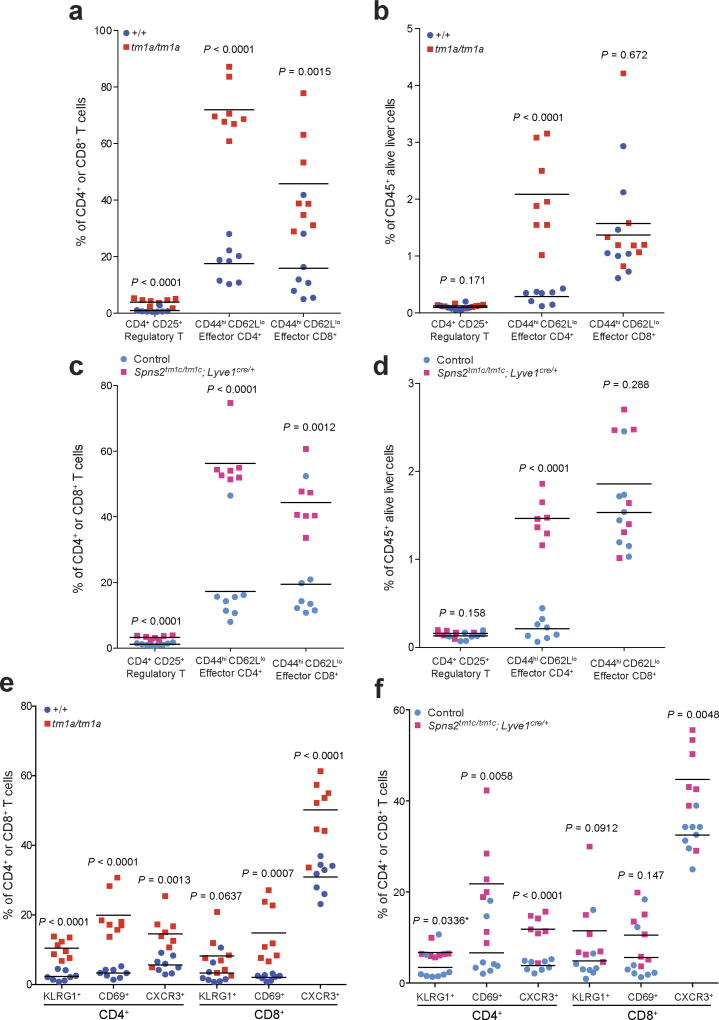
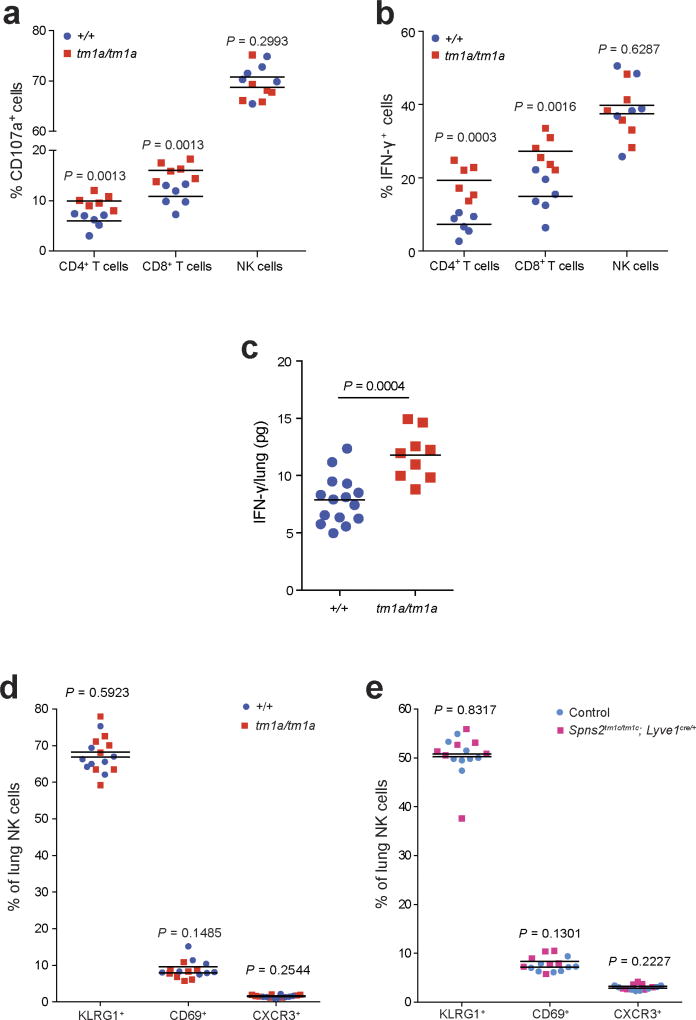
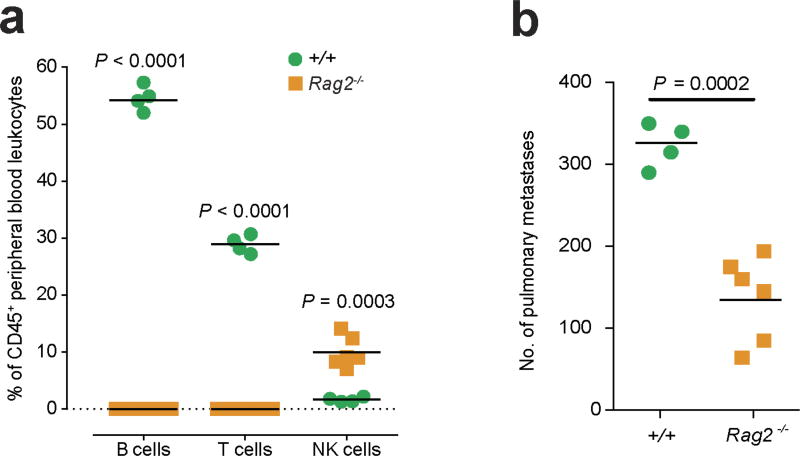
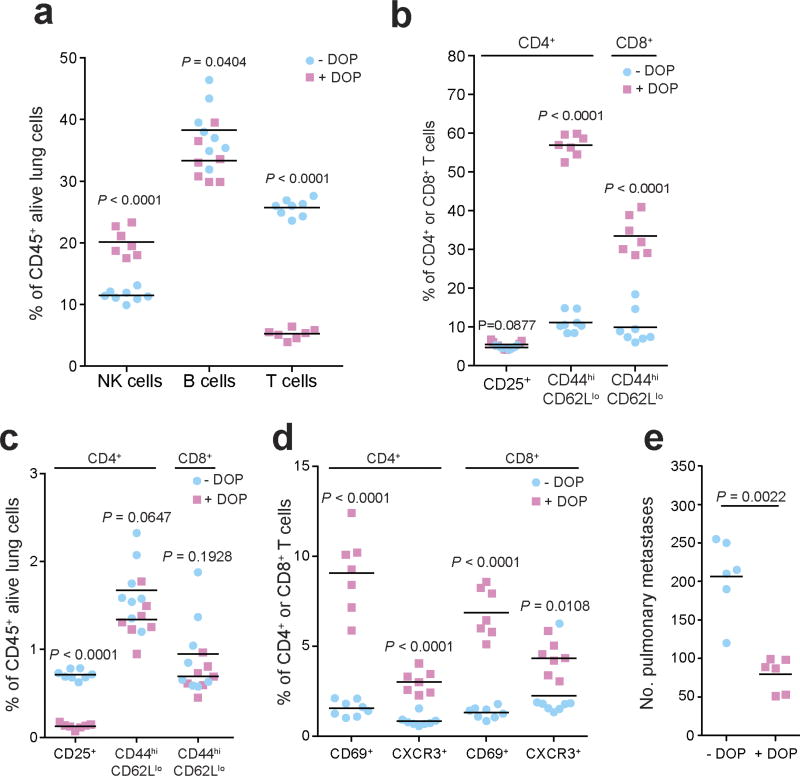
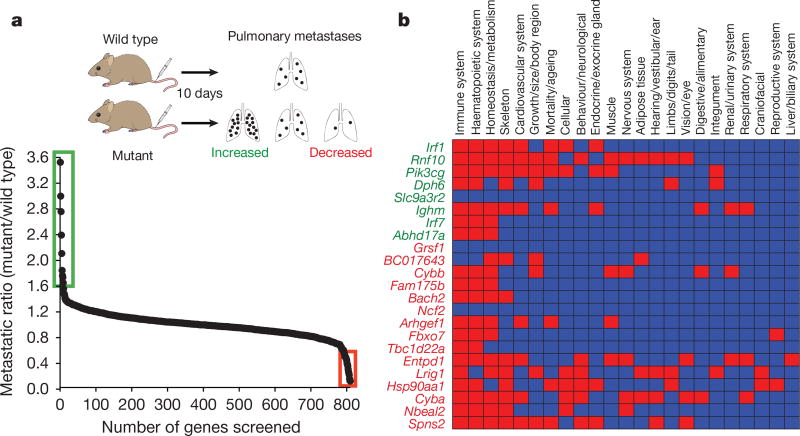
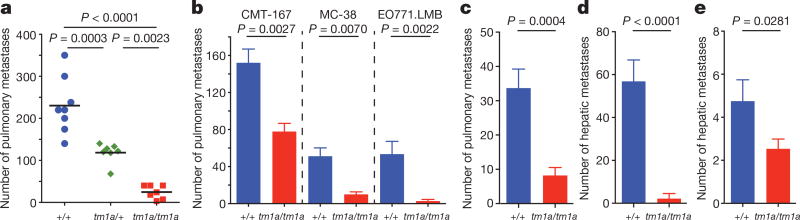
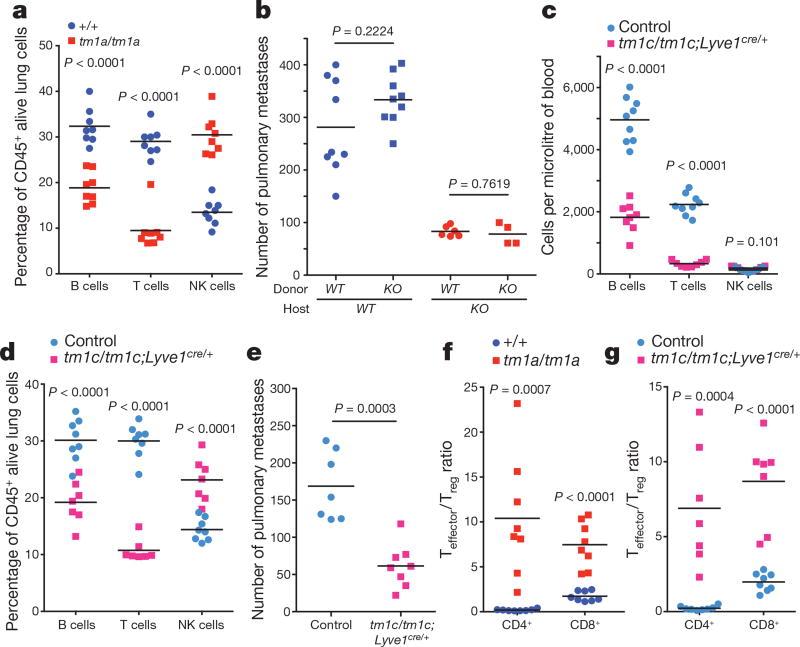
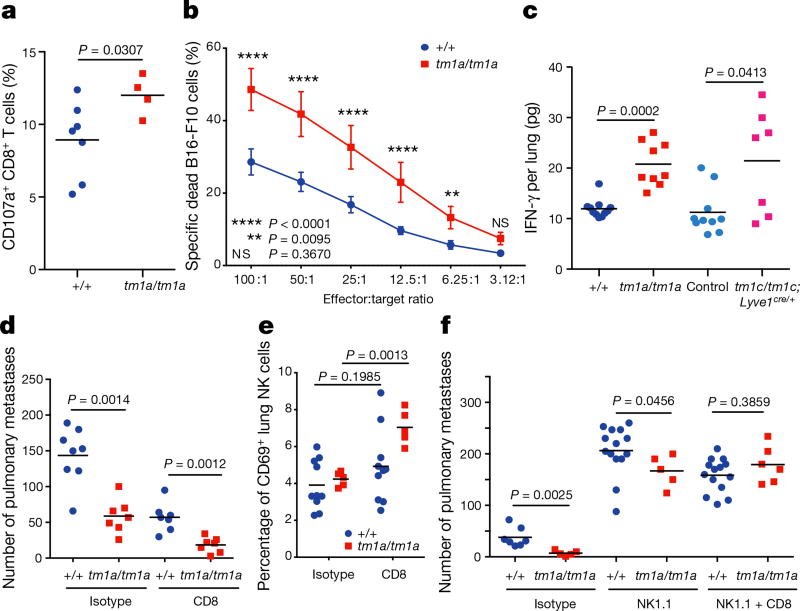
Metastasis is the leading cause of death for cancer patients. This multi-stage process requires tumour cells to survive in the circulation, extravasate at distant sites, then proliferate; it involves contributions from both the tumour cell and tumour microenvironment ('host', which includes stromal cells and the immune system). Studies suggest the early steps of the metastatic process are relatively efficient, with the post-extravasation regulation of tumour growth ('colonization') being critical in determining metastatic outcome. Here we show the results of screening 810 mutant mouse lines using an in vivo assay to identify microenvironmental regulators of metastatic colonization. We identify 23 genes that, when disrupted in mouse, modify the ability of tumour cells to establish metastatic foci, with 19 of these genes not previously demonstrated to play a role in host control of metastasis. The largest reduction in pulmonary metastasis was observed in sphingosine-1-phosphate (S1P) transporter spinster homologue 2 (Spns2)-deficient mice. We demonstrate a novel outcome of S1P-mediated regulation of lymphocyte trafficking, whereby deletion of Spns2, either globally or in a lymphatic endothelial-specific manner, creates a circulating lymphopenia and a higher percentage of effector T cells and natural killer (NK) cells present in the lung. This allows for potent tumour cell killing, and an overall decreased metastatic burden.


Conflict of interest statement

The authors declare no competing financial interests.

Figures

Extended Data Figure 1
Extended Data Figure 1. Molecular function of 810 mutant mouse lines screened and phenotypic characterization members of the interferon regulatory factor (Irf) family
a, Molecular function Gene Ontology annotation of the 810 mutant mouse lines screened as detailed in Methods. b, Experimental metastasis assay using B16-F10 cells in Irf1tm1a/tm1a, Irf5tm1e/tm1e, Irf7tm1a/tm1a and concurrent control female mice. Shown are representative data from two (Irf5), four (Irf1) or six (Irf7) independent experiments. Symbols represent individual mice with a horizontal bar at the mean. P values are from a Mann–Whitney test. c–f, Representative photographs showing B16-F10 metastatic colonies on the (c) lungs of +/+ and Irf1tm1a/tm1a mice and (d–f) the presence of extra-pulmonary metastases in Irf1tm1a/tm1a mice (tissues from three mice shown).
Extended Data Figure 2
Extended Data Figure 2. Spontaneous pulmonary metastases and primary tumour growth in Spns2 mice
a, Size measurements of spontaneous pulmonary HCmel12–mCherry melanoma cell metastases of male mice with representative fluorescent images (lines indicate the edge of the lungs); n = 10 per genotype, horizontal bars represent mean (of 50 individual metastases counted per genotype) (one-way ANOVA with blocking factor of experiment, cumulative results of two independent experiments shown). b, Survival curve of +/+ and tm1a/tm1a male mice (n = 10 per genotype) in a spontaneous metastasis assay using HCmel12–mCherry cells (log-rank test (Mantel–Cox), cumulative results of two independent experiments shown). c, Growth of subcutaneously administered B16-BL6 cells in +/+ (four male, five female) and tm1a/tm1a (five male, one female) mice. Symbols represent mean ± s.e.m. with a two-tailed unpaired t-test with Welch’s correction used to compare the area under the curve. d, Incidence of cancer in aged (> 40 weeks) +/+ (n = 15; 4 males, 11 females) and tm1a/tm1a (n = 18; 5 males, 13 females) mice. Statistical analysis was performed using a Fisher’s exact test.
Extended Data Figure 3
Extended Data Figure 3. Phenotyping of the serum and lungs of Spns2 mice
Sphingoid base levels in the (a) serum (+/+, n = 5; tm1a/tm1a, n = 4) and (b) lungs (+/+, n = 6; tm1a/tm1a, n = 5) of male mice; data are mean ± s.e.m., multiple two-tailed unpaired t-tests with P value adjusted by the Holm–Šídák method with α set to 5%. Sph, sphingosine; DHSph, dihydrosphingosine; S1P, sphingosine-1-phosphate; DHS1P, dihydrosphingosine-1-phosphate. c, Micrograms of extravasated Evans blue dye in the lungs of +/+ and tm1a/tm1a male mice. d, Number of CFSE-labelled B16-F10 cells present in the lungs of female mice 90 min after administration. e, Levels of apoptosis in B16-F10–mCherry cells 12 h after administration to male mice. Shown are representative data from three independent experiments, with symbols representing individual mice. P values are indicated from two-tailed unpaired t-test with Welch’s correction (c–e).
Extended Data Figure 4
Extended Data Figure 4. Phenotypic characterization of the haematopoietic system of Spns2 mice
a–c, The numbers of erythrocytes and platelets, monocytes, granulocytes and lymphocyte subsets present in the blood of naive +/+ and tm1a/tm1a female mice (multiple two-tailed unpaired t-tests with P value adjusted by the Holm–Šídák method with α set to 5%; data shown are representative of three independent experiments). d, Analysis of lymphocyte subsets in the liver of naive +/+ and tm1a/tm1a female mice (multiple two-tailed unpaired t-tests with P value adjusted by the Holm–Šídák method with α set to 5%; data shown are representative of three independent experiments). e, f, T- and B-lymphocyte numbers in the blood of male naive (unstimulated) bone marrow chimaeras (unpaired two-tailed t-test with Welch’s correction; data shown are representative of two independent experiments). Symbols represent individual mice; horizontal bars represent mean.
Extended Data Figure 5
Extended Data Figure 5. Characterization of the phenotype of lymphatic endothelial cell Spns2 deficient mice
a, b, Sphingoid base levels in the (a) serum or (b) lung of control and Spns2tm1c/tm1c; Lyve1cre/+ male mice (data are mean ± s.e.m., control n = 11, Spns2tm1c/tm1c; Lyve1cre/+ n = 10, multiple two-tailed unpaired t-tests with P value adjusted by the Holm–Šídák method with α set to 5%). Sph, sphingosine; DH-Sph, dihydrosphingosine; S1P, sphingosine-1-phosphate; DH-S1P, dihydrosphingosine-1-phosphate. c, Lymphocyte subsets in the spleen, lymph node, lung and liver of +/+ and tm1a/tm1a male mice (symbols represent individual mice, horizontal bars represent mean, multiple two-tailed unpaired t-tests with P value adjusted by the Holm–Šídák method with α set to 5%; data shown are representative of three independent experiments). d, Experimental metastasis assay using MC-38 cells in control (n = 9) and Spns2tm1c/tm1c; Lyve1cre/+ (n = 5) in female mice. Data shown are mean ± s.e.m., Mann–Whitney test, representative of three independent experiments.
Extended Data Figure 6
Extended Data Figure 6. T cell subsets in the lungs of Spns2 mice
The proportion of T cell subsets present in the lungs of naive +/+ and tm1a/tm1a female mice (a, b, e) and control and Spns2tm1c/tm1c; Lyve1cre/+ male mice (c, d, f). Data are shown as percentage of parent CD4+ and CD8+ T cells (a, c, e, f) or percentage of CD45+ alive lung cells present (b, d). Symbols represent individual mice with horizontal bar at the mean. P values are indicated from two-tailed unpaired t-test adjusted by the Holm–Šídák method with α set to 5%. Data shown are representative of three independent experiments.
Extended Data Figure 7
Extended Data Figure 7. T cell subsets in the liver of Spns2 mice
The proportion of T cell subsets present in the liver of naive +/+ versus tm1a/tm1a female mice and control versus Spns2tm1c/tm1c; Lyve1cre/+ male mice. Data are shown as percentage of parent CD4+ and CD8+ T cells (a, c, e, f) or percentage of CD45+ alive liver cells present (b, d). Symbols represent individual mice; statistical analysis used multiple two-tailed unpaired t-tests with P value adjusted by the Holm–Šídák method with α set to 5%, with * indicating a P value not considered significant after correcting for multiple testing. Data shown are representative of three independent experiments.
Extended Data Figure 8
Extended Data Figure 8. Phenotyping of Spns2 lungs
a, b, Ex vivo re-stimulation (PMA/ionomycin) of pulmonary leukocytes from B16-F10-stimulated +/+ and tm1a/tm1a female mice (two-tailed unpaired t-test adjusted by the Holm–Šídák method with α set to 5%). c, Measurement of IFN-γ in lungs of MC-38-stimulated +/+ and tm1a/tm1a male mice (two-tailed unpaired t-test with Welch’s correction). d, e, The proportion of NK cell subsets present in the lungs of naive +/+ versus tm1a/tm1a female mice (d) and control versus Spns2tm1c/tm1c; Lyve1cre/+ male mice (e) (multiple two-tailed unpaired t-tests with P value adjusted by the Holm–Šídák method with α set to 5%). Symbols represent individual mice, horizontal bars represent mean; data shown are representative of three independent experiments.
Extended Data Figure 9
Extended Data Figure 9. Studies in T- and B-cell-deficient mice
a, Measurement of lymphocyte subsets in the blood of +/+ and Rag2−/− mice (multiple two-tailed unpaired t-tests with P value adjusted by the Holm–Šídák method with α set to 5%). b, Experimental metastasis assay using B16-F10 cells in +/+ and Rag2−/− female mice (Mann–Whitney test). Symbols represent individual mice, horizontal bars represent mean; data shown are representative of three independent experiments.
Extended Data Figure 10
Extended Data Figure 10. Characterization of the leukocyte composition and phenotype in DOP-treated mice
a–d, The number of leukocytes and T cell subsets present in the lungs of B16-F10-dosed glucose- or DOP-treated wild-type male mice presented as the percentages of viable CD45+ lung leukocytes (a, c) or parent CD4+ or CD8+ T cells (b, d) (multiple unpaired t-tests with P value adjusted by the Holm–Šídák method with α set to 5%). e, Experimental metastasis assay in B16-F10 dosed glucose- or DOP-treated wild-type female mice (Mann–Whitney test). Symbols represent individual mice, horizontal bars represent mean; data shown are representative of two independent experiments.
Figure 1
Figure 1. Identification of microenvironmental regulators of metastatic colonization of the lung
a, Experimental model (schematic) and results from stage 1 of the screen: experimental metastasis assay performed on 810 mutant mouse lines (detailed in the Extended Methods). Those lines with a metastatic ratio of ≤0.6 (red box) or ≥1.6 (green box) and Mann–Whitney test P ≤ 0.0175 were taken forward to stage 2 as detailed in Methods. b, Top-level mammalian phenotype ontology terms for the 23 statistically significant genes following an integrative data analysis of experimental metastasis assay results from three or more additional cohorts (green is increased metastasis and red is decreased). In the heatmap, red boxes indicate a phenodeviant call, and blue no phenotype annotated (either no phenotype detected or not assayed) as detailed in Methods.
Figure 2
Figure 2. Ability of Spns2-deficient mice to regulate metastatic colonization
a, Experimental metastasis assay using B16-F10 cells in +/+ (blue), tm1a/+ (green) or tm1a/tm1a (red) male mice. b, Experimental metastasis assay using CMT-167 (+/+, n = 8; tm1a/tm1a, n = 6 female mice), MC-38 (+/+, n = 10; tm1a/tm1a, n = 5 male mice) and EO771. LMB cells (+/+, n = 12; tm1a/tm1a, n = 5 female mice). c, Spontaneous metastasis assay using HCmel12–mCherry melanoma cells in male mice (n = 10 per genotype). d, Experimental metastasis assay using WT31 transformed melanocytes in +/+ (n = 18) and tm1a/tm1a (n = 6) male mice. e, Intra-splenic administration of B16-F10 cells in +/+ (n = 16) and tm1a/tm1a (n = 15) female mice. Shown are representative data from two (b, CMT-167) or three independent experiments (a, b (MC-38 and EO771.LMB), d) or cumulative results of two independent experiments (c, e) with mean ± s.e.m. (b–e) or symbols representing individual mice with horizontal bar at the mean (a). P values are indicated from one-way analysis of variance (ANOVA) with Šídák’s multiple comparisons adjusting for multiple testing (a), Mann–Whitney test (b–d) or one-tailed unpaired t-test (e).
Figure 3
Figure 3. Characterization of the lymphocyte composition and phenotype in Spns2-deficient mice
a, The percentage of lymphocyte subsets in the lungs of +/+ and tm1a/tm1a female mice. b, Number of metastases in B16-F10-dosed male bone marrow chimaeras (genotypes: +/+ (WT) and tm1a/tm1a (KO)). c, Numbers of lymphocytes in the blood of control and tm1c/tm1c; Lyve1cre/+ male mice. d, The percentage of lymphocyte subsets in the lungs of control and tm1c/tm1c; Lyve1cre/+ male mice. e, Experimental metastasis assay using B16-F10 cells in control and tm1c/tm1c; Lyve1cre/+ female mice. f, g, Effector:regulatory T-cell ratio in the lungs of +/+ and tm1a/tm1a female mice or control and tm1c/tm1c; Lyve1cre/+ male mice. Shown are representative data from two (b) or three independent experiments (a, c–g) with symbols representing individual mice with horizontal bar at the mean. P values are indicated from two-tailed unpaired t-test adjusted by the Holm–Šídák method with α set to 5% (a, c–d, f, g) or Mann–Whitney test (b, e).
Figure 4
Figure 4. Lymphocyte regulation of metastatic colonization in Spns2-deficient mice
a, Degranulation assay on pulmonary leukocytes from B16-F10-stimulated +/+ and tm1a/tm1a female mice in response to in vitro re-stimulation with B16-F10. b, Cytotoxicity assay on pulmonary leukocytes from B16-F10-stimulated +/+ and tm1a/tm1a female mice (n = 8 per genotype). c, Measurement of IFN-γ in lungs of B16-F10-stimulated +/+ and tm1a/tm1a female mice, and control and tm1c/tm1c; Lyve1cre/+ male mice. d, Experimental metastasis assay using B16-F10 cells in +/+ and tm1a/tm1a female mice treated with either isotype or anti-CD8 antibody. e, The proportion of activated (CD69+) NK cells present in the lungs of +/+ and tm1a/tm1a female mice dosed with isotype or anti-CD8 antibody. f, Experimental metastasis assay using B16-F10 cells in +/+ and tm1a/tm1a male mice treated with isotype, anti-NK1.1 or anti-NK1.1 and CD8 antibody. Shown are representative data from three independent experiments, with symbols representing individual mice with horizontal bar at the mean (a, c–f) or mean ± s.e.m. (b). P values are indicated from two-tailed unpaired t-test with Welch’s correction (a, c, e), two-way repeated measures ANOVA with Šídák’s multiple comparisons test for each effector:target ratio (b) or Mann–Whitney test (d, f).

Comment in

References

    1. Quail DF, Joyce JA. Microenvironmental regulation of tumor progression and metastasis. Nature Med. 2013;19:1423–1437. - PMC - PubMed
    1. Chambers AF, et al. Critical steps in hematogenous metastasis: an overview. Surg. Oncol. Clin. N. Am. 2001;10:243–255. - PubMed
    1. Blank C, et al. PD-L1/B7H-1 inhibits the effector phase of tumor rejection by T cell receptor (TCR) transgenic CD8+ T cells. Cancer Res. 2004;64:1140–1145. - PubMed
    1. van Elsas A, Hurwitz AA, Allison JP. Combination immunotherapy of B16 melanoma using anti-cytotoxic T lymphocyte-associated antigen 4 (CTLA-4) and granulocyte/macrophage colony-stimulating factor (GM-CSF)-producing vaccines induces rejection of subcutaneous and metastatic tumors accompanied by autoimmune depigmentation. J. Exp. Med. 1999;190:355–366. - PMC - PubMed
    1. White JK, et al. Genome-wide generation and systematic phenotyping of knockout mice reveals new roles for many genes. Cell. 2013;154:452–464. - PMC - PubMed

Publication types

MeSH terms