. 2017 Jan 12;541(7636):217-221.
doi: 10.1038/nature20814. Epub 2017 Jan 4.

Structural variation in amyloid-β fibrils from Alzheimer's disease clinical subtypes

Affiliations

Structural variation in amyloid-β fibrils from Alzheimer's disease clinical subtypes

Wei Qiang et al. Nature. .

Abstract

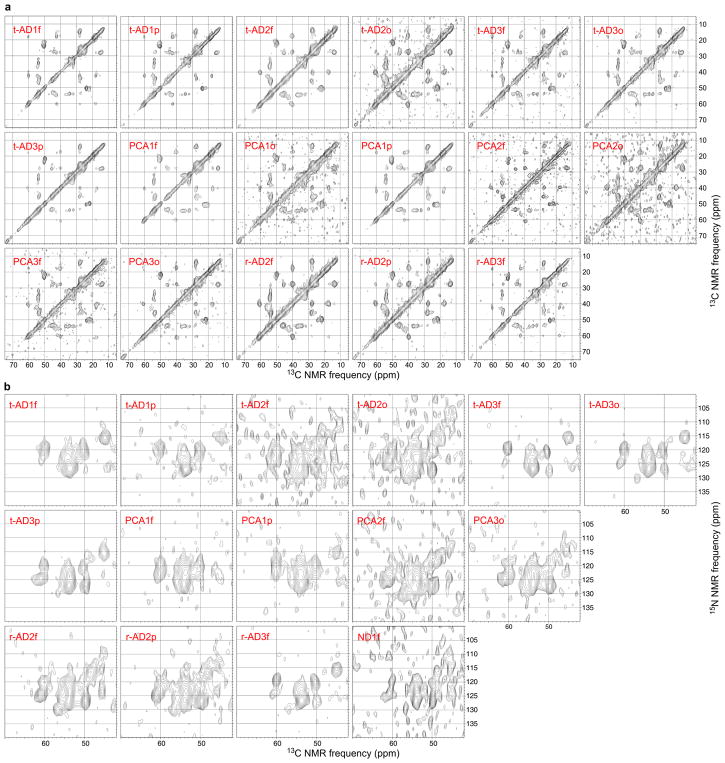
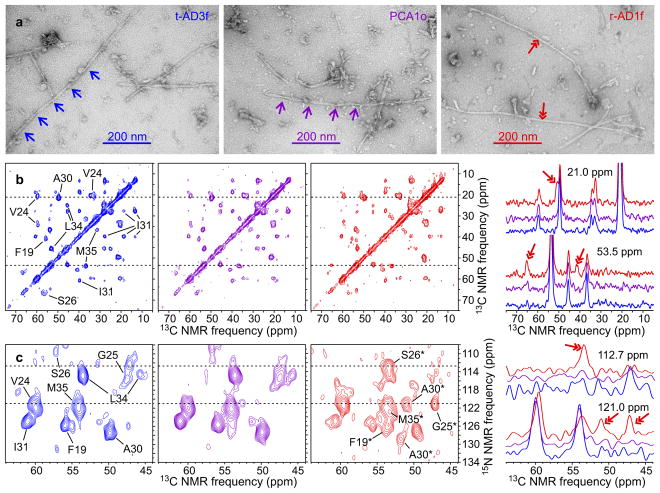
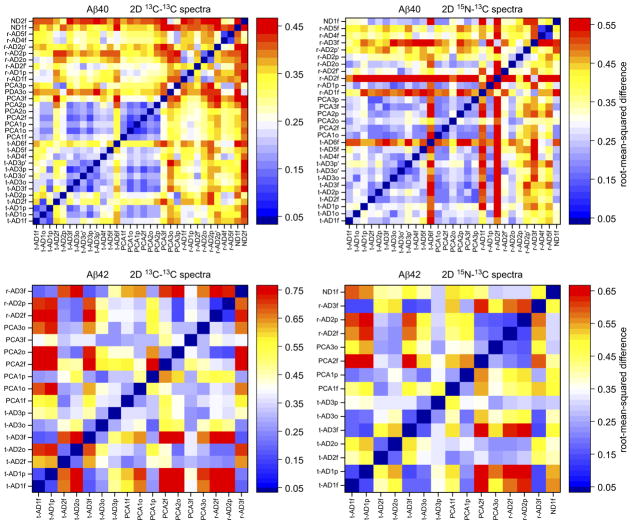
Aggregation of amyloid-β peptides into fibrils or other self-assembled states is central to the pathogenesis of Alzheimer's disease. Fibrils formed in vitro by 40- and 42-residue amyloid-β peptides (Aβ40 and Aβ42) are polymorphic, with variations in molecular structure that depend on fibril growth conditions. Recent experiments suggest that variations in amyloid-β fibril structure in vivo may correlate with variations in Alzheimer's disease phenotype, in analogy to distinct prion strains that are associated with different clinical and pathological phenotypes. Here we investigate correlations between structural variation and Alzheimer's disease phenotype using solid-state nuclear magnetic resonance (ssNMR) measurements on Aβ40 and Aβ42 fibrils prepared by seeded growth from extracts of Alzheimer's disease brain cortex. We compared two atypical Alzheimer's disease clinical subtypes-the rapidly progressive form (r-AD) and the posterior cortical atrophy variant (PCA-AD)-with a typical prolonged-duration form (t-AD). On the basis of ssNMR data from 37 cortical tissue samples from 18 individuals, we find that a single Aβ40 fibril structure is most abundant in samples from patients with t-AD and PCA-AD, whereas Aβ40 fibrils from r-AD samples exhibit a significantly greater proportion of additional structures. Data for Aβ42 fibrils indicate structural heterogeneity in most samples from all patient categories, with at least two prevalent structures. These results demonstrate the existence of a specific predominant Aβ40 fibril structure in t-AD and PCA-AD, suggest that r-AD may relate to additional fibril structures and indicate that there is a qualitative difference between Aβ40 and Aβ42 aggregates in the brain tissue of patients with Alzheimer's disease.


Figures

Extended Data Figure 1
Extended Data Figure 1. Additional TEM images of brain-seeded fibrils
(a) TEM grids were prepared 4 h after addition of solubilized Aβ40 or Aβ42 to sonicated brain extract and were negatively stained with uranyl acetate. Collagen fibrils in the extract (40–100 nm width, with characteristic transverse bands) appear in some images. Material with an amorphous appearance is nonfibrillar, non-Aβ components of the brain extract. Yellow arrows indicate Aβ40 fibrils with an apparent width modulation, attributable to an approximately periodic twisting of the fibril structure about the fibril growth direction. TEM images of all 37 brain-seeded Aβ40 and all 33 Aβ42 fibril samples are available on-line at http://dx.doi.org/10.17632/whgp9r7tkd.1. (b) Histogram of distances between width minima for Aβ40 fibrils with apparent width modulation. The Gaussian fit to this histogram (red curve) has a mean value of 107.2 nm (n = 65) and a full-width-at-half-maximum of 46.1 nm.
Extended Data Figure 2
Extended Data Figure 2. 2D ssNMR spectra of brain-seeded Aβ40 fibrils
a, 2D 13C-13C spectra of fibrils seeded with extract from t-AD, PCA-AD, r-AD, or ND tissue. Aliphatic regions are shown, with 15 contour levels increasing by successive factors of 1.3, and with the highest contour at the maximum signal in each 2D spectrum. b, 2D 15N-13C spectra of fibrils seeded with extract from t-AD, PCA-AD, r-AD, or ND tissue. Regions containing intra-residue 15N-13Cα crosspeaks are shown, with 11 contour levels increasing by successive factors of 1.3, and with the highest contour at the maximum signal in each spectrum. 15N-13Cβ crosspeaks from L34 appear in some spectra. Positions of crosspeaks from the predominant Aβ40 fibril structure are indicated by color-coded circles (F19 = blue, V24 = cyan, G25 = pink, S26 = orange, A30 = purple, I31 = red, L34 = green, M35 = magenta). Only 2D spectra that were included in the analyses in Figs. 3 and 4 of the main text are shown. The full set of 42 2D 13C-13C spectra and 40 2D 15N-13C spectra, including those with lower signal-to-noise, controls, and technical replicates, is available on-line at http://dx.doi.org/10.17632/tbp45pm92x.1.
Extended Data Figure 3
Extended Data Figure 3. 2D ssNMR spectra of brain-seeded Aβ42 fibrils
a, 2D 13C-13C spectra of fibrils seeded with extract from t-AD, PCA-AD, r-AD, or ND tissue. Aliphatic regions are shown, with 15 contour levels increasing by successive factors of 1.3, and with the highest contour at the maximum signal in each spectrum. b, 2D 15N-13C spectra of fibrils seeded with extract from t-AD, PCA-AD, r-AD, or ND tissue. Regions containing intra-residue 15N-13Cα crosspeaks are shown, with 11 contour levels increasing by successive factors of 1.3, and with the highest contour at the maximum signal in each spectrum. Only 2D spectra that were included in the analyses in Figs. 3 and 4 of the main text are shown. The full set of 33 2D 13C-13C spectra and 23 2D 15N-13C spectra, including those with lower signal-to-noise, controls, and technical replicates, is available on-line at http://dx.doi.org/10.17632/tbp45pm92x.1.
Extended Data Figure 4
Extended Data Figure 4. Control experiments using cortical tissue without Aβ deposits
Occipital tissue of a female who died from cardiac arrest at age 86 was used as a control. a, Comparison of TEM images of control tissue extract and r-AD2p′ extract after incubation for 4.0 h with solubilized Aβ40, under conditions identical to those that led to fibrils shown in Extended Data Fig. 1a. Fibrils associated with brain material were abundant on the TEM grid of the r-AD2p′-seeded sample, but were not observed in an extensive search over the TEM grid of the control sample. b, TEM images of control tissue extract and r-AD2p′ extract after incubation for 4.0 h with solubilized Aβ42, under conditions identical to those that led to fibrils shown in Extended Data Fig. 1b. Fibrils associated with brain material were abundant on the TEM grid of the r-AD2p′-seeded sample, but were not observed in an extensive search over the TEM grid of the control sample. c, 2D 13C-13C and 15N-13C spectra of Aβ40 fibrils (blue) and Aβ42 fibrils (red) that developed in control samples after 168 h or 48 h incubation, respectively, followed by 24 h intermittent sonication (see Supplemental Methods), followed by 72 h additional incubation. Contour levels increase by successive factors of 1.4. d, RMSDs between 2D spectra of control fibrils and 2D spectra of AD brain-seeded fibrils, with dashed lines at RMSD values corresponding to white shades in Fig. 3 of the main text.
Extended Data Figure 5
Extended Data Figure 5. Principal component analyses of 2D 13C-13C and 15N-13C ssNMR spectra of brain-seeded Aβ40 fibrils
a, The first five principal components (PC1-PC5) of the 32 experimental 2D 13C-13C spectra, shown as contour plots with positive contours in blue and negative contours in red. Principal component spectra were obtained by singular value decomposition of the experimental spectra, considering only the aliphatic region and excluding points within 5 ppm of the diagonal. Contour levels increase (or decrease, in the case of negative contours) by successive factors of 1.5. b, Experimental 2D 13C-13C spectrum of t-AD4f Aβ40 fibrils (left) and 2D spectrum constructed as a linear combination of PC1-PC5 (right, with coefficients of PC1-PC5 shown in parentheses). c, Experimental 2D 13C-13C spectrum of r-AD1f Aβ40 fibrils (left) and 2D spectrum constructed as a linear combination of PC1-PC5 (right). c, The first five principal components of the 29 experimental 2D 15N-13C spectra. d, Experimental 2D 15N-13C spectrum of PCA2p Aβ40 fibrils (left) and 2D spectrum constructed as a linear combination of PC1-PC5 (right). e, Experimental 2D 15N-13C spectrum of r-AD2o Aβ40 fibrils (left) and 2D spectrum constructed as a linear combination of PC1-PC5 (right).
Extended Data Figure 6
Extended Data Figure 6. Principal component analyses of 2D 13C-13C and 15N-13C ssNMR spectra of brain-seeded Aβ42 fibrils
a, The first five principal components (PC1-PC5) of the 17 experimental 2D 13C-13C spectra, plotted as in Extended Data Fig. 5. b, Experimental 2D 13C-13C spectrum of t-AD1p Aβ42 fibrils (left) and 2D spectrum constructed as a linear combination of PC1-PC5 (right, with coefficients of PC1-PC5 shown in parentheses). c, Experimental 2D 13C-13C spectrum of r-AD2f Aβ42 fibrils (left) and 2D spectrum constructed as a linear combination of PC1-PC5 (right). c, The first five principal components of the 15 experimental 2D 15N-13C spectra. d, Experimental 2D 15N-13C spectrum of t-AD3f Aβ42 fibrils (left) and 2D spectrum constructed as a linear combination of PC1-PC5 (right). e, Experimental 2D 15N-13C spectrum of r-AD2p Aβ42 fibrils (left) and 2D spectrum constructed as a linear combination of PC1-PC5 (right).
Extended Data Figure 7
Extended Data Figure 7. Analysis of 2D 15N-13C ssNMR spectra of brain-seeded fibrils by fitting with crosspeaks at fixed chemical shift positions
a, Examples of 2D spectra (out of the 29 Aβ40 and 15 Aβ42 spectra with adequate signal-to-noise in Table 1), with fitted crosspeak positions indicated by crosses. Red and blue crosses indicate crosspeaks for chemical shift sets “a” and “b”, respectively (see Supplementary Methods, Supplementary Discussion, and Extended Data Fig. 8). Cyan crosses indicate additional crosspeaks. Contour levels increase by successive factors of 1.4. b, Pairwise differences among fitted crosspeak volumes for spectra of Aβ40 fibrils (left) and Aβ42 fibrils (right), with color scales representing RMSD values. Total crosspeak volumes in each spectrum were normalized before calculation of RMSD values. Results from this crosspeak-fitting analysis are similar to results in Fig. 3, in which the same experimental data were analyzed by direct comparisons of signal amplitudes in 2D spectra without fitting the signals with crosspeaks at specific positions. c, Fractions of the total fitted crosspeak volumes at “a” and “b” chemical shifts, with mean values indicated by horizontal bars. For Aβ40, mean values of “a” volumes in spectra of t-AD (n = 12) or PCA-AD (n = 6) samples are significantly greater than the mean value (n = 10) in spectra of r-AD samples (p < 0.02, Welch’s t-test; p < 0.02, Mann-Whitney-Wilcoxon test).
Extended Data Figure 8
Extended Data Figure 8. Comparisons of ssNMR chemical shifts of brain-seeded Aβ40 and Aβ42 fibrils with previously reported chemical shifts
a, 15N and 13C chemical shifts (ppm) from spectra of brain-seeded samples in Table 1 (grouped into sets “a”, “b”, etc., based on correlations of the corresponding signal amplitudes over multiple 2D spectra) are compared with chemical shifts from previous ssNMR studies of Aβ40 and Aβ42 fibrils, as deposited in the Biological Magnetic Resonance Bank with the indicated BMRB accession numbers. b, Chemical shift differences after adjustments of chemical shift referencing in each set to make the average 13Cα shifts and the average 15N shifts equal in all sets.
Figure 1
Figure 1. Representative TEM images and 2D ssNMR spectra of brain-seeded Aβ40 fibrils
a, Images of negatively-stained fibrils derived from t-AD3f, PCA1o, and r-AD1f tissue, recorded 4 h after initiation of seeded fibril growth (out of 37 fibril samples). Single-headed arrows indicate the periodic modulation of apparent fibril width in a common Aβ40 fibril morphology. Double-headed arrows indicate an additional morphology. b, Aliphatic regions of 2D 13C-13C spectra of the same samples (color coded), with assignments of crosspeak signals to isotopically labeled residues shown in the 2D spectrum of t-AD3f fibrils. Aβ40 was uniformly 15N,13C-labeled at F19, V24, G25, S26, A30, I31, L34, and M35. Contour levels increase by successive factors of 1.5. 1D slices at 21.0 ppm and 53.5 ppm are shown on the right, with double-headed arrows indicating signals that arise from the less common fibril structures. c, 2D 15N-13C spectra of the same samples, with assignments of the predominant crosspeak signals shown in the 2D spectrum of t-AD3f fibrils and assignments of additional signals shown in the 2D spectrum of r-AD1f fibrils. Contour levels increase by successive factors of 1.3. 1D slices at 112.7 ppm and 121.0 ppm are shown on the right, with double-headed arrows indicating signals that arise from the less common fibril structures.
Figure 2
Figure 2. Representative TEM images and 2D ssNMR spectra of brain-seeded Aβ42 fibrils
a, Images of negatively-stained fibrils derived from t-AD3p, PCA1f, and r-AD2p tissue (out of 33 fibril samples). b, 2D 13C-13C spectra of the same samples (color coded), with assignments of crosspeak signals to isotopically labeled residues shown in the 2D spectrum of t-AD3p fibrils. Aβ42 was uniformly 15N,13C-labeled at F19, G25, A30, I31, L34, and M35. 1D slices at 27.6 ppm and 53.5 ppm are shown on the right. c, 2D 15N-13C spectra of the same samples, with assignments of the crosspeak signals shown in the 2D spectrum of t-AD3p fibrils. Two 15N-13Cα crosspeaks with similar intensities are observed for A30 and I31, indicating similar populations of two distinct fibril structures. 1D slices at 119.5 ppm and 127.1 ppm are shown on the right.
Figure 3
Figure 3. Pairwise differences among 2D ssNMR spectra of brain-seeded Aβ40 and Aβ42 fibrils
RMSD values are displayed on the color scales shown to the right of each plot, with blue shades indicating relatively similar spectra and red shades indicating relatively dissimilar spectra. RMSD plots for Aβ40 fibrils indicate that fibrils derived from t-AD and PCA-AD tissue have similar 2D spectra in most cases, while greater differences are observed in spectra of Aβ40 fibrils derived from r-AD tissue. For Aβ42 fibrils, correlations between RMSD values and tissue categories are not observed. Statistical analyses are summarized in Extended Data Table 1a. Shades above white represent significant differences between 2D spectra.
Figure 4
Figure 4. Principal component analyses of 2D ssNMR spectra of brain-seeded Aβ40 and Aβ42 fibrils
For each set of 2D spectra, the coefficients of the first five principal components (C1 through C5) are plotted in groups corresponding to fibrils derived from different tissue categories. Horizontal bars indicate mean values. The mean value of C2 for Aβ40 fibrils from r-AD tissue (n = 8 for 2D 13C-13C, n = 10 for 2D 15N-13C) is significantly different from the mean value of C2 for Aβ40 fibrils from t-AD (n = 13 for 2D 13C-13C, n =12 for 2D 15N-13C) or PCA-AD (n = 9 for 2D 13C-13C, n = 6 for 2D 15N-13C) tissue. Statistical analyses are summarized in Extended Data Table 1b.

References

    1. Petkova AT, et al. Self-propagating, molecular-level polymorphism in Alzheimer’s β-amyloid fibrils. Science. 2005;307:262–265. - PubMed
    1. Paravastu AK, Leapman RD, Yau WM, Tycko R. Molecular structural basis for polymorphism in Alzheimer’s β-amyloid fibrils. Proc Natl Acad Sci U S A. 2008;105:18349–18354. - PMC - PubMed
    1. Paravastu AK, Qahwash I, Leapman RD, Meredith SC, Tycko R. Seeded growth of β-amyloid fibrils from Alzheimer’s brain-derived fibrils produces a distinct fibril structure. Proc Natl Acad Sci U S A. 2009;106:7443–7448. - PMC - PubMed
    1. Lu JX, et al. Molecular structure of β-amyloid fibrils in Alzheimer’s disease brain tissue. Cell. 2013;154:1257–1268. - PMC - PubMed
    1. Bertini I, Gonnelli L, Luchinat C, Mao JF, Nesi A. A new structural model of Aβ(40) fibrils. J Am Chem Soc. 2011;133:16013–16022. - PubMed

Publication types

MeSH terms