. 2017 Jan 4;12(1):e0169077.
doi: 10.1371/journal.pone.0169077. eCollection 2017.

Metabolomic Profiling in Individuals with a Failing Kidney Allograft

Affiliations

Metabolomic Profiling in Individuals with a Failing Kidney Allograft

Roberto Bassi et al. PLoS One. .

Abstract

Background: Alteration of certain metabolites may play a role in the pathophysiology of renal allograft disease.

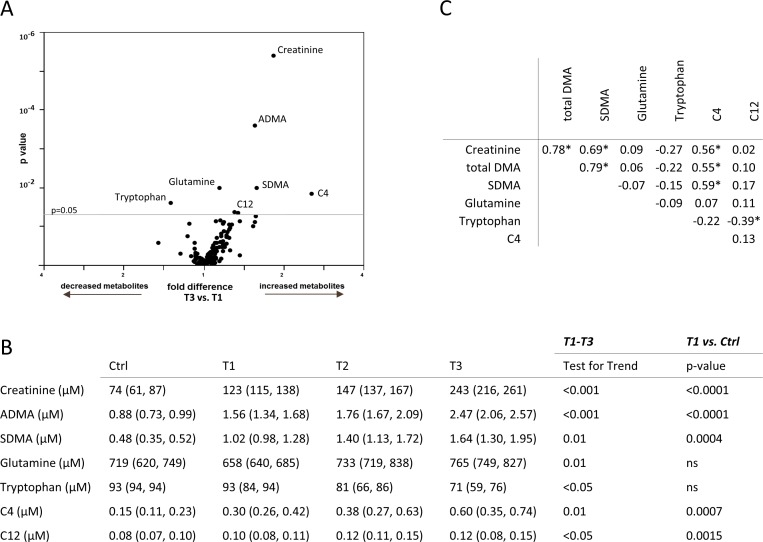
Methods: To explore metabolomic abnormalities in individuals with a failing kidney allograft, we analyzed by liquid chromatography-mass spectrometry (LC-MS/MS; for ex vivo profiling of serum and urine) and two dimensional correlated spectroscopy (2D COSY; for in vivo study of the kidney graft) 40 subjects with varying degrees of chronic allograft dysfunction stratified by tertiles of glomerular filtration rate (GFR; T1, T2, T3). Ten healthy non-allograft individuals were chosen as controls.

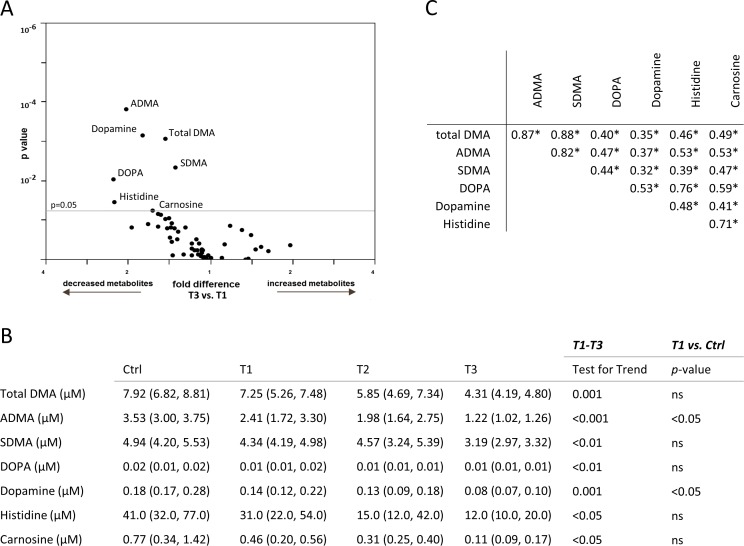
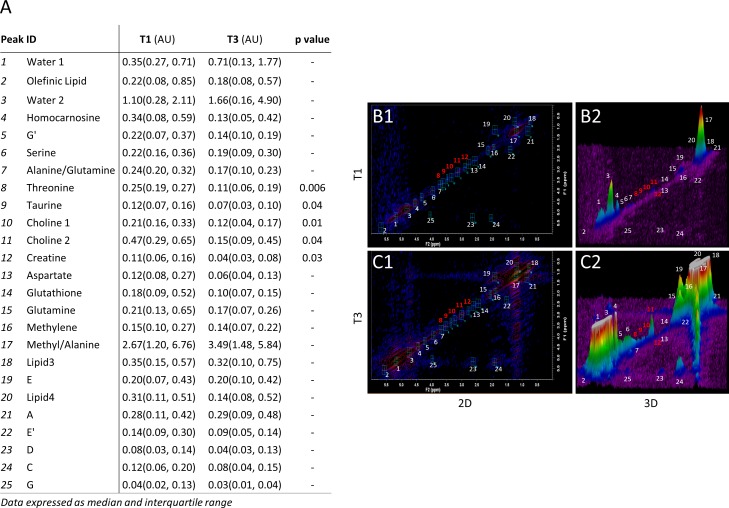
Results: LC-MS/MS analysis revealed a dose-response association between GFR and serum concentration of tryptophan, glutamine, dimethylarginine isomers (asymmetric [A]DMA and symmetric [S]DMA) and short-chain acylcarnitines (C4 and C12), (test for trend: T1-T3 = p<0.05; p = 0.01; p<0.001; p = 0.01; p = 0.01; p<0.05, respectively). The same association was found between GFR and urinary levels of histidine, DOPA, dopamine, carnosine, SDMA and ADMA (test for trend: T1-T3 = p<0.05; p<0.01; p = 0.001; p<0.05; p = 0.001; p<0.001; p<0.01, respectively). In vivo 2D COSY of the kidney allograft revealed significant reduction in the parenchymal content of choline, creatine, taurine and threonine (all: p<0.05) in individuals with lower GFR levels.

Conclusions: We report an association between renal function and altered metabolomic profile in renal transplant individuals with different degrees of kidney graft function.


Conflict of interest statement

The authors have declared that no competing interests exist.

Figures

Fig 1
Fig 1
(A) Multivariate analysis (volcano plot) of common metabolites measured in the serum on the Biocrates platform and their association with glomerular filtration rate (GFR; T1-T3) are reported as fold difference (x-axis), and nominal significance is presented on the y-axis. (B) Serum metabolites significantly different among patients with varying renal function are shown in the kidney transplant recipient (T1, T2, T3) and the control (Ctrl) group. (C) Spearman nonparametric correlation matrix among the metabolites in serum significantly associated with varying kidney transplant function. Correlation coefficients are presented. Significant associations are marked with an asterisk (*).
Fig 2
Fig 2
(A) Multivariate analysis (volcano plot) of common metabolites measured in the urine on the Biocrates platform and their association with glomerular filtration rate (GFR; T1-T3) are reported as fold difference (x-axis), and nominal significance is presented on the y-axis. (B) Urinary metabolites significantly different among patients with varying renal function are presented in the kidney transplant recipient (T1, T2, T3) and the control (Ctrl) group. (C) Spearman nonparametric correlation matrix among the metabolites in urine significantly associated with varying kidney transplant function. Correlation coefficients are presented. Significant associations are marked with an asterisk (*).
Fig 3
Fig 3. Two dimensional Correlated Spectroscopy (2D COSY) results of the kidney allograft.
(A) Table of 2D COSYcrosspeak volumes shows significantly lower threonine, taurine, creatine and choline content in T3 individuals with low glomerular filtration rate and severe allograft dysfunction when compared to T1 individuals with more conserved graft function. “-”indicates a p value greater than 0.05. (B) Representative 2D COSY spectra show higher content of lipid-derived metabolites and reduced levels of threonine, taurine, creatine and choline in T3 individuals carrying a failing allograft. B1 shows a topological map of crosspeaks and B2 shows the 3D reconstruction. (C) Representative 2D COSY of T1 allograft patients with more conserved graft function with two-dimensional (C1) and three-dimensional (C2) reconstruction of the 2D COSY data. Data are expressed as median (25th, 75th percentile). Abbreviations. Arbitrary Units (AU).

References

    1. Murray JE, Merrill JP, Harrison JH. Renal homotransplantation in identical twins. 1955. J Am Soc Nephrol. 2001;12(1):201–4. - PubMed
    1. Kasiske BL, Skeans MA, Leighton TR, Ghimire V, Leppke SN, Israni AK. OPTN/SRTR 2011 Annual Data Report: International Data. Am J Transplant. 2013;13 Suppl 1:199–225. - PubMed
    1. Nankivell BJ, Chapman JR. Chronic allograft nephropathy: current concepts and future directions. Transplantation. 2006;81(5):643–54. 10.1097/01.tp.0000190423.82154.01 - DOI - PubMed
    1. http://www.srtr.org. 2010.
    1. Amico P. Evolution of graft survival in kidney transplantation: an analysis of the OPTN/UNOS Renal Transplant Registry. Clin Transpl. 2010:1–15. - PubMed