. 2017 Jan 3;18(1):161-173.
doi: 10.1016/j.celrep.2016.12.023.

Synucleins Have Multiple Effects on Presynaptic Architecture

Affiliations

Synucleins Have Multiple Effects on Presynaptic Architecture

Karina J Vargas et al. Cell Rep. .

Abstract

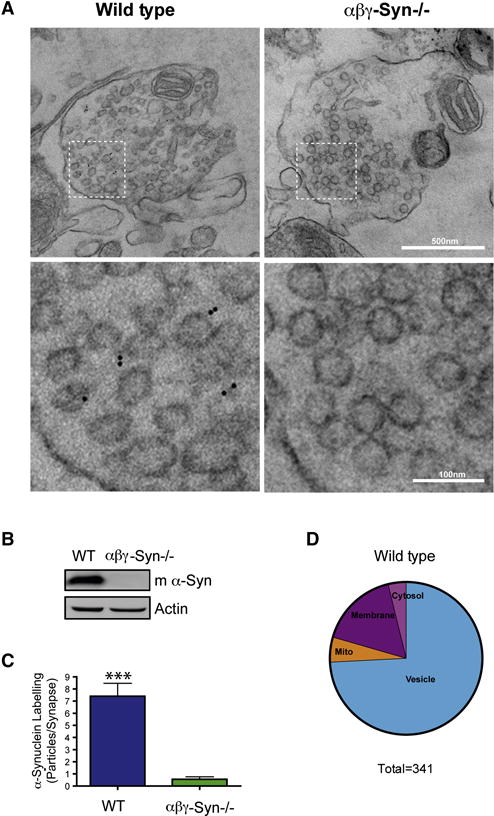
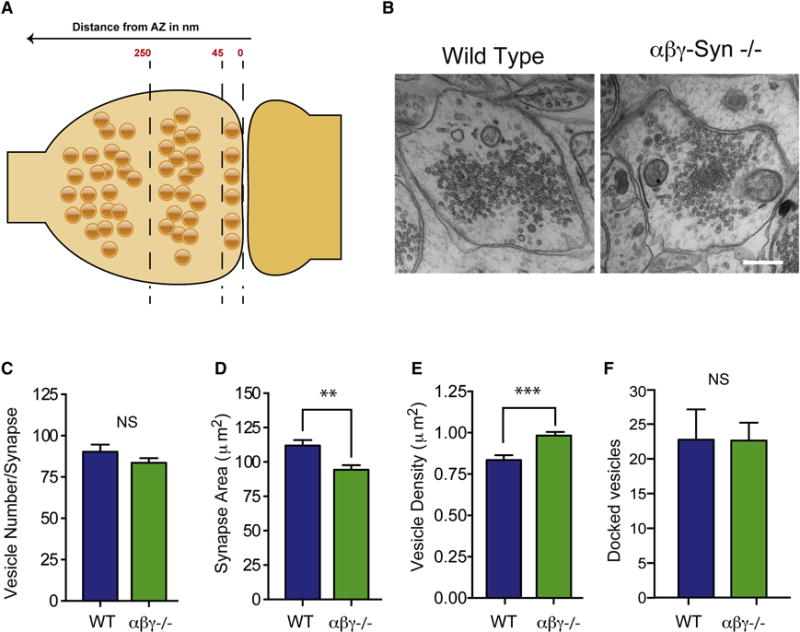
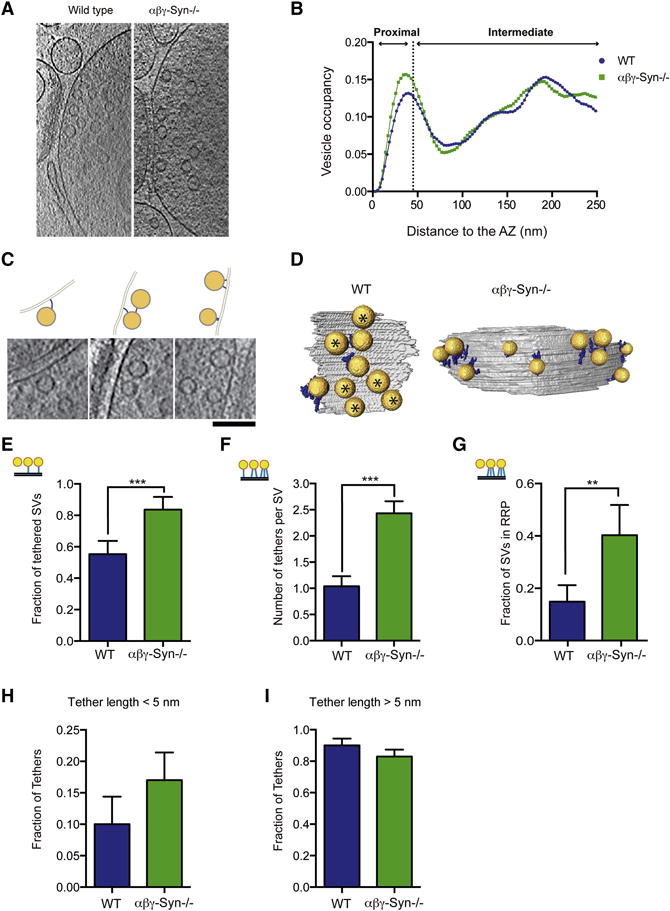
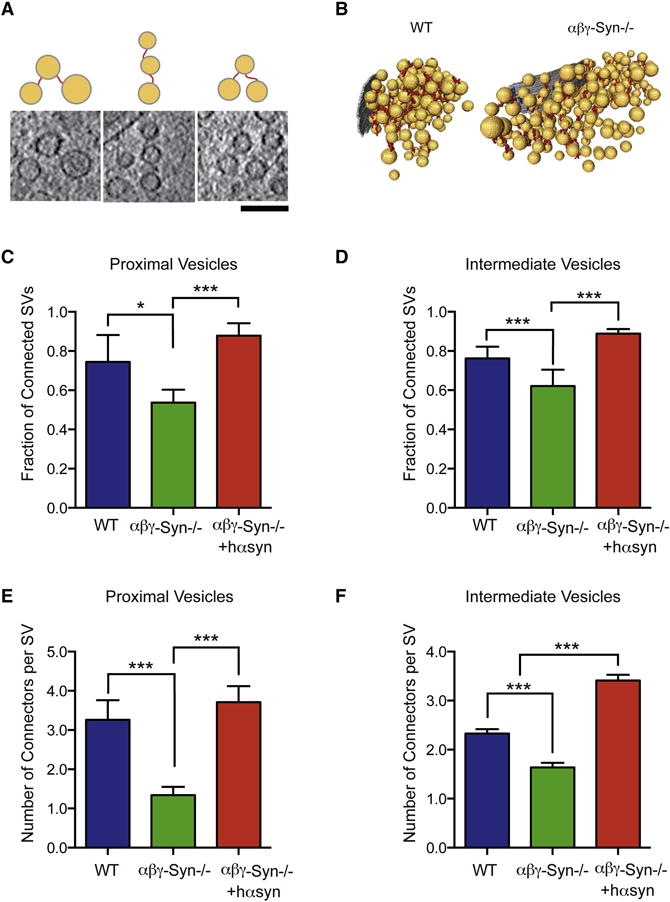
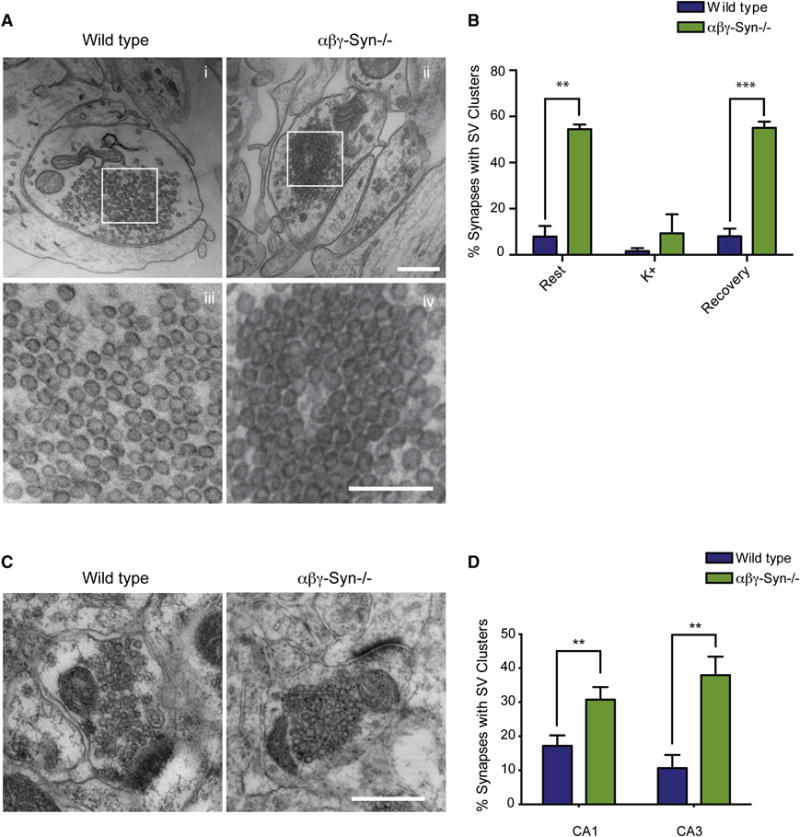
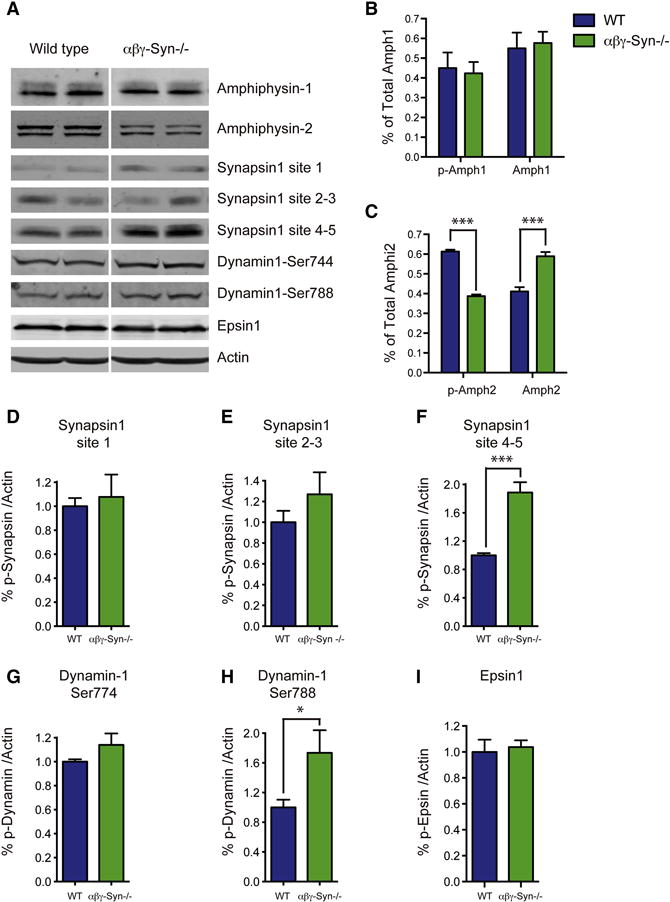
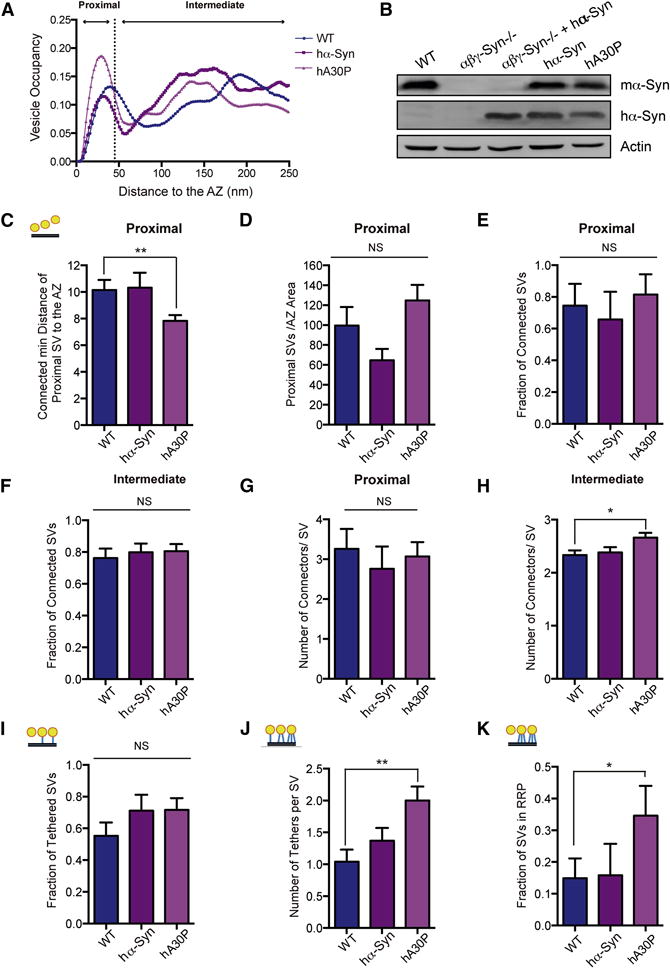
Synucleins (α, β, γ-synuclein) are a family of abundant presynaptic proteins. α-Synuclein is causally linked to the pathogenesis of Parkinson's disease (PD). In an effort to define their physiological and pathological function or functions, we investigated the effects of deleting synucleins and overexpressing α-synuclein PD mutations, in mice, on synapse architecture using electron microscopy (EM) and cryoelectron tomography (cryo-ET). We show that synucleins are regulators of presynapse size and synaptic vesicle (SV) pool organization. Using cryo-ET, we observed that deletion of synucleins increases SV tethering to the active zone but decreases the inter-linking of SVs by short connectors. These ultrastructural changes were correlated with discrete protein phosphorylation changes in αβγ-synuclein-/- neurons. We also determined that α-synuclein PD mutants (PARK1/hA30P and PARK4/hα-syn) primarily affected presynaptic cytomatrix proximal to the active zone, congruent with previous findings that these PD mutations decrease neurotransmission. Collectively, our results suggest that synucleins are important orchestrators of presynaptic terminal topography.

Keywords: Parkinson’s disease; amphiphysin; calcineurin; endocytosis; knockout mouse; presynaptic; reserve pool; synaptic vesicle; tethering; tomography.


Figures

Figure 1
Figure 1. Synucleins are Peripheral SV Associated Proteins
A. Representative electron micrographs of wild type and αβγ-Syn−/− synaptosomes after hypotonic fixation and immunoEM with an α-synuclein specific antibody and secondary gold particles (top panels; Scale bar = 500 nm). The bottom panels are zoomed in regions noted in the top panels (Scale bar = 100 nm). The black dots denote the location of the gold particles. B. Western blotting of wild type and αβγ-Syn−/− synaptosomes with a mouse α-synuclein antibody to confirm genotypes. C. Quantification of α-synuclein labeling in micrographs such as shown in A. N = experiments; 46–25 synapses/2–3 mice/genotype. D. Pie chart of the localization of α-synuclein gold particles (n=341). *** p<0.001.
Figure 2
Figure 2. EM of Wild type and αβγ-Syn−/− Synapses
A. Cartoon of a wild type synapse with the three zone of SVs indicated: 45 nm from AZ, docked/proximal SVs; 45–250 nm, intermediate SVs; >250 nm, distal SVs. B. Electron micrograph of wild type and αβγ-Syn−/− synapses. Quantification in wild type (blue) and αβγ-Syn−/− (green) synapses of C. presynaptic terminal area; D. SV number; E. SV Density/Presynaptic Area F. Docked vesicle number. N = 3 independent cultures, with a minimum of 56 micrographs/neuronal culture. N= 3 independent neuronal cultures, 50–150 synapses/genotype/culture were analyzed. Scale Bar for Bi and ii = 400 nm. NS, not significant, ** p<0.01, *** p<0.001.
Figure 3
Figure 3. Cryo-ET of Wild type and αβγ-Syn−/− Synapses Reveals Increased Tethering Upon Deletion of Synucleins
A. Representative computationally extracted 2 nm thick cryo-ET slices of wild type and αβγ-Syn−/− synaptosomes. B. The SV distribution calculated as the fraction of cytoplasmic volume occupied by SVs in the first 250nm from the AZ. C. Examples of tethered SVs along with line diagrams of images. Computationally extracted tomographic slices are 2nm thick. Scale Bar = 100nm. D. 3D visualization of SVs (yellow) tethers (blue) and AZ (grey). Asterisks are proximal vesicles that are not tethered. E. Fraction of proximal SVs that have at least one tether in wild type and αβγ-Syn−/−. F. The mean number of tethers per proximal SV per synapse in the two genotypes. p<0.001 by Kruskal-Wallis (K-W) test). G. The fraction of proximal SVs with two or more tethers (structural RRP). p<0.01 by χ2 test. H. Fraction of tethers shorter than 5 nm. I. Fraction of tethers longer than 5 nm. N = 3 independent experiments. ** p<0.01, *** p<0.001.
Figure 4
Figure 4. Decreased Connectivity of SVs in αβγ-Syn−/−
A. Examples of connectors imaged by Cryo-ET and corresponding line diagrams. Computationally extracted tomographic 2nm thick, slices. Scale Bar = 100 nm. B. 3D visualization of connectors in wild type and αβγ-Syn−/−samples by Cryo-ET. C. Fraction of proximal SVs that have at least one connector in wild type (blue), αβγ-Syn−/− (green) and synuclein nulls rescued by human α-Syn expression (red). D. Fraction of intermediate SVs that have at least one connector in wild type, αβγ-Syn−/− and rescued synapses. p<0.05 and p<0.001 respectively by χ2 test E. The mean number of connectors per proximal SV in the three genotypes. F. The mean number of connectors per intermediate SV in synapses of the three genotypes. p<0.001 for both zones by χ2 test. N = 3 independent experiments. NS, not significant, ** p<0.01, *** p<0.001.
Figure 5
Figure 5. Distal SV Clusters in αβγ-Syn−/− Synapses
A. Representative micrographs of dissociated hippocampal neurons showing distal SV clusters are present in αβγ-Syn−/− synapses compared to wild type. iii–iv, Zoomed in regions from i and ii respectively, showing distal vesicles. Note that SVs are clustered and arrayed touching each other in αβγ-Syn−/− synapse. B. Quantification of percent of synapses with SV clusters in wild type (blue) and αβγ-Syn−/− (green) neurons at rest, after 90s stimulation with 45 mM K+ and subsequent recovery for 10 minutes. Note that the SV clusters disperse upon high K+ stimulation. N= 3 independent neuronal cultures, 50–150 synapses/genotype/culture were analyzed. C. Micrographs of CA1 synapses from wild type and αβγ-Syn−/− mice. D. Quantification of synapses with SV clusters in CA1 and CA3 regions of the brain. N= 2–3 mice/genotype Scale bar = 400nm; Scale Bar for Aiii–iv = 200 nm ** p<0.01, *** p<0.001.
Figure 6
Figure 6. Biochemical Changes in αβγ-Syn−/− in Candidate Proteins That Regulate SV Connectivity
A. Representative western blots of wild type and αβγ-Syn−/− synaptosomes for the denoted proteins. B. Quantification of levels of total and phosphorylated Amphiphysin-1. C. Quantification of phospho and dephospho amphipysin-2 in the two genotypes. D–I. Phosphorylation of synapsin I at site 1 (D), site 3 (E) and sites 4, 5 (F), Dynamin 1 site 774 (G), site 788 (H), Epsin1 (I) in wild type and αβγ-Syn−/− synaptosomes. N = 3 independent experiments. NS, not significant, * p<0.05; *** p<0.001.
Figure 7
Figure 7. α-Synuclein PD Mutants Primarily Alter Tethering
A. The SV distribution calculated as the fraction of cytoplasmic volume occupied by SVs in the first 250nm from the AZ of wild type (WT; blue), human α-synuclein overexpressing (hα-Syn; purple) and human A30P mutant α-synuclein (mauve) overexpressing transgenics. B. Western blotting of synaptosomes of the denoted genotypes. C. The mean distance of proximal SVs to the AZ, where the distance between a SV and the AZ is calculated as the minimal distance between them. p<0.05 by t-test. D. The mean number of proximal SVs/AZ area in wild type, hα-Syn and hA30P E. Fraction of proximal SVs that have at least one connector in WT, hα-Syn and hA30P overexpressing transgenic synapses. F. Fraction of intermediate SVs that have at least one connector in in wild type, hα-Syn and hA30P synapses. G. The mean number of connectors per proximal SV in the three genotypes. H. The mean number of connectors per intermediate SV in the three genotypes. I. Fraction of proximal SVs that have at least one tether in wild type, hα-Syn and hA30P. J. The mean number of tethers per proximal SV in the three genotypes. K. The number of proximal SVs with two or more greater tethers (structural RRP). p<0.01 by K-W test and p<0.05 by χ2 test, respectively. N = 3 independent experiments. NS, not significant, * p<0.05, ** p<0.01, *** p<0.001.

Comment in

References

    1. Altrock WD, tom Dieck S, Sokolov M, et al. Functional inactivation of a fraction of excitatory synapses in mice deficient for the active zone protein bassoon. Neuron. 2003;37(5):787–800. - PubMed
    1. Ambroso MR, Hegde BG, Langen R. Endophilin A1 induces different membrane shapes using a conformational switch that is regulated by phosphorylation. Proc Natl Acad Sci USA. 2014;111(19):6982–6987. - PMC - PubMed
    1. Atasoy D, Schoch S, Ho A, et al. Deletion of CASK in mice is lethal and impairs synaptic function. Proc Natl Acad Sci USA. 2007;104(7):2525–2530. - PMC - PubMed
    1. Bellucci A, Mercuri NB, Venneri A, et al. Review: Parkinson’s disease: from synaptic loss to connectome dysfunction. Neuropathol Appl Neurobiol. 2016;42(1):77–94. - PubMed
    1. Benfenati F, Valtorta F, Rossi MC, et al. Interactions of synapsin I with phospholipids: possible role in synaptic vesicle clustering and in the maintenance of bilayer structures. J Cell Biol. 1993;123(6 Pt 2):1845–1855. - PMC - PubMed

Publication types