

P21-activated kinase 1 regulates resistance to BRAF inhibition in human cancer cells
- PMID: 28052407
- PMCID: PMC5392142
- DOI: 10.1002/mc.22611
P21-activated kinase 1 regulates resistance to BRAF inhibition in human cancer cells
Abstract
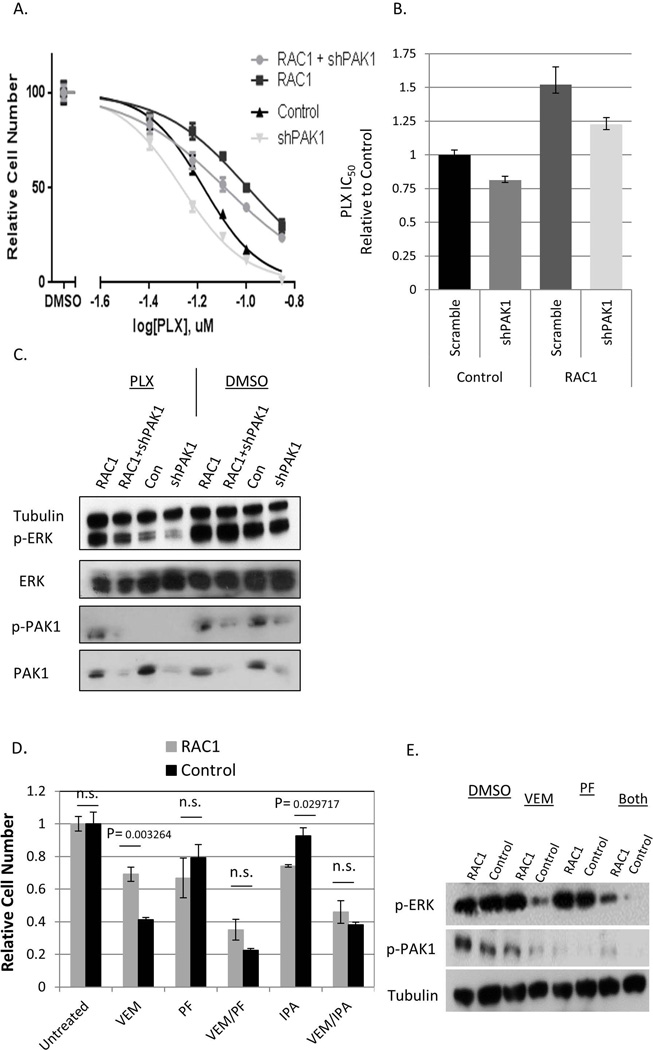
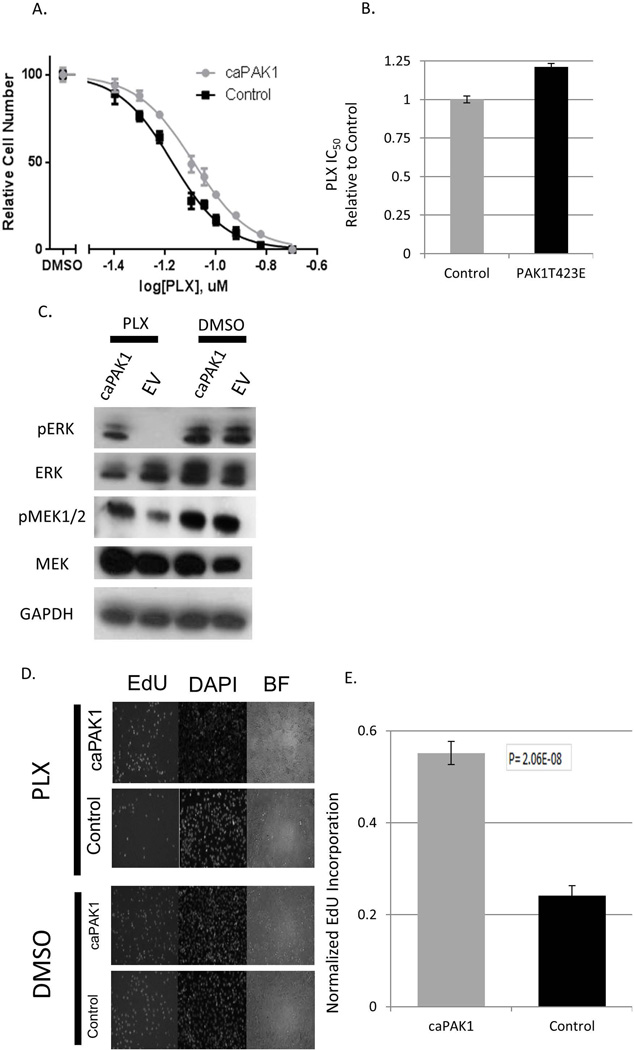
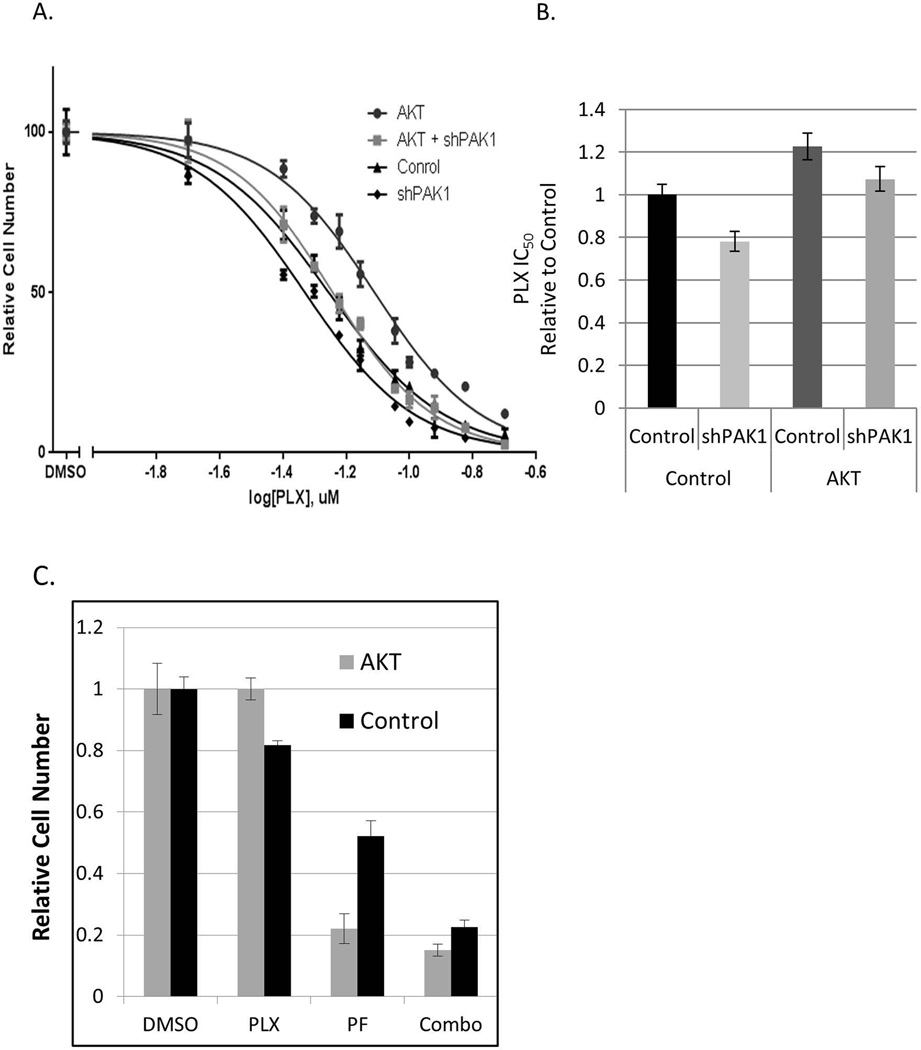
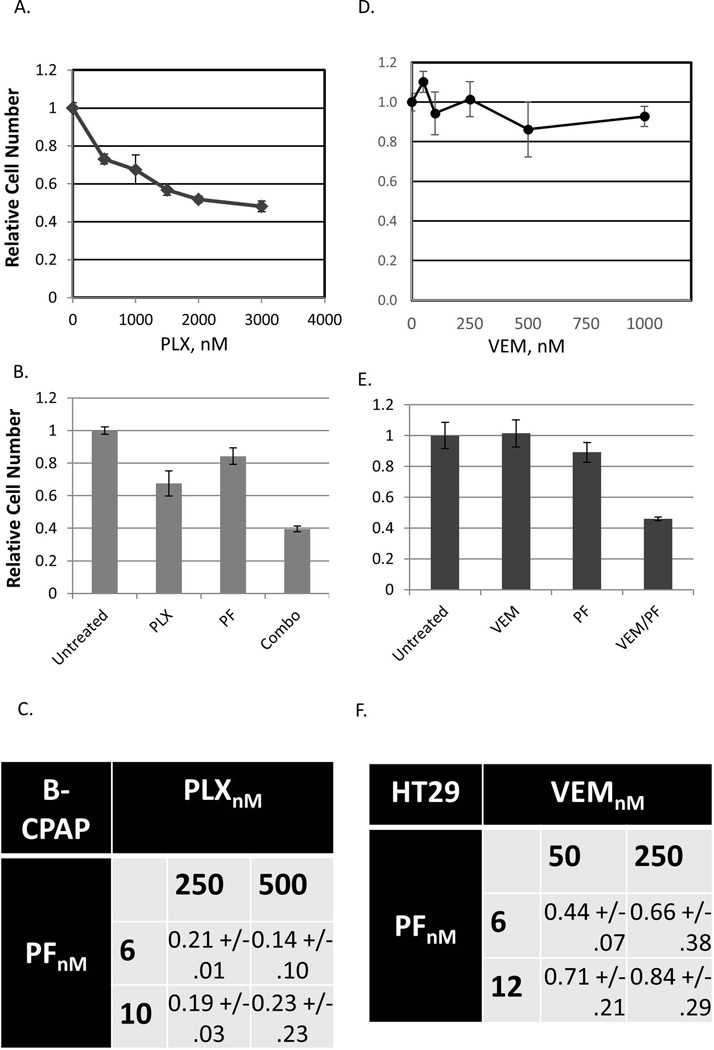
BRAF is a commonly mutated oncogene in various human malignancies and a target of a new class of anti-cancer agents, BRAF-inhibitors (BRAFi). The initial enthusiasm for these agents, based on the early successes in the management of metastatic melanoma, is now challenged by the mounting evidence of intrinsic BRAFi-insensitivity in many BRAF-mutated tumors, by the scarcity of complete responses, and by the inevitable emergence of drug resistance in initially responsive cases. These setbacks put an emphasis on discovering the means to increase the efficacy of BRAFi and to prevent or overcome BRAFi-resistance. We explored the role of p21-activated kinases (PAKs), in particular PAK1, in BRAFi response. BRAFi lowered the levels of active PAK1 in treated cells. An activated form of PAK1 conferred BRAFi-resistance on otherwise sensitive cells, while genetic or pharmacologic suppression of PAK1 had a sensitizing effect. While activation of AKT1 and RAC1 proto-oncogenes increased BRAFi-tolerance, the protective effect was negated in the presence of PAK inhibitors. Furthermore, combining otherwise ineffective doses of PAK- and BRAF-inhibitors synergistically affected intrinsically BRAFi-resistant cells. Considering the high incidence of PAK1 activation in cancers, our findings suggests PAK inhibition as a strategy to augment BRAFi therapy and overcome some of the well-known resistance mechanisms.
Keywords: AZD6244; MAP Kinase Cascade; PF3758309; melanoma; vemurafenib.
© 2017 Wiley Periodicals, Inc.
Figures
Similar articles
-
Silencing FLI or targeting CD13/ANPEP lead to dephosphorylation of EPHA2, a mediator of BRAF inhibitor resistance, and induce growth arrest or apoptosis in melanoma cells.Cell Death Dis. 2017 Aug 31;8(8):e3029. doi: 10.1038/cddis.2017.406. Cell Death Dis. 2017. PMID: 29048432 Free PMC article.
-
PAK signalling drives acquired drug resistance to MAPK inhibitors in BRAF-mutant melanomas.Nature. 2017 Oct 5;550(7674):133-136. doi: 10.1038/nature24040. Epub 2017 Sep 27. Nature. 2017. PMID: 28953887 Free PMC article.
-
Targeting ER stress-induced autophagy overcomes BRAF inhibitor resistance in melanoma.J Clin Invest. 2014 Mar;124(3):1406-17. doi: 10.1172/JCI70454. Epub 2014 Feb 24. J Clin Invest. 2014. PMID: 24569374 Free PMC article.
-
Implication of Unfolded Protein Response and Autophagy in the Treatment of BRAF Inhibitor Resistant Melanoma.Anticancer Agents Med Chem. 2016;16(3):291-8. doi: 10.2174/1871520615666150930105906. Anticancer Agents Med Chem. 2016. PMID: 26419469 Review.
-
A Review of the Molecular Pathways Involved in Resistance to BRAF Inhibitors in Patients with Advanced-Stage Melanoma.Med Sci Monit. 2020 Apr 10;26:e920957. doi: 10.12659/MSM.920957. Med Sci Monit. 2020. PMID: 32273491 Free PMC article. Review.
Cited by
-
PAK6 promotes homologous-recombination to enhance chemoresistance to oxaliplatin through ATR/CHK1 signaling in gastric cancer.Cell Death Dis. 2022 Jul 28;13(7):658. doi: 10.1038/s41419-022-05118-8. Cell Death Dis. 2022. PMID: 35902562 Free PMC article.
-
Reversal of Resistance in Targeted Therapy of Metastatic Melanoma: Lessons Learned from Vemurafenib (BRAFV600E-Specific Inhibitor).Cancers (Basel). 2018 May 24;10(6):157. doi: 10.3390/cancers10060157. Cancers (Basel). 2018. PMID: 29795041 Free PMC article. Review.
-
The role of polo-like kinase 3 in the response of BRAF-mutant cells to targeted anticancer therapies.Mol Carcinog. 2020 Jan;59(1):5-14. doi: 10.1002/mc.23123. Epub 2019 Sep 30. Mol Carcinog. 2020. PMID: 31571292 Free PMC article.
-
Exploring resistance to immune checkpoint inhibitors and targeted therapies in melanoma.Cancer Drug Resist. 2024 Oct 31;7:42. doi: 10.20517/cdr.2024.54. eCollection 2024. Cancer Drug Resist. 2024. PMID: 39534873 Free PMC article. Review.
-
A novel PAK1/TCF1 regulatory axis promotes non-small cell lung cancer progression.Discov Oncol. 2025 Mar 20;16(1):364. doi: 10.1007/s12672-025-02110-4. Discov Oncol. 2025. PMID: 40111665 Free PMC article.
References
-
- Bollag G, Tsai J, Zhang J, et al. Vemurafenib: the first drug approved for BRAF-mutant cancer. Nature reviews Drug discovery. 2012;11(11):873–886. - PubMed
-
- Hertzman Johansson C, Egyhazi Brage S. BRAF inhibitors in cancer therapy. Pharmacology & therapeutics. 2014;142(2):176–182. - PubMed
-
- Davies H, Bignell GR, Cox C, et al. Mutations of the BRAF gene in human cancer. Nature. 2002;417(6892):949–954. - PubMed
MeSH terms
Substances
Grants and funding
LinkOut - more resources
Full Text Sources
Other Literature Sources
Research Materials
Miscellaneous
