. 2017 Mar 1;312(3):F516-F532.
doi: 10.1152/ajprenal.00604.2016. Epub 2017 Jan 4.

Pericytes and immune cells contribute to complement activation in tubulointerstitial fibrosis

Affiliations

Pericytes and immune cells contribute to complement activation in tubulointerstitial fibrosis

Sandhya Xavier et al. Am J Physiol Renal Physiol. .

Abstract

We have examined the pathogenic role of increased complement expression and activation during kidney fibrosis. Here, we show that PDGFRβ-positive pericytes isolated from mice subjected to obstructive or folic acid injury secrete C1q. This was associated with increased production of proinflammatory cytokines, extracellular matrix components, collagens, and increased Wnt3a-mediated activation of Wnt/β-catenin signaling, which are hallmarks of myofibroblast activation. Real-time PCR, immunoblots, immunohistochemistry, and flow cytometry analysis performed in whole kidney tissue confirmed increased expression of C1q, C1r, and C1s as well as complement activation, which is measured as increased synthesis of C3 fragments predominantly in the interstitial compartment. Flow studies localized increased C1q expression to PDGFRβ-positive pericytes as well as to CD45-positive cells. Although deletion of C1qA did not prevent kidney fibrosis, global deletion of C3 reduced macrophage infiltration, reduced synthesis of C3 fragments, and reduced fibrosis. Clodronate mediated depletion of CD11bF4/80 high macrophages in UUO mice also reduced complement gene expression and reduced fibrosis. Our studies demonstrate local synthesis of complement by both PDGFRβ-positive pericytes and CD45-positive cells in kidney fibrosis. Inhibition of complement activation represents a novel therapeutic target to ameliorate fibrosis and progression of chronic kidney disease.

Keywords: C1q; C3; pericytes.


Figures

Fig. 1.
Fig. 1.
Analysis of the secretome of platelet-derived growth factor receptor-β (PDGFRβ)-positive pericytes isolated from sham and unilateral ureteral obstruction (UUO) mice. A: schematic representation of the procedure used for isolation of cells. B and C: SDS-PAGE separation (B) and 2D gel separation (C) of proteins isolated from pericyte supernatants from sham and day 3 UUO. Regions sliced for protein mass spectrometry analysis are marked in rectangular boxes. M, molecular weight marker.
Fig. 2.
Fig. 2.
Characterization of PDGFRβ-positive pericytes isolated from sham and UUO mice. A: real-time PCR analysis of fibrotic gene expression in sham and day 10 UUO pericytes (n = 3). B: Western blot for α-smooth muscle actin (α-SMA) in cell lysates from sham and day 10 UUO pericytes (n = 4). C: luminex analysis for chemokines and cytokines in culture supernatants from sham and day 10 UUO pericytes (n = 5). D: Topflash reporter assay for Wnt signaling in sham and day 10 UUO pericytes (n = 3). E: PCNA proliferation assay showing %proliferating cells in sham and day 10 UUO pericytes (n = 3). *P < 0.05. TGFβ1, transforming growth factor-β1; NS, not significant.
Fig. 3.
Fig. 3.
C1q expression in PDGFRβ-positive pericytes and whole kidney tissue from sham and UUO mice. A: C1q mRNA expression increases in pericytes cultured from UUO kidneys (n = 3). B: C1q expression is increased in the UUO mouse model of kidney injury (n = 5). C1qA (open bars), C1qB (gray bars), and C1qC (black bars) C: immunofluorescence staining showing increased C1q (green) expression in UUO kidneys in the interstitium on day 3 (D3) and day 10 (D10) and colocalization (white arrows) with α-SMA (red; original magnification ×200). Inset shows enlarged magnification of coexpression of C1q and α-SMA in the same interstitial cell. D: Western blot showing that C1q is secreted into the culture medium in pericytes from UUO kidneys but not in pericytes from sham kidneys, hC1q, human C1q protein used as positive control (n = 4). E: Western blot showing increased C1q protein in UUO kidneys on D3 and D10. *P < 0.05; **P < 0.001.
Fig. 4.
Fig. 4.
C1q expression increases in folic acid-treated mice. A: real-time PCR analysis for expression of C1qA, -B, and -C in pericyte cultures from vehicle- and folic acid-treated mice and in total kidneys of folic acid-treated mice 2 wk postinjection (n = 3). B: Western blot showing increased C1q protein in supernatants of PDGFRβ-positive pericytes cultured from vehicle and folic acid-treated mice and in total kidneys of folic acid mice. hC1q, human C1q protein used as positive control. C. immunofluorescence staining showing increased C1q (green) expression in folic acid-treated mice in the interstitium 2 wk postinjury and colocalization (white arrows) with α-SMA (red; original magnification, ×400). Inset shows enlarged magnification of coexpression of C1q and α-SMA in the same interstitial cell. *P < 0.05.
Fig. 5.
Fig. 5.
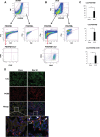
Flow cytometry analysis of kidney tissue from sham and UUO mice. A: flow analysis of kidney cell suspension from sham mice. B: flow analysis of kidney cell suspension from day 10 UUO mice showing PDGFRβ-positive and PDGFRβ-negative cells based on C1q staining. C: quantitation of cells as a fraction of live singlet cells (n = 3). *P < 0.05. C1q gating is based on an isotype control and a fluorescence minus one control to exclude any nonspecific signal. After dead cells were excluded using a live dead stain, followed by a forward scatter (FSC) vs. forward scatter width (FSCW) gating to include only single cells, the total %C1q-positive cells was quantified in the sham and UUO mice. The same gates were applied to UUO and sham samples. D: immunofluorescence staining showing increased C1q (green) expression in UUO kidneys in the interstitium on day 10 and colocalization with F4/80 (red; ×20 magnification). Inset is enlargement of dual-stained interstitial cells marked with white arrows. Arrowhead shows cells positive for C1q alone.
Fig. 6.
Fig. 6.
C1qA-deficient mice are not protected from fibrosis. A: real time PCR analysis for expression of complement genes in wild-type (WT; gray bars) and C1qA−/− (black bars) mouse kidneys (sham and day 7 UUO; n = 3). B: native gel electrophoresis for C3b expression in kidney lysates from sham and day 7 UUO mice (n = 3). C: comparison of picrosirius red staining for collagen deposition between WT and C1qA−/− day 7 UUO mice and quantitation of fibrotic areas (original magnification ×200). D: quantification of mRNA levels for fibrotic genes α-SMA, fibronectin, and collagen 1A1 in WT (gray bars) and C1qA−/− (black bars) mice subjected to UUO. (n = 3) E: quantification of endothelial cell adhesion marker expression (n = 4). *P < 0.05; **P < 0.001. NS, not significant.
Fig. 7.
Fig. 7.
C3 deficiency reduces complement expression, macrophage infiltration, and fibrosis during UUO. A: real-time PCR analysis for expression of complement genes in WT (gray bars) and C3−/− (black bars; sham and day 7 UUO) mice (n = 3). B: images showing increased staining for C3 fragments in the interstitium (white arrows) on day 7 UUO by immunohistochemistry; increased staining for α-SMA on day 7 UUO on frozen sections and increased infiltration of F4/80 cells in WT day 7 UUO mice (white arrows) when compared with WT sham and C3−/− UUO mice (histogram shows quantitation of F4/80-positive areas). Bottom: picrosirius red staining for collagen deposition in WT day 7 UUO mice (histogram shows quantitation of fibrotic areas; original magnification ×400). C: native gel electrophoresis for C3b expression in kidney lysates from sham and day 7 UUO mice (n = 3). D: real-time PCR analysis for expression of fibrotic genes in WT (gray bars) and C3−/− (black bars) mice (n = 4). *P < 0.05; **P < 0.001.
Fig. 8.
Fig. 8.
C3-deficient mice are protected from fibrosis in folic acid injury model. A: real-time PCR analysis for expression of complement genes in WT (gray bars) and C3−/− (black bars; control and folic acid-injected) mice 2 wk postinjection (n = 3). B: real-time PCR analysis for expression of fibrotic genes in WT (gray bars) and C3−/− (black bars) mice. (n = 4). C: images showing picrosirius red staining for collagen deposition in folic acid-treated mice, comparing WT control and C3−/− folic acid-treated mice (histogram shows quantitation of fibrotic areas; original magnification, ×200). *P < 0.05; **P < 0.001.
Fig. 9.
Fig. 9.
Flow cytometry analysis of C3 fragments in kidney cell suspensions of sham and day 7 UUO mice. A: gated population of live singlets positive for C3b (based on isotype control). B: C3b+ population gated for various markers, including CD45 (inflammatory cells), CD31 (endothelial cells), PDGFRβ (pericytes), and collectrin (proximal tubular cells). Bottom: histograms of the %live singlets positive for C3 and other markers (n = 3). C: real-time PCR analysis of kidney cell suspension enriched for CD45-positive population from sham and day 7 UUO mice using an anti-CD45 antibody column. This analysis shows increased mRNA levels for C1r, C1s, C3, C5, and receptors C3aR and C5aR in CD45-positive cells (n = 6). *P < 0.05. NS, not significant.
Fig. 10.
Fig. 10.
Macrophage depletion protects against fibrosis. A: scheme of clodronate-mediated macrophage depletion. B: kidney cell suspension of vehicle and clodronate-treated mice gated by CD11b. CD11b-positive cells were then gated for F480 and CD11c. Histogram shows F480hi population in kidneys as %live singlet cells (n = 4). C: real-time PCR analysis for expression of complement genes in vehicle (gray bars) and clodronate-treated (black bars) mice (n = 3). D: quantification of fibrotic gene expression in vehicle (gray bars) and clodronate-treated (black bars) mice (n = 4). E: images showing picrosirius red staining for collagen deposition in vehicle and clodronate-treated mice (original magnification, ×200). Histogram shows quantitation of fibrotic areas. *P < 0.05; NS, not significant.
Fig. 11.
Fig. 11.
Interstitial cell types that contribute to complement expression and activation during renal fibrosis.

Similar articles

Cited by

References

    1. Bao L, Wang Y, Haas M, Quigg RJ. Distinct roles for C3a and C5a in complement-induced tubulointerstitial injury. Kidney Int 80: 524–534, 2011. doi:10.1038/ki.2011.158. - DOI - PubMed
    1. Boor P, Konieczny A, Villa L, Schult AL, Bücher E, Rong S, Kunter U, van Roeyen CR, Polakowski T, Hawlisch H, Hillebrandt S, Lammert F, Eitner F, Floege J, Ostendorf T. Complement C5 mediates experimental tubulointerstitial fibrosis. J Am Soc Nephrol 18: 1508–1515, 2007. doi:10.1681/ASN.2006121343. - DOI - PubMed
    1. Bossi F, Tripodo C, Rizzi L, Bulla R, Agostinis C, Guarnotta C, Munaut C, Baldassarre G, Papa G, Zorzet S, Ghebrehiwet B, Ling GS, Botto M, Tedesco F. C1q as a unique player in angiogenesis with therapeutic implication in wound healing. Proc Natl Acad Sci U S A 111: 4209–4214, 2014. doi:10.1073/pnas.1311968111. - DOI - PMC - PubMed
    1. Byrum SD, Larson SK, Avaritt NL, Moreland LE, Mackintosh SG, Cheung WL, Tackett AJ. Quantitative proteomics identifies activation of hallmark pathways of cancer in patient melanoma. J Proteomics Bioinform 6: 43–50, 2013. doi:10.4172/jpb.1000260. - DOI - PMC - PubMed
    1. Byun SJ, Jeon IS, Lee H, Kim TY. IFN-gamma upregulates expression of the mouse complement C1rA gene in keratinocytes via IFN-regulatory factor-1. J Invest Dermatol 127: 1187–1196, 2007. doi:10.1038/sj.jid.5700660. - DOI - PubMed

Publication types

MeSH terms