. 2017 Apr 1;34(4):779-792.
doi: 10.1093/molbev/msw294.

Co-Option and De Novo Gene Evolution Underlie Molluscan Shell Diversity

Affiliations

Co-Option and De Novo Gene Evolution Underlie Molluscan Shell Diversity

Felipe Aguilera et al. Mol Biol Evol. .

Abstract

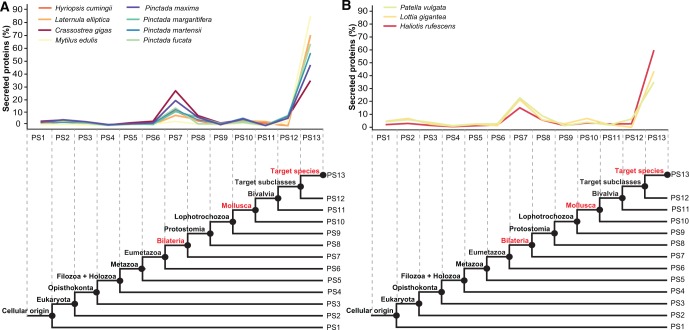
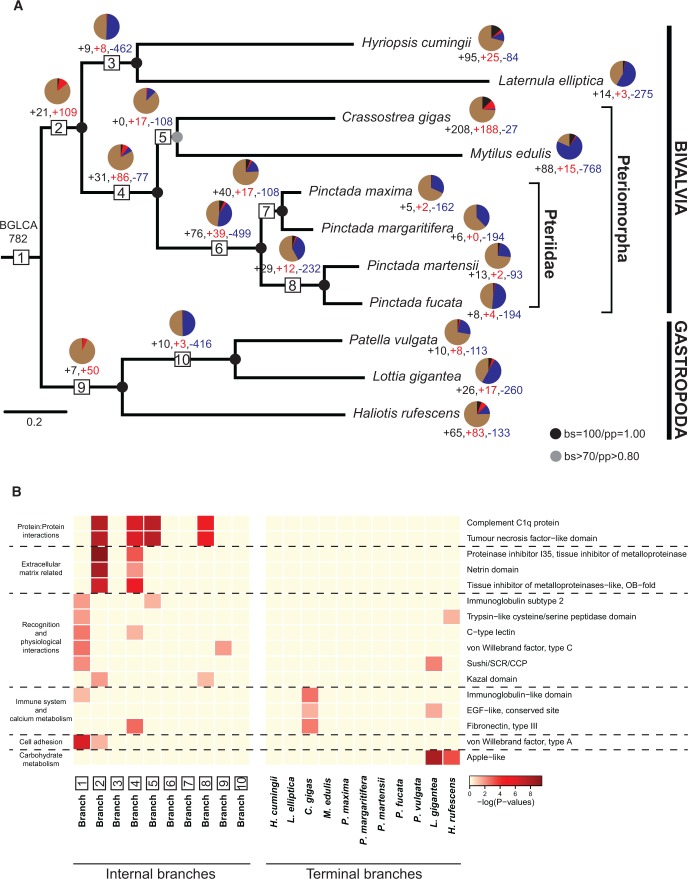
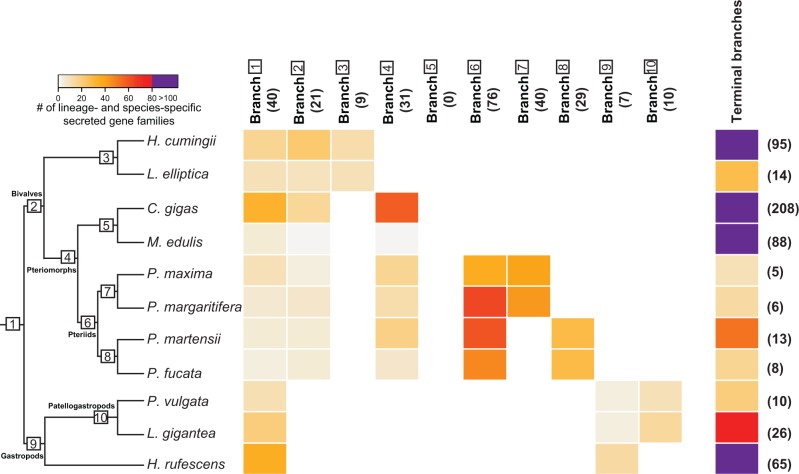
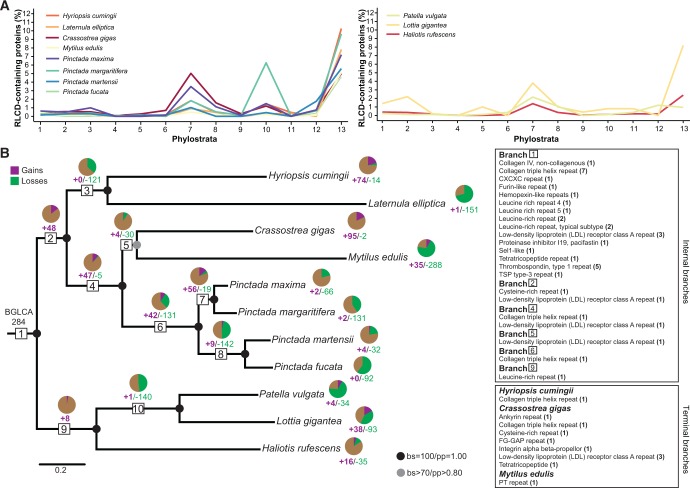
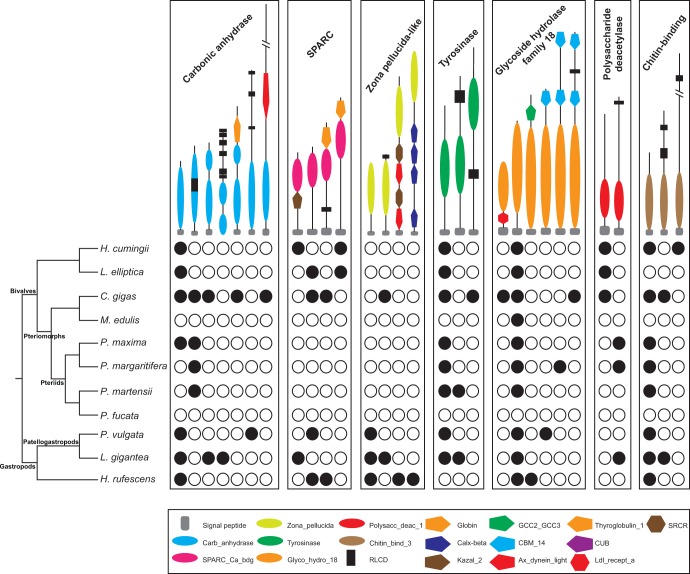
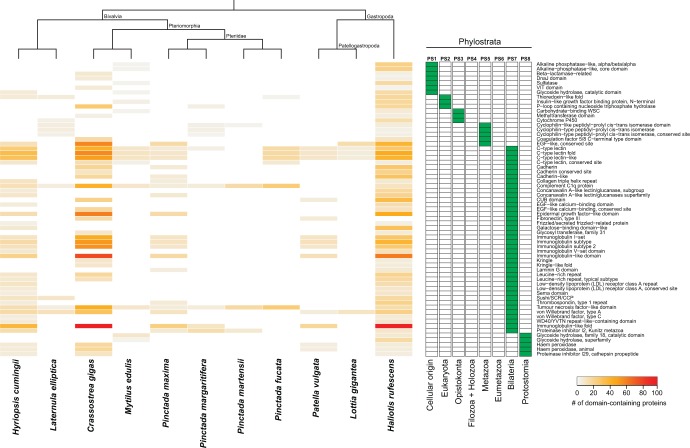
Molluscs fabricate shells of incredible diversity and complexity by localized secretions from the dorsal epithelium of the mantle. Although distantly related molluscs express remarkably different secreted gene products, it remains unclear if the evolution of shell structure and pattern is underpinned by the differential co-option of conserved genes or the integration of lineage-specific genes into the mantle regulatory program. To address this, we compare the mantle transcriptomes of 11 bivalves and gastropods of varying relatedness. We find that each species, including four Pinctada (pearl oyster) species that diverged within the last 20 Ma, expresses a unique mantle secretome. Lineage- or species-specific genes comprise a large proportion of each species' mantle secretome. A majority of these secreted proteins have unique domain architectures that include repetitive, low complexity domains (RLCDs), which evolve rapidly, and have a proclivity to expand, contract and rearrange in the genome. There are also a large number of secretome genes expressed in the mantle that arose before the origin of gastropods and bivalves. Each species expresses a unique set of these more ancient genes consistent with their independent co-option into these mantle gene regulatory networks. From this analysis, we infer lineage-specific secretomes underlie shell diversity, and include both rapidly evolving RLCD-containing proteins, and the continual recruitment and loss of both ancient and recently evolved genes into the periphery of the regulatory network controlling gene expression in the mantle epithelium.

Keywords: bivalve; co-option; gastropod; lineage-specific novelties; mantle secretome; shell formation.


Figures

F<sc>ig</sc>. 1.
Fig. 1.
Evolutionary origin of mantle genes encoding secreted proteins in different conchiferan taxa. Evolutionary origin of secreted mantle proteins for each bivalve (A) and gastropod (B) species with phylostrata (PS) depicted below. Phylostratum 12 corresponds to the subclass taxonomic rank for each bivalve (i.e., Palaeoheterodonta, Heterodonta and Pteriomorpha) and gastropod (i.e., Vetigastropoda and Patellogastropoda) species used in this study. Denoted in red are the three evolutionary periods associated with the emergence of most secreted proteins: the bilaterian stem (PS7), the mollusc stem (PS10), and taxon-restricted lineages (PS13).
F<sc>ig</sc>. 2
Fig. 2
Evolutionary history of conchiferan mantle secretome gene family evolution. (A) Organismal tree (ML topology) showing the relationship of bivalves and gastropods. Black circles represent nodes with BS = 100 and PP = 1.00, and the gray circle represents the node with BS > 70% and PP > 0.80. Gene family acquisition was divided into lineage-specific gains (black) and independent co-options (red). Based on comparison of gastropod and bivalve mantle secretomes, the bivalve and gastropod last common ancestor (1; BGLCA) expressed 782 mantle secretome genes that are shared between at least one gastropod and one bivalve. From this ancestral condition, the LCA of the bivalves (BLCA) included in this study (2; BLCA) evolved 21 bivalve-specific mantle secretome gene families (black text and pie wedge) and co-opted 109 ancestral gene families into the mantle secretome (red text and pie wedge); the brown portion of the pie represents the 782 genes contributed from the BGLCA ancestor. The LCA of Hyriopsis cumingii and Laternula elliptica (3) gained 9 and 8 novel and co-opted genes into the mantle secretome, and lost 462 gene families (blue text and pie wedge) compared with the BLCA. All remaining (4–10) ancestral reconstructions, along with the evolution of species-specific secretome repertoires, follow the same interpretations. Gene family losses and gains are calculated based on the Dollo parsimony principle and do not take into account the independent co-option of the same gene family twice. (B) Enrichment of protein domains across conchiferan evolution (i.e., internal and terminal branches). Protein domains significantly enriched (P < 0.05, Fisher’s exact test) and present in newly gained secreted gene families from at least two branches are shown. The yellow-to-red scale, based on −log(P values), indicates the level of enrichment. InterPro protein domain descriptions of the over-represented secreted gene families are shown at the right. Broad functional categories representing each protein domain are shown to the left. For a comprehensive list of enriched protein domains across conchiferan evolution, see supplementary table S4, Supplementary Material online.
F<sc>ig</sc>. 3.
Fig. 3.
Distribution and abundance of lineage- and species-specific secretome gene families across conchiferan evolution. Number of lineage- and species-specific secretome gene families depicted according to the color legend in the upper left. Black bold numbers in parenthesis depict the number of lineage-specific gene families at each evolutionary time point. These secreted gene families are grouped according to the phylogenetic tree shown in the left, where white squares with numbers indicate internal branches that correspond to figure 2A. Internal branches are indicated at the top of the heatmap, while terminal branches (i.e., species-specific secreted gene families) are indicated at the right. For the complete list of lineage- and species-specific secreted gene families, see supplementary table S7, Supplementary Material online.
F<sc>ig</sc>. 4.
Fig. 4.
Evolutionary dynamics of gain and loss of mantle secretome families with repetitive, low-complexity domains. (A) Phylostratigraphic maps of RLCD-containing proteins present in the secretomes of each bivalve (left panel) and gastropod (right panel) species. Phylostrata are labeled according to phylogenetic maps shown in figure 1. (B) Relationships among bivalve and gastropod lineages, depicting patterns of gains and losses of secreted gene families that contain RLCDs over conchiferan evolution. See figure 2A for a description on interpreting gene gain (purple) and loss (green). The pie charts display the proportion of secreted gene families that contain RLCD-containing proteins inherited from (brown), lost from (green) and gained since diverging from (purple) the previous node. The squares on the right represent RLCDs that show similarity with the InterPro sequence repeat database. Numbers in parenthesis indicate the number of secretome gene families that contain this specific RLCD. BGLCA: bivalve and gastropod last common ancestor.
F<sc>ig</sc>. 5.
Fig. 5.
Phylogenetic distribution of protein families with known domains associated with shell biomineralization. The domain architectures of secreted protein families are depicted at the top, and the key to protein domains at the bottom. A black and white dots indicate the presence and absence of a given protein domain architecture in the mantle secretome, respectively. Phylogenetic relationship among bivalve and gastropod species is shown to the left. RLCDs can vary between species and in most cases are not homologous. See supplementary figures S7–S11, Supplementary Material online for detailed Bayesian phylogenetic analysis for each mantle secreted gene family.
F<sc>ig</sc>. 6.
Fig. 6.
Distribution and abundance of enriched protein domains expressed in mantle secretomes. The heatmap depicts the number of domain-containing proteins expressed in the mantle secretome of a given species. Enriched protein domains (rows) are clustered according to their evolutionary origin (green boxes), and species (columns) are grouped according to their phylogenetic relationship. The eight phylostrata correspond to those in figure 1. Only enriched protein domains present in at least two species are shown. For a comprehensive list of enriched protein domains across phylostrata and species, see supplementary table S9, Supplementary Material online.

Similar articles

Cited by

References

    1. Aberer AJ, Krompass D, Stamatakis A.. 2013. Pruning rouge taxa improves phylogenetic accuracy: an efficient algorithm and webservice. Syst Biol. 62:162–166. - PMC - PubMed
    1. Aguilera F, McDougall C, Degnan BM.. 2014. Evolution of the tyrosinase gene family in bivalve molluscs: independent expansion of the mantle gene repertoire. Acta Biomater. 10:3855–3865. - PubMed
    1. Aguilera F, McDougall C, Degnan BM.. 2013. Origin, evolution and classification of type-3 copper proteins: lineage-specific gene expansions and losses across the Metazoa. BMC Evol Biol. 13:96.. - PMC - PubMed
    1. Al-Shahrour F, Minguez P, Tárraga J, Medina I, Alloza E, Montaner D, Dopazo J.. 2007. FatiGO+: a functional profiling tool for genomic data. Integration of functional annotation, regulatory motifs and interaction data with microarray experiments. Nucleic Acids Res. 35:W91–W96. - PMC - PubMed
    1. Bai Z, Zheng H, Lin J, Wang G, Li J.. 2013. Comparative analysis of the transcriptome in tissues secreting purple and white nacre in the pearl mussel Hyriopsis cumingii. PLoS One 8:e53617. - PMC - PubMed

Publication types

LinkOut - more resources