. 2017 Jan 4;37(1):97-109.
doi: 10.1523/JNEUROSCI.1671-16.2016.

Neural Variability Quenching Predicts Individual Perceptual Abilities

Affiliations

Neural Variability Quenching Predicts Individual Perceptual Abilities

Ayelet Arazi et al. J Neurosci. .

Abstract

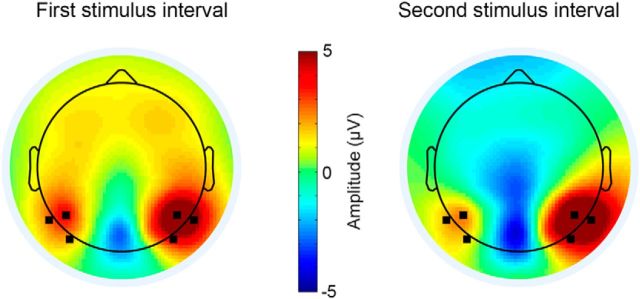
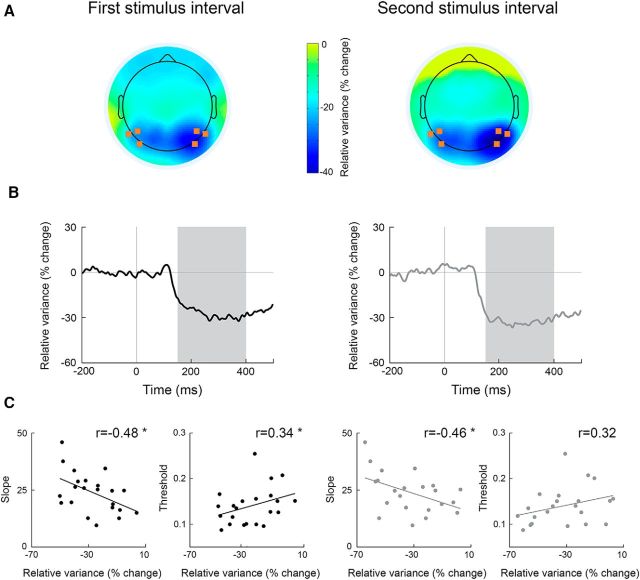
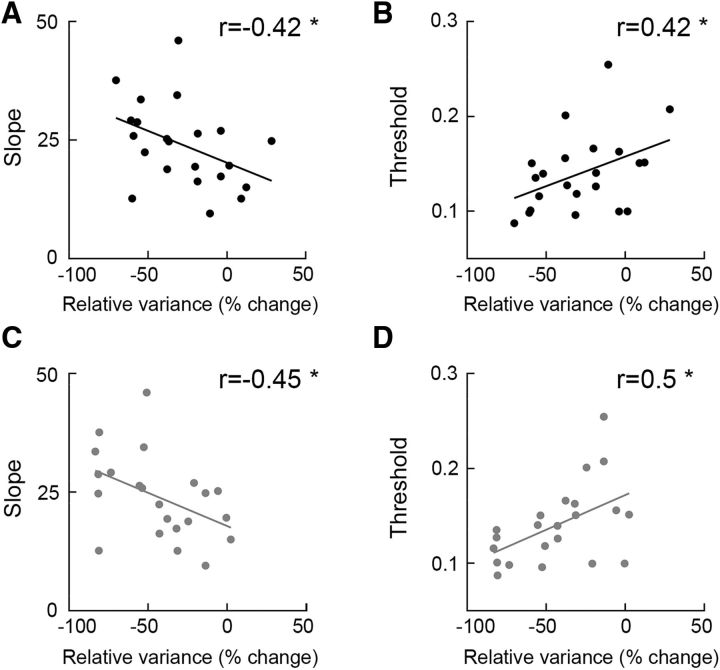
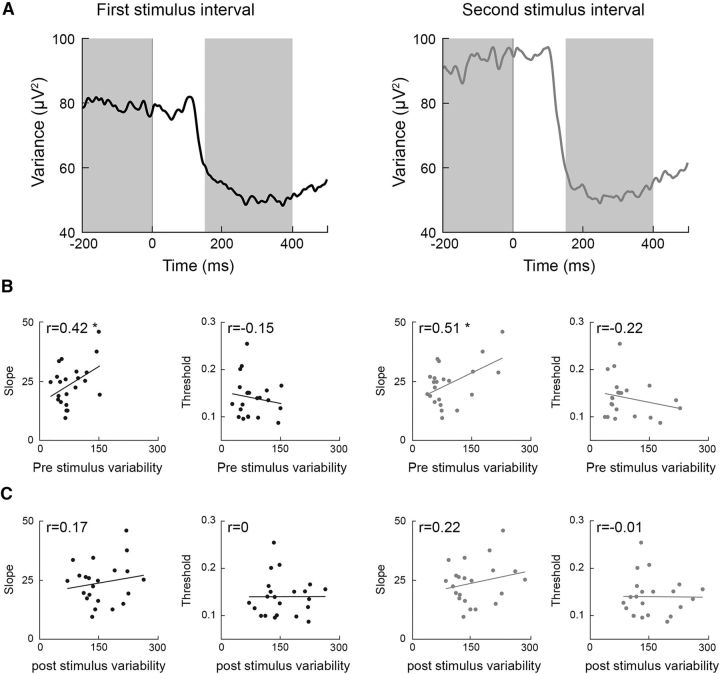
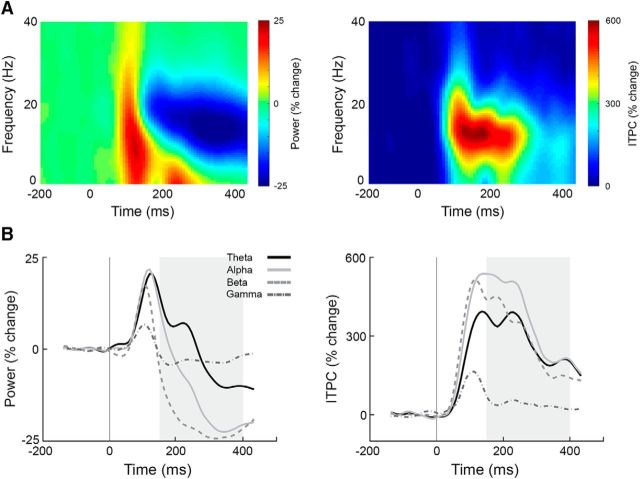
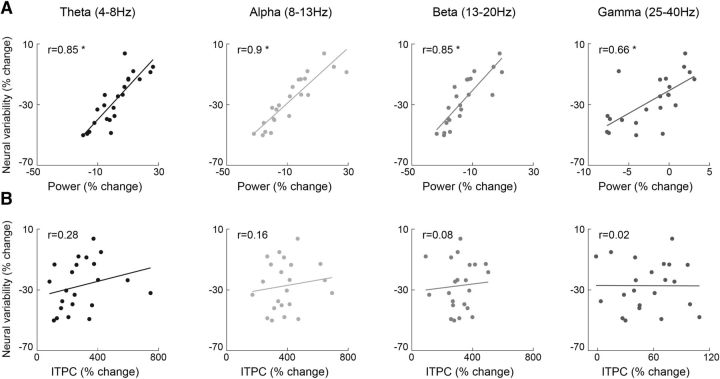
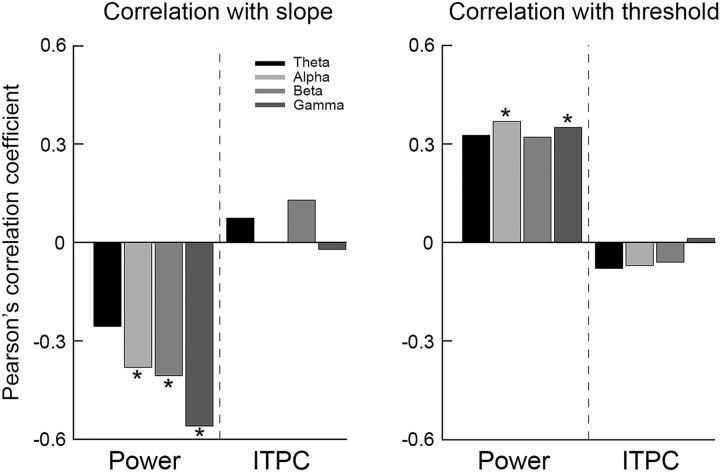
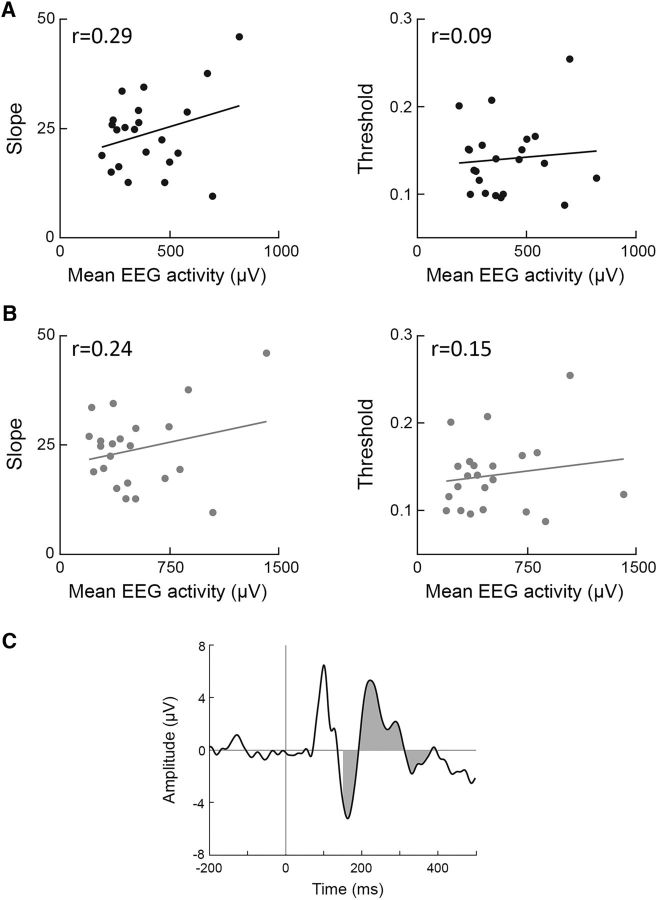
Neural activity during repeated presentations of a sensory stimulus exhibits considerable trial-by-trial variability. Previous studies have reported that trial-by-trial neural variability is reduced (quenched) by the presentation of a stimulus. However, the functional significance and behavioral relevance of variability quenching and the potential physiological mechanisms that may drive it have been studied only rarely. Here, we recorded neural activity with EEG as subjects performed a two-interval forced-choice contrast discrimination task. Trial-by-trial neural variability was quenched by ∼40% after the presentation of the stimulus relative to the variability apparent before stimulus presentation, yet there were large differences in the magnitude of variability quenching across subjects. Individual magnitudes of quenching predicted individual discrimination capabilities such that subjects who exhibited larger quenching had smaller contrast discrimination thresholds and steeper psychometric function slopes. Furthermore, the magnitude of variability quenching was strongly correlated with a reduction in broadband EEG power after stimulus presentation. Our results suggest that neural variability quenching is achieved by reducing the amplitude of broadband neural oscillations after sensory input, which yields relatively more reproducible cortical activity across trials and enables superior perceptual abilities in individuals who quench more.

Significance statement: Variability quenching is a phenomenon in which neural variability across trials is reduced by the presentation of a stimulus. Although this phenomenon has been reported across a variety of animal and human studies, its functional significance and behavioral relevance have been examined only rarely. Here, we report novel empirical evidence from humans revealing that variability quenching differs dramatically across individual subjects and explains to a certain degree why some individuals exhibit better perceptual abilities than others. In addition, we found a strong relationship between variability quenching and suppression of broadband neural oscillations. Together, our results reveal the importance of reproducible cortical activity for enabling better perceptual abilities and suggest a potential underlying mechanism that may explain why variability quenching occurs.

Keywords: EEG; trial by trial neural variability; variability quenching; visual perception.


Figures

Figure 1.
Figure 1.
Experimental design and EEG responses. A,2IFC contrast discrimination task included the presentation of two consecutive stimuli. Each stimulus was presented for 100 ms and was followed by a 900 ms blank screen. Subjects were instructed to press a button to report which stimulus was of higher contrast when the fixation cross appeared. One of the two stimuli was always at base contrast (100%) and the other was of lower contrast. B, EEG recordings from single trials containing the base stimulus. Colored lines represent single trials and the black line represents the mean ERP. This example presents trials from the first stimulus interval of a single subject (electrode PO8).
Figure 2.
Figure 2.
Visual system responses. Topographic maps (mean across subjects) of the P100 response in the first (left) and second (right) stimulus intervals. We selected the electrodes marked in black (P6, P8, PO8, P5, P7, and PO7) for further analyses.
Figure 3.
Figure 3.
Neural variability quenching predicts perceptual performance. Neural variability quenching was estimated in the first (left) and second (right) stimulus intervals. A, Topographic maps (mean across subjects) representing the level of variability quenching 150–400 ms after stimulus presentation. B, Time courses of trial-by-trial variability in percentage change units demonstrating the decrease in neural variability after stimulus presentation (mean across electrodes noted in A and across subjects). Because neural variability decreased and remained stable between 150 and 400 ms after stimulus presentation (marked in gray), we estimated the level of variability quenching for each subject as the mean across this time window. C, Correlations between relative neural variability (quenching) and psychometric function slope (left) or contrast discrimination thresholds (right). Each dot represents a single subject. Asterisks indicate significant correlations as assessed by a randomization test (p < 0.05).
Figure 4.
Figure 4.
Neural variability quenching predicts perceptual performance also when examining the EEG data after extracting the visual ICA components (see Materials and Methods). Correlations between variability quenching as estimated in the first (A, B) and second (C, D) stimulus intervals and psychometric function measures (slope and threshold). Each dot represents a single subject. Asterisks indicate significant correlations assessed by a randomization test (p < 0.05).
Figure 5.
Figure 5.
Alternative measures of variability quenching explain individual perceptual performance in a similar manner demonstrating the robustness of this relationship. Correlation coefficients between individual magnitudes of variability quenching and perceptual performance estimates (slope and threshold) when using absolute difference between neural variability in the pre (−200 to 0 ms) and post (150–400 ms) stimulus intervals (A) and the ratio between neural variability in the prestimulus (−200 to 0 ms) and poststimulus (150–400 ms) intervals (B). Asterisks indicate significant correlations assessed by a randomization test (p < 0.05).
Figure 6.
Figure 6.
Absolute neural variability in the prestimulus interval, but not the poststimulus interval, predicts perceptual performance. A, Time courses of absolute trial-by-trial variability in the first (left) and second (right) stimulus intervals. B, Correlations between perceptual measures (slope and threshold) and prestimulus variability. C, Correlations between perceptual measures (slope and threshold) and poststimulus variability. Each dot represents a single subject. Asterisks indicate significant correlations as assessed by a randomization analysis (p < 0.05).
Figure 7.
Figure 7.
Spectral power and ITPC dynamics (mean across all subjects). A, Time–frequency spectrograms of the spectral power (left) and ITPC (right) demonstrating the change in power and phase coherence as a function of time, with color representing the amplitude of change relative to the prestimulus interval (−200 to 0 ms) in percentage change units. B, Time courses of four frequency bands: theta (4–7 Hz; black lines), alpha (8–13 Hz; light gray lines), beta (14–20 Hz; light gray dotted lines), and low-gamma (25–40 Hz; dark gray dotted line). Area marked in gray (150–400 ms) corresponds to time window with sustained neural variability quenching in Figure 3.
Figure 8.
Figure 8.
Variability quenching is related to decreased power but not to increased ITPC. A, Scatter plots demonstrating the relationship between neural variability quenching and spectral power. B, Scatter plots demonstrating the relationship between neural variability quenching and ITPC. Correlations were assessed for four frequency bands: theta (4–7 Hz), alpha (8–13 Hz), beta (14–20 Hz), and low-gamma (25–40 Hz). Each dot represents single subjects. Asterisks indicate significant correlations as assessed by a randomization analysis (p < 0.05).
Figure 9.
Figure 9.
Better perceptual performance is associated with decreased power rather than increased ITPC. Pearson's correlation coefficients describing the relationships between psychometric function slope (left) or discrimination threshold (right) and spectral power or ITPC as estimated in four frequency bands: theta (black), alpha (light gray) beta (gray), and low-gamma (dark gray). Asterisks indicate significant correlations as assessed by a randomization analysis (p < 0.05).
Figure 10.
Figure 10.
Mean EEG activity was not associated with perceptual measures. Shown are scatter plots demonstrating the relationship between mean EEG activity and psychometric function slope (left) or discrimination threshold (right) in the first (A) or second (B) stimulus interval. Each dot represents a single subject and Pearson's correlation coefficients are noted in each panel. C, Example demonstrating the calculation of the mean EEG response with the ERP of a single electrode in a single subject. Gray indicates area under the curve 150–400 ms after stimulus presentation.
Figure 11.
Figure 11.
Individual magnitudes of variability quenching were not correlated with different sources of measurement noise. A, Correlation between variability quenching and gaze variability across trials in the first (left) and second (right) stimulus intervals. B, Correlation between variability quenching and electrode offset variability across trials in the first (left) and second (right) stimulus intervals. C, Correlation between variability quenching and the goodness-of-fit of individual psychometric functions in the first (left) and second (right) stimulus intervals. Each point represents a single subject. Correlation coefficients are noted in each panel.

References

    1. Aihara T, Kitajo K, Nozaki D, Yamamoto Y. Internal noise determines external stochastic resonance in visual perception. Vision Res. 2008;48:1569–1573. doi: 10.1016/j.visres.2008.04.022. - DOI - PubMed
    1. Arieli A, Sterkin A, Grinvald A, Aertsen A. Dynamics of ongoing activity: explanation of the large variability in evoked cortical responses. Science. 1996;273:1868–1871. doi: 10.1126/science.273.5283.1868. - DOI - PubMed
    1. Babiloni C, Vecchio F, Bultrini A, Luca Romani G, Rossini PM. Pre- and poststimulus alpha rhythms are related to conscious visual perception: a high-resolution EEG study. Cereb Cortex. 2006;16:1690–1700. - PubMed
    1. Brainard DH. The psychophysics toolbox. Spat Vis. 1997;10:433–436. doi: 10.1163/156856897X00357. - DOI - PubMed
    1. Burgess AE, Colborne B. Visual signal detection. IV. Observer inconsistency. J Opt Soc Am A. 1988;5:617–627. doi: 10.1364/JOSAA.5.000617. - DOI - PubMed

LinkOut - more resources