. 2017 Jan 4;37(1):217-225.
doi: 10.1523/JNEUROSCI.1353-16.2016.

Habenula-Induced Inhibition of Midbrain Dopamine Neurons Is Diminished by Lesions of the Rostromedial Tegmental Nucleus

Affiliations

Habenula-Induced Inhibition of Midbrain Dopamine Neurons Is Diminished by Lesions of the Rostromedial Tegmental Nucleus

P Leon Brown et al. J Neurosci. .

Abstract

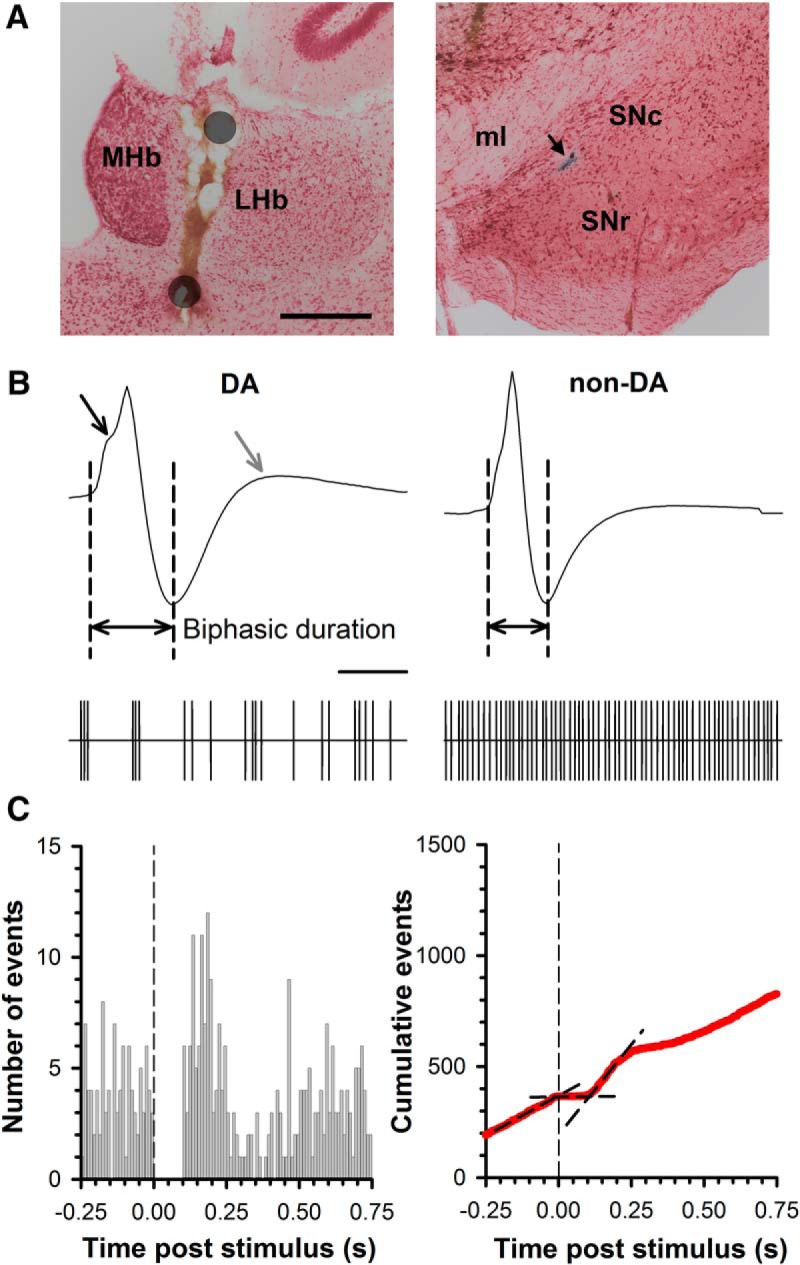
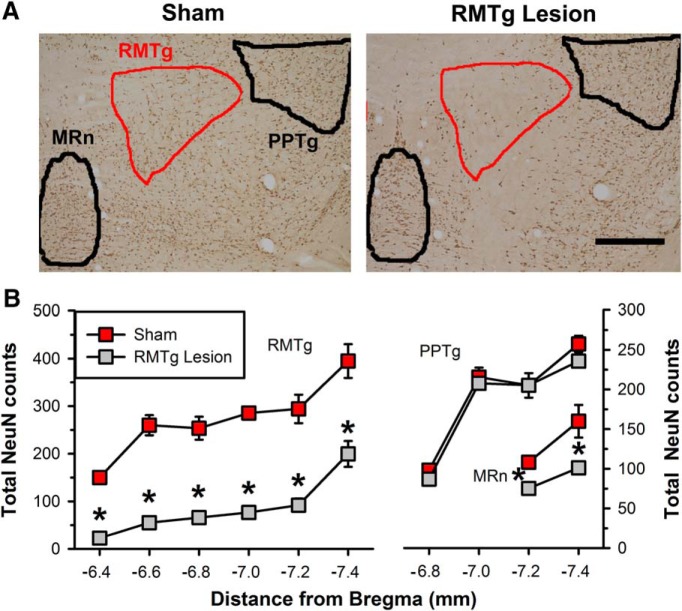
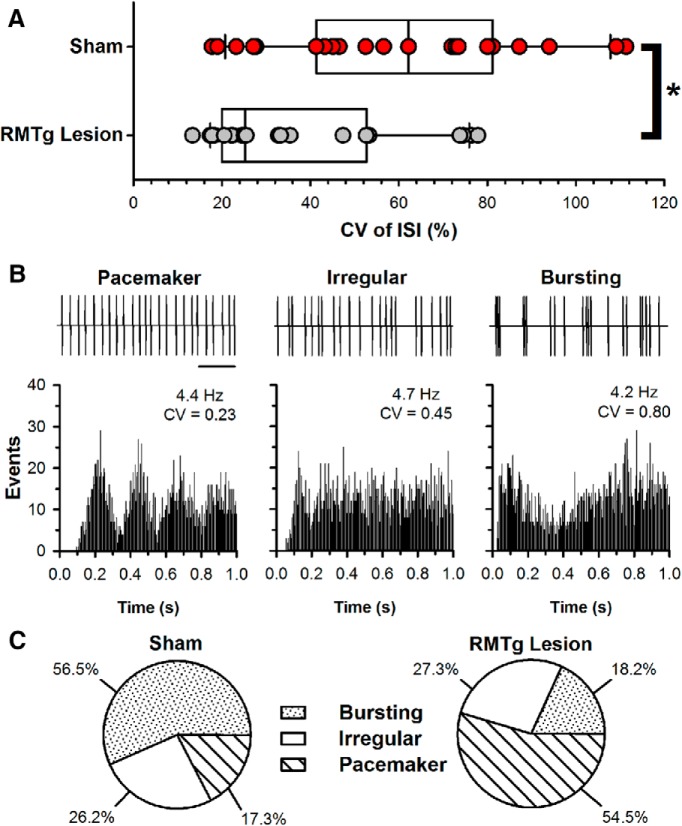
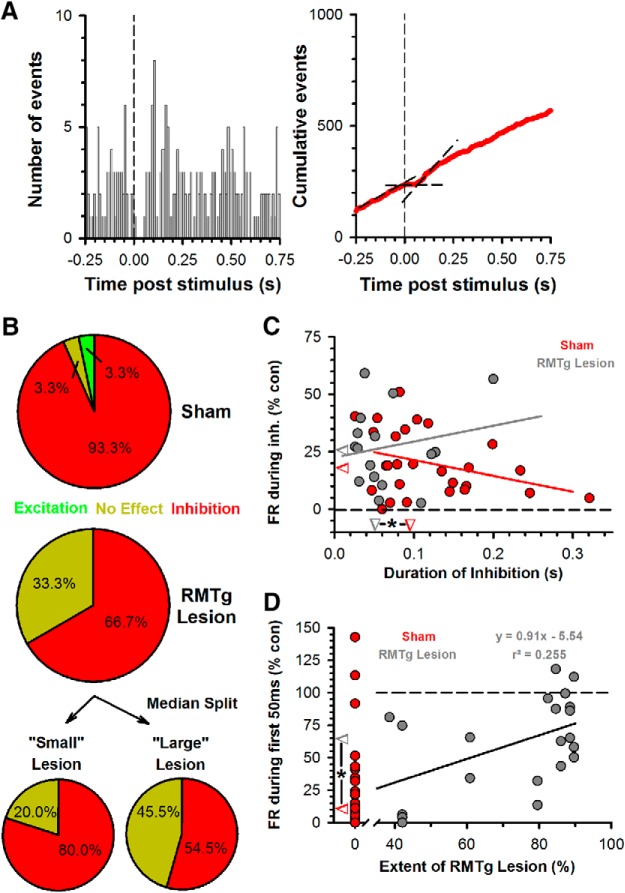
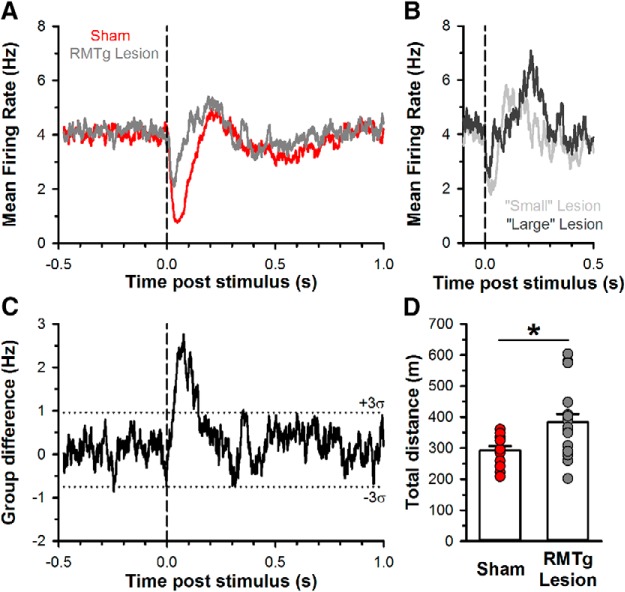
Neurons in the lateral habenula (LHb) are transiently activated by aversive events and have been implicated in associative learning. Functional changes associated with tonic and phasic activation of the LHb are often attributed to a corresponding inhibition of midbrain dopamine (DA) neurons. Activation of GABAergic neurons in the rostromedial tegmental nucleus (RMTg), a region that receives dense projections from the LHb and projects strongly to midbrain monoaminergic nuclei, is believed to underlie the transient inhibition of DA neurons attributed to activation of the LHb. To test this premise, the effects of axon-sparing lesions of the RMTg were assessed on LHb-induced inhibition of midbrain DA cell firing in anesthetized rats. Quinolinic acid lesions decreased the number of NeuN-positive neurons in the RMTg significantly while largely sparing cells in neighboring regions. Lesions of the RMTg reduced both the number of DA neurons inhibited by, and the duration of inhibition resulting from, LHb stimulation. Although the firing rate was not altered, the regularity of DA cell firing was increased in RMTg-lesioned rats. Locomotor activity in an open field was also elevated. These results are the first to show that RMTg neurons contribute directly to LHb-induced inhibition of DA cell activity and support the widely held proposition that GABAergic neurons in the mesopontine tegmentum are an important component of a pathway that enables midbrain DA neurons to encode the negative valence associated with failed expectations and aversive stimuli.

Significance statement: Phasic changes in the activity of midbrain dopamine cells motivate and guide future behavior. Activation of the lateral habenula by aversive events inhibits dopamine neurons transiently, providing a neurobiological representation of learning models that incorporate negative reward prediction errors. Anatomical evidence suggests that this inhibition occurs via the rostromedial tegmental nucleus, but this hypothesis has yet to be tested directly. Here, we show that axon-sparing lesions of the rostromedial tegmentum attenuate habenula-induced inhibition of dopamine neurons significantly. These data support a substantial role for the rostromedial tegmentum in habenula-induced feedforward inhibition of dopamine neurons.

Keywords: RMTg; firing pattern; prediction error; salience; tVTA.


Figures

Figure 1.
Figure 1.
Representative electrode placements and electrophysiological properties of midbrain DA and non-DA neurons. A, Photomicrograph of stimulating electrode placement (left) and recording location (right). The position of the two poles of the stimulating electrode are approximated by the gray circles, with current flow between the poles confined largely to the LHb. A blue dye spot (arrow) marks the location of cell recording within the SNc. Scale bar, 0.4 mm. MHb, Medial habenula; SNr, substantia nigra pars reticulate; ml, medial lemniscus. B, Representative DA (left) and non-DA (right) action potential waveform (top) and spike train event marker (bottom). Note that the DA neuron waveform has a prolonged biphasic duration, a “notch” in the rising phase (black arrow), and a pronounced third phase (gray arrow) relative to the non-DA waveform. In addition, the DA neuron is slower firing and sometimes has bursting activity, in contrast to the high-frequency, regular activity common to non-DA neurons. Scale bar, 1 ms (waveform), 1 s (spike train event marker). C, Example of a peristimulus time histogram (left) and CUMSUM plot (right) from a DA neuron initially inhibited by LHb stimulation. At the time of stimulation (vertical dashed line), there is a transient inhibition in spontaneous activity that translates into a zero slope in the CUMSUM plot as demarked by the second black line. In this example, the inhibition is followed by a rebound excitation (third black line).
Figure 2.
Figure 2.
Neuronal loss in the mesopontine tegmentum after QA injection. A, Representative photomicrographs of a sham-treated (left) and RMTg-lesioned (right) rat midbrain (∼−7.2 mm caudal to bregma) immunostained for NeuN with overlaid boundaries of the RMTg (red), MRn, and PPTg (black). Scale bar, 0.4 mm. B, Total NeuN-positive cell counts (mean ± SEM) within the boundaries of the RMTg, MRn, and PPTg by distance to bregma for sham (red squares, n = 4 all areas) and RMTg-lesioned (gray squares, n = 16 RMTg, n = 19 MRn and PPTg) rats. NeuN cell counts after lesion were significantly reduced in both the RMTg and MRn both overall (see text) and at each AP coordinate relative to sham-treated rats. *p < 0.05, Fisher's test.
Figure 3.
Figure 3.
Effects of RMTg lesions on the basal firing properties of midbrain DA neurons. A, Distribution of ISI CV for neurons from sham (n = 23) and RMTg-lesioned (n = 22) rats superimposed on box-and-whisker plots illustrating the median, IQR, and 5–95% range. CV was significantly reduced in RMTg-lesioned rats. *p < 0.05, Mann–Whitney test. B, Representative samples of spike train event markers associated with pacemaker, irregular, and bursting DA cells (top) with corresponding autocorrelograms (bottom). Note that, despite having similar firing rates, these neurons have different CVs. Scale bar, 1 s. C, Pie charts illustrating the prevalence of pacemaker, irregular, and burst-firing neurons in sham-operated (left) and RMTg-lesioned (right) rats.
Figure 4.
Figure 4.
Effects of RMTg lesions on the response of DA neurons to LHb stimulation. A, Example of a peristimulus time histogram (left) and CUMSUM plot (right) from a DA neuron initially inhibited by LHb stimulation (vertical dashed line) in an RMTg-lesioned rat. Note the shorter duration of inhibition compared with the sham control example in Figure 1. B, Pie charts illustrating the prevalence of neurons exhibiting excitation, no effect, or inhibition in response to LHb stimulation in sham-operated (top) and RMTg-lesioned (middle) rats. A median split by lesion size of the RMTg-lesioned group is also shown (bottom; see text for details). C, Scatterplot of the duration of inhibition (abscissa) versus the magnitude of inhibition expressed as a percentage of control firing rate (ordinate) for neurons inhibited by LHb stimulation in sham (red, n = 28) and RMTg-lesioned (gray, n = 16) rats. Straight lines represent regression lines for the sham (red; Pearson's r(26) = −0.34, p = 0.077) and RMTg-lesioned (gray; Pearson's r(14) = 0.19, p = 0.481) groups. Median values for both groups are demarcated on the axes by correspondingly colored triangles. Note that RMTg-lesioned rats had a significantly shorter duration of inhibition overall (*, see text). Although the slopes have a different valence, they are not significantly different (t(40) = −1.53, p = 0.134). D, Scatterplot for RMTg-lesioned rats (gray) illustrating the percentage of neuronal loss in lesioned rats (abscissa) versus the percentage change in firing rate for the first 50 ms after LHb stimulation relative to baseline (ordinate). Sham rats (red) are shown at zero percentage for comparison. Median values for both groups are demarcated on the ordinate by correspondingly colored triangles and were significantly different (*, see text). A significant linear trend was present among RMTg-lesioned rats, with the percentage of neurons lost to the lesion correlating with a decrease in LHb-stimulation induced inhibition. Note that, in rats with the greatest lesion-induced cell loss, some cells showed a slight excitation in response to LHb stimulation. Only rats with fully quantified lesions were included in this analysis.
Figure 5.
Figure 5.
Effect of RMTg lesions on both mean firing rate of all sampled DA neurons in response to LHb stimulation and open-field activity. A, Average peristimulus time histogram of firing rate for all DA neurons in both sham (red) and RMTg lesioned (gray) rats using 1 ms bins with a 25 bin exponential weighted moving average (see Materials and Methods for details). After LHb stimulation (vertical dashed line), DA neurons from RMTg-lesioned rats displayed an attenuated inhibition relative to sham rats. B, Average peristimulus time histogram of firing rate for all DA neurons in RMTg-lesioned rats using a median split by lesion size to form small (light gray) and large (dark gray) lesion groups. The average duration of inhibition appears to be shorter in the larger lesion group compared with the small lesion group, likely reflecting the trend for more neurons in the large lesion group to show no response to LHb stimulation. C, Difference in firing rate between groups from Figure 5A. SD of the delta scores was calculated from the baseline period preceding LHb stimulation (vertical dashed line); horizontal dotted lines represent a 3 σ deviation from the mean delta score. D, Bar graph of mean total distance traveled in an open field overlaid with individual scores from sham (n = 13, red) and RMTg-lesioned (n = 18, gray) rats. *p < 0.05, t test. Note that all sham data points are lower than the mean value for the RMTg-lesioned group.

References

    1. Balcita-Pedicino JJ, Omelchenko N, Bell R, Sesack SR. The inhibitory influence of the lateral habenula on midbrain dopamine cells: ultrastructural evidence for indirect mediation via the rostromedial mesopontine tegmental nucleus. J Comp Neurol. 2011;519:1143–1164. doi: 10.1002/cne.22561. - DOI - PMC - PubMed
    1. Bayer HM, Glimcher PW. Midbrain dopamine neurons encode a quantitative reward prediction error signal. Neuron. 2005;47:129–141. doi: 10.1016/j.neuron.2005.05.020. - DOI - PMC - PubMed
    1. Benabid AL, Jeaugey L. Cells of the rat lateral habenula respond to high-threshold somatosensory inputs. Neurosci Lett. 1989;96:289–294. doi: 10.1016/0304-3940(89)90393-5. - DOI - PubMed
    1. Bourdy R, Sánchez-Catalán MJ, Kaufling J, Balcita-Pedicino JJ, Freund-Mercier MJ, Veinante P, Sesack SR, Georges F, Barrot M. Control of the nigrostriatal dopamine neuron activity and motor function by the tail of the ventral tegmental area. Neuropsychopharmacology. 2014;39:2788–2798. doi: 10.1038/npp.2014.129. - DOI - PMC - PubMed
    1. Brinschwitz K, Dittgen A, Madai VI, Lommel R, Geisler S, Veh RW. Glutamatergic axons from the lateral habenula mainly terminate on GABAergic neurons of the ventral midbrain. Neuroscience. 2010;168:463–476. doi: 10.1016/j.neuroscience.2010.03.050. - DOI - PubMed

Publication types

LinkOut - more resources