. 2017 Jan 4;37(1):226-235.
doi: 10.1523/JNEUROSCI.1577-16.2016.

Retinal and Nonretinal Contributions to Extraclassical Surround Suppression in the Lateral Geniculate Nucleus

Affiliations

Retinal and Nonretinal Contributions to Extraclassical Surround Suppression in the Lateral Geniculate Nucleus

Tucker G Fisher et al. J Neurosci. .

Abstract

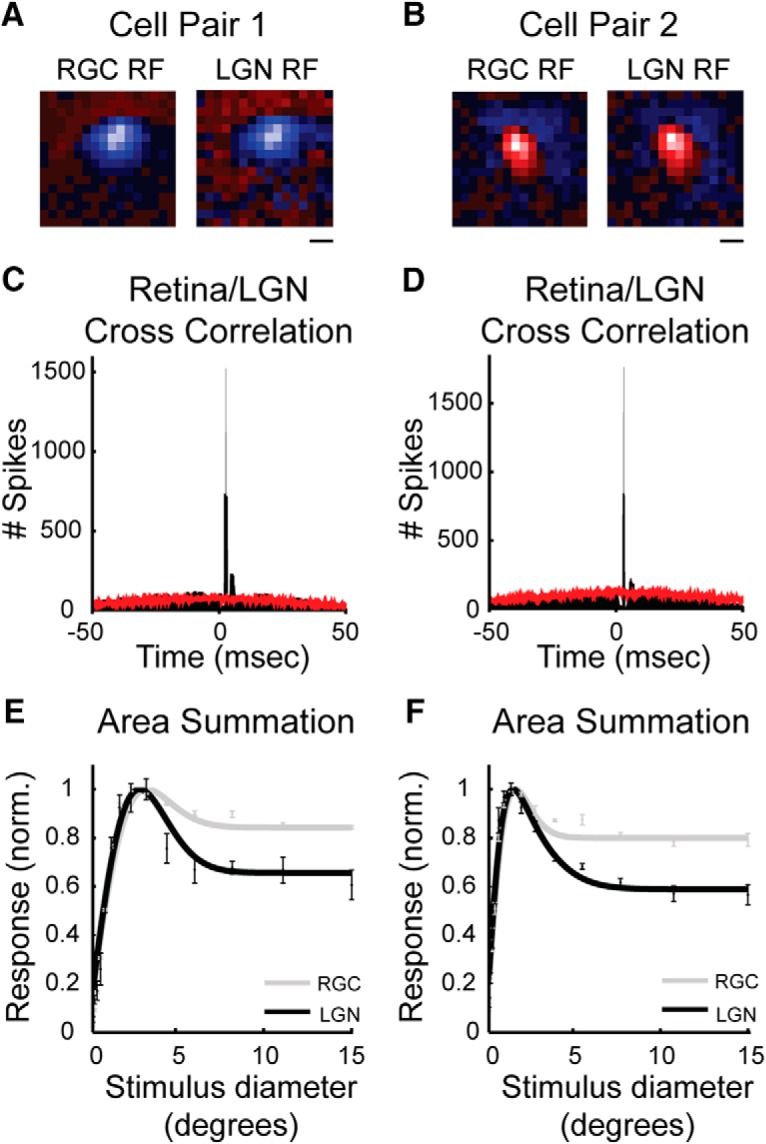
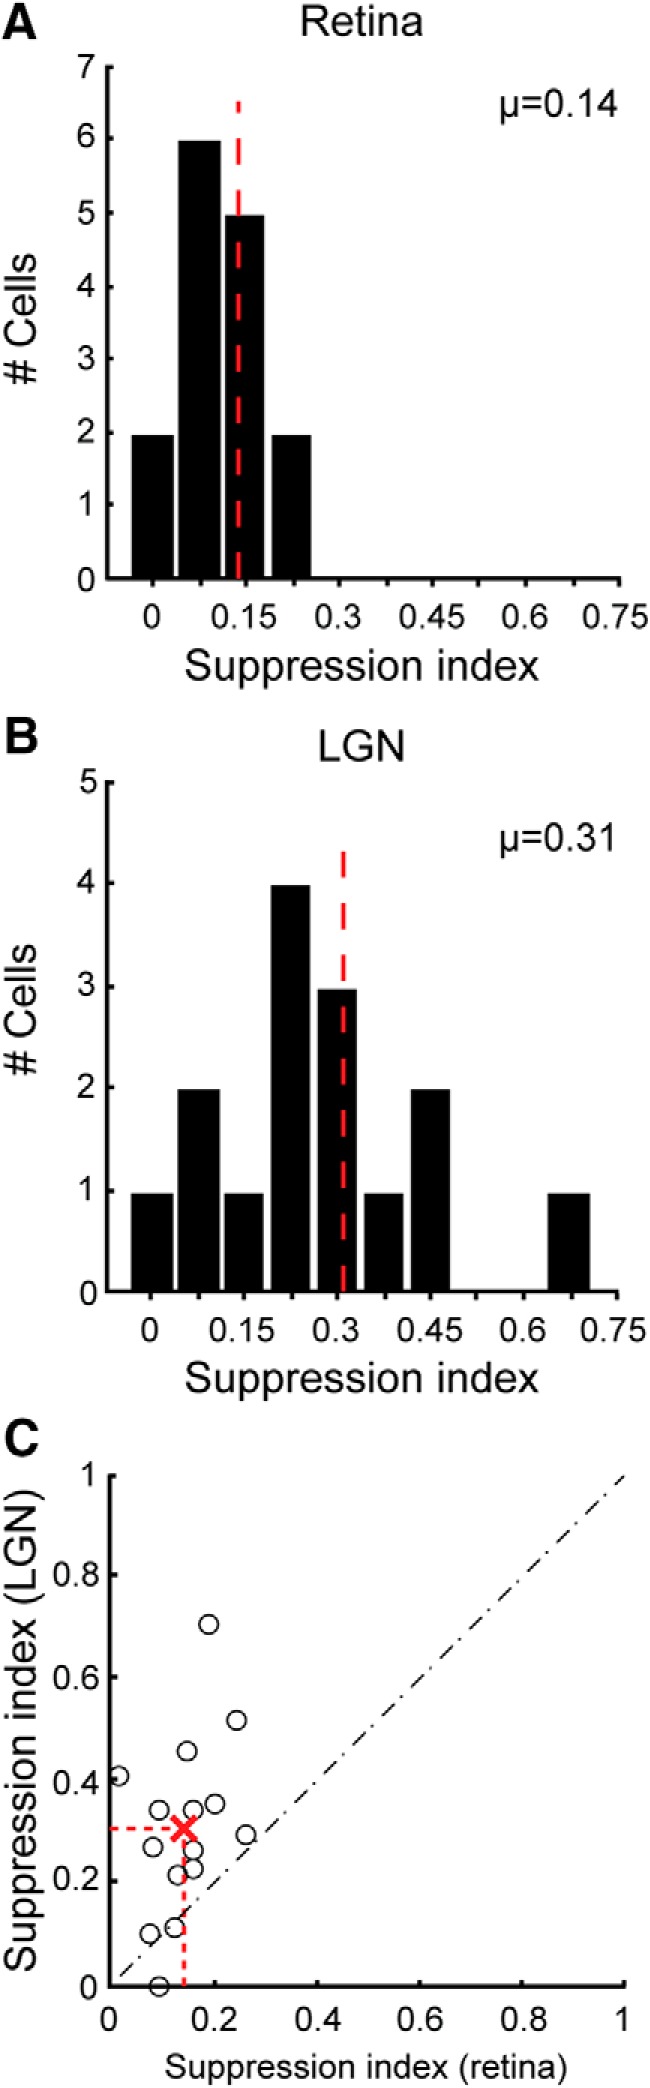
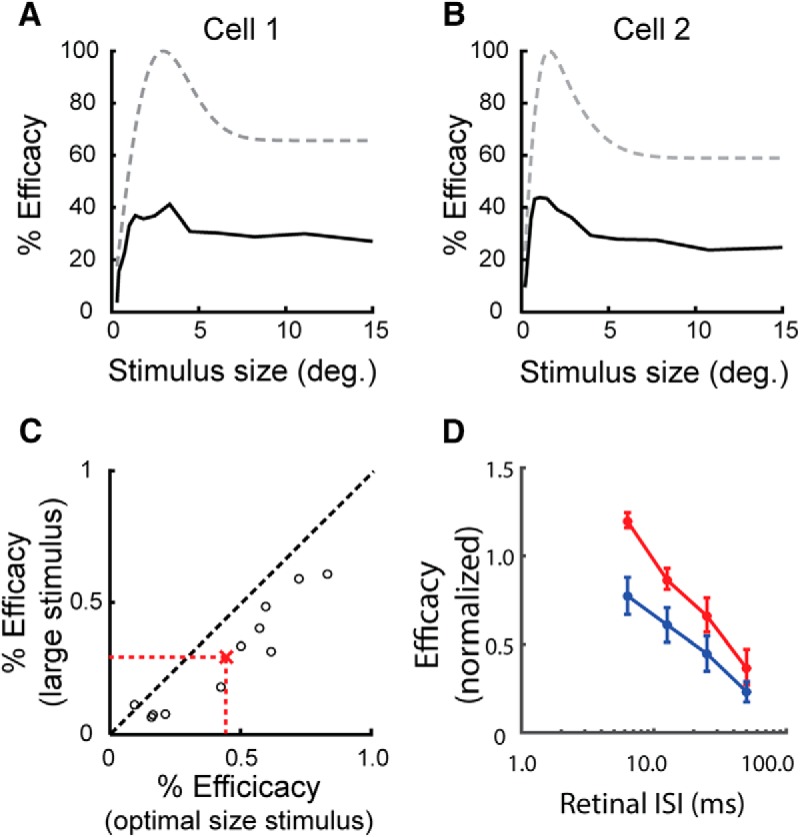
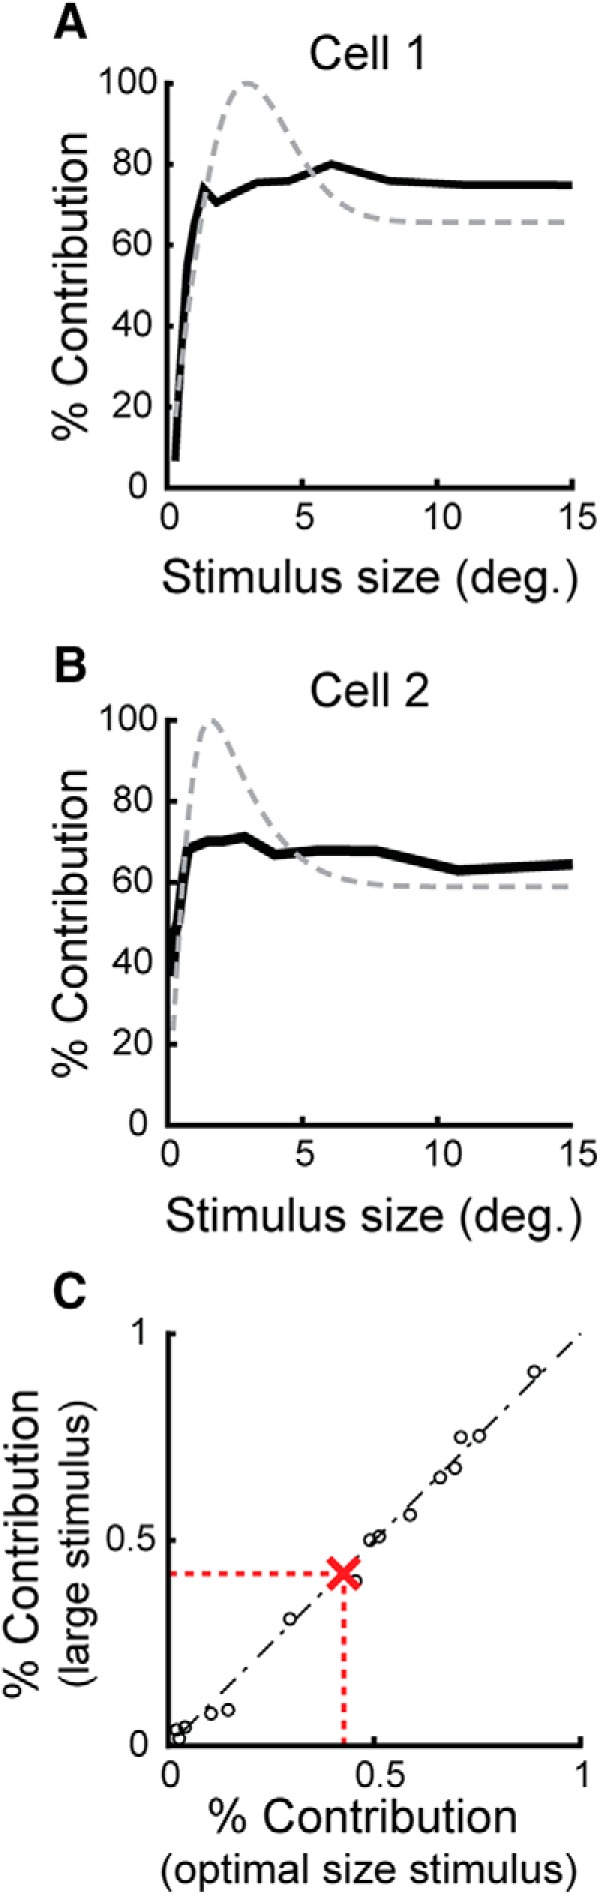
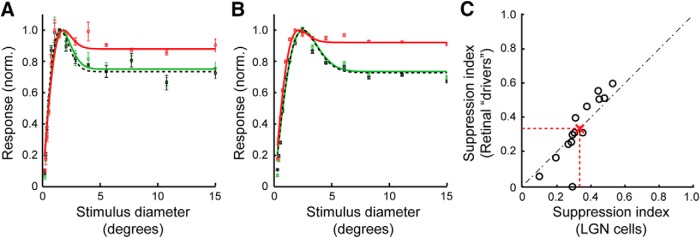
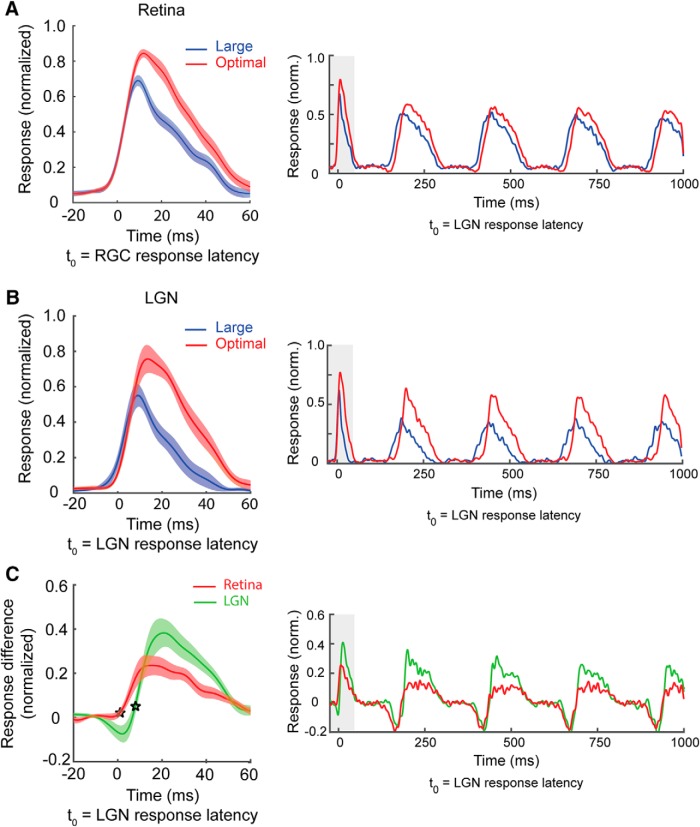
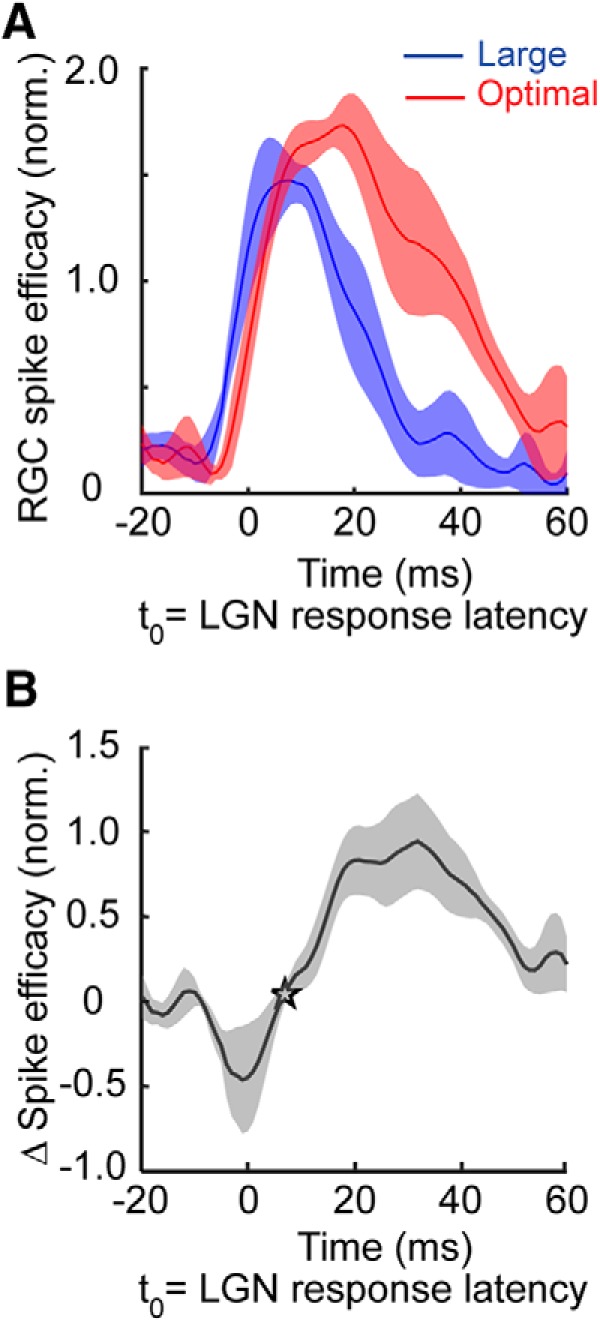
Extraclassical surround suppression is a prominent receptive field property of neurons in the lateral geniculate nucleus (LGN) of the dorsal thalamus, influencing stimulus size tuning, response gain control, and temporal features of visual responses. Despite evidence for the involvement of both retinal and nonretinal circuits in the generation of extraclassical suppression, we lack an understanding of the relative roles played by these pathways and how they interact during visual stimulation. To determine the contribution of retinal and nonretinal mechanisms to extraclassical suppression in the feline, we made simultaneous single-unit recordings from synaptically connected retinal ganglion cells and LGN neurons and measured the influence of stimulus size on the spiking activity of presynaptic and postsynaptic neurons. Results show that extraclassical suppression is significantly stronger for LGN neurons than for their retinal inputs, indicating a role for extraretinal mechanisms. Further analysis revealed that the enhanced suppression can be accounted for by mechanisms that suppress the effectiveness of retinal inputs in evoking LGN spikes. Finally, an examination of the time course for the onset of extraclassical suppression in the LGN and the size-dependent modulation of retinal spike efficacy suggests the early phase of augmented suppression involves local thalamic circuits. Together, these results demonstrate that the LGN is much more than a simple relay for retinal signals to cortex; it also filters retinal spikes dynamically on the basis of stimulus statistics to adjust the gain of visual signals delivered to cortex.

Significance statement: The lateral geniculate nucleus (LGN) is the gateway through which retinal information reaches the cerebral cortex. Within the LGN, neuronal responses are often suppressed by stimuli that extend beyond the classical receptive field. This form of suppression, called extraclassical suppression, serves to adjust the size tuning, response gain, and temporal response properties of neurons. Given the important influence of extraclassical suppression on visual signals delivered to cortex, we performed experiments to determine the circuit mechanisms that contribute to extraclassical suppression in the LGN. Results show that suppression is augmented beyond that provided by direct retinal inputs and delayed, consistent with polysynaptic inhibition. Importantly, these mechanisms influence the effectiveness of incoming retinal signals, thereby filtering the signals ultimately conveyed to cortex.

Keywords: V1; corticogeniculate; receptive field; spatial; temporal; thalamus.


Figures

Figure 1.
Figure 1.
Receptive fields, cross-correlograms, and area summation response functions for two pairs of simultaneously recorded RGCs and LGN neurons that met the criteria for a monosynaptic connection. A, B, White noise receptive field maps on an off-center pair of cells (A) and an on-center pair of cells (B). In both cases, receptive fields are extremely similar in their size and spatial location. In each receptive field map, red codes for on responses and blue for off responses; pixel brightness indicates the strength of response. Scale bar indicates 1° of visual angle. C, D, Cross-correlograms showing the relationship in spiking activity between the cells shown in A and B during visual stimulation with a drifting sinusoidal grating (see Materials and Methods). Retinal spikes are set to time 0 and data points show the occurrence of LGN responses relative to retinal spikes. Unshuffled and shuffled correlations are indicated in black and red, respectively. The abrupt, short latency peaks in the unshuffled cross-correlograms that rise above the shuffled correlogram indicates that the LGN neurons often fired a spike in response to a retinal spike. E, F, Area summation response functions corresponding to the same pair of cells shown in the overlying panels. Cells were excited with expanding patches of drifting gratings (see Materials and Methods). For both pair of cells, the LGN neuron (black trace) shows greater extraclassical suppression to large stimuli than the does the simultaneously recorded RGC (gray trace). Error bars indicate SEM.
Figure 2.
Figure 2.
Extraclassical surround suppression is stronger in LGN neurons than in the RGCs that supply them. A, B, Histograms showing the distribution of SI values for the simultaneously RGCs and LGN neurons that met the criteria for monosynaptic connections (see Materials and Methods). Larger values indicate greater suppression. SI values were significantly greater for LGN neurons than for RGCs (SI: LGN neurons = 0.31 ± 0.05; RGCs = 0.14 ± 0.02; p < 0.002, unpaired Student's t test). Dashed red lines indicate mean values. C, Scatterplot showing the relationship between SI values for each of the 15 simultaneously recorded cell pairs. Red “X” and dashed red line indicate mean values.
Figure 3.
Figure 3.
Influence of stimulus size on retinal spike efficacy. A, B, Plots showing the relationship between stimulus size and the efficacy of retinogeniculate communication (black traces), where efficacy is the percentage of retinal spikes that evoked an LGN spike, for two representative pairs of RGCs and LGN neurons. For both cell pairs, efficacy peaks rapidly and then decreases as stimuli extended into the extraclassical receptive field. For reference, the area summation response functions of the LGN neurons are represented as gray traces. C, Scatterplot showing the relationship between efficacy values calculated when cells were excited with an optimal size stimulus and a large stimulus extending into the extraclassical surround. On average, efficacy decreased with large stimuli. D, ISI efficacy functions for optimal and large stimulus responses. For each ISI, retinal spikes are less effective in evoking an LGN response when evoked by a large stimulus compared with an optimal size stimulus.
Figure 4.
Figure 4.
Influence of stimulus size on retinal spike contribution. Plots show the relationship between stimulus size and the contribution of retinal spikes in evoking an LGN response (black traces), in which contribution is the percentage of LGN spikes that were evoked by the simultaneously recorded RGC. Cell pairs in A and B are the same as those in Figure 3, A and B. The gray traces show the area summation response function of the simultaneously recorded LGN neuron. C, Unlike efficacy, contribution values remain constant as stimuli extend into the extraclassical receptive field, an effect seen across cell pairs.
Figure 5.
Figure 5.
Extraclassical suppression in the LGN can be accounted for by a selective filtering of retinal spikes. A, B, Normalized area summation response functions corresponding to different categories of spikes produced by two representative pairs of synaptically connected RGCs and LGN neurons. The red, green, and dashed black traces show response functions calculated from all of the RGC's spikes, only the retinal spikes that were successful (i.e., drivers) in evoking LGN responses, and all LGN spikes, respectively. For both pairs of cells, successful retinal spikes show the same degree of extraclassical suppression as the postsynaptic LGN neuron. C, Scatterplot showing the similarity between SI values for successful retinal spikes versus all LGN spikes for each cell pair in the sample. The red “X” and dashed lines indicate mean values.
Figure 6.
Figure 6.
Extraclassical suppression emerges early in retinal and geniculate responses. A, Population RGC temporal response profile calculated from the first cycle of a 4 Hz drifting sine-wave grating (starting phase set to each cell's preferred phase). Red curve shows the time course of responses to an optimal size grating stimulus; blue curve shows the time course of responses to a large grating stimulus. The timing of responses is shown relative to t(0), which is the response latency of the RGCs when stimulated with an optimal size stimulus. RGC response latency was calculated separately for each cell. Shaded area corresponds to 95% confidence intervals. B, Population LGN temporal response profile (details the same as in A). t(0) is the LGN response latency of the LGN cells to an optimal size stimulus. C, Difference curves (optimal − large) for the RGCs (red) and LGN neurons (green). Stars indicate the suppression latencies for the RGCs and LGN neurons. t(0) is the LGN response latency for optimal size stimuli.
Figure 7.
Figure 7.
Temporal dynamics of retinal spike efficacy illustrate the augmentation of extraclassical suppression in the LGN. A, Retinal spike efficacy as a function of time. Data points correspond to the time of individual retinal spikes relative to t(0), which represents LGN response latency to an optimal size stimulus. Efficacy values were normalized to the mean value separately for each RGC and then averaged to yield population curves. Red curve corresponds to the efficacy values of cell pairs stimulated with an optimal size stimulus; blue curve corresponds to the efficacy values of cell pairs stimulated with a large stimulus. B, Size-dependent efficacy differences as a function of time (optimal size efficacy − large size efficacy). Star indicates the earliest time after response onset that retinal spike efficacy is significantly less for large size stimuli compared with optimal size stimuli.

References

    1. Alitto HJ, Usrey WM. Origin and dynamics of extraclassical suppression in the lateral geniculate nucleus of the macaque monkey. Neuron. 2008;57:135–146. doi: 10.1016/j.neuron.2007.11.019. - DOI - PMC - PubMed
    1. Alitto HJ, Usrey WM. Surround suppression and temporal processing of visual signals. J Neurophysiol. 2015a;113:2605–2617. doi: 10.1152/jn.00480.2014. - DOI - PMC - PubMed
    1. Alitto HJ, Usrey WM. Dissecting the dynamics of corticothalamic feedback. Neuron. 2015b;86:605–607. doi: 10.1016/j.neuron.2015.04.016. - DOI - PubMed
    1. Alitto HJ, Weyand TG, Usrey WM. Distinct properties of stimulus-evoked bursts in the lateral geniculate nucleus. J Neurosci. 2005;25:514–523. doi: 10.1523/JNEUROSCI.3369-04.2005. - DOI - PMC - PubMed
    1. Alitto HJ, Moore BD, 4th, Rathbun DL, Usrey WM. A comparison of visual responses in the lateral geniculate nucleus of alert and anaesthetized macaque monkeys. J Physiol. 2011;589:87–99. doi: 10.1113/jphysiol.2010.190538. - DOI - PMC - PubMed

Publication types

Substances