

Stochastic models of gene transcription with upstream drives: exact solution and sample path characterization
- PMID: 28053113
- PMCID: PMC5310734
- DOI: 10.1098/rsif.2016.0833
Stochastic models of gene transcription with upstream drives: exact solution and sample path characterization
Abstract
Gene transcription is a highly stochastic and dynamic process. As a result, the mRNA copy number of a given gene is heterogeneous both between cells and across time. We present a framework to model gene transcription in populations of cells with time-varying (stochastic or deterministic) transcription and degradation rates. Such rates can be understood as upstream cellular drives representing the effect of different aspects of the cellular environment. We show that the full solution of the master equation contains two components: a model-specific, upstream effective drive, which encapsulates the effect of cellular drives (e.g. entrainment, periodicity or promoter randomness) and a downstream transcriptional Poissonian part, which is common to all models. Our analytical framework treats cell-to-cell and dynamic variability consistently, unifying several approaches in the literature. We apply the obtained solution to characterize different models of experimental relevance, and to explain the influence on gene transcription of synchrony, stationarity, ergodicity, as well as the effect of time scales and other dynamic characteristics of drives. We also show how the solution can be applied to the analysis of noise sources in single-cell data, and to reduce the computational cost of stochastic simulations.
Keywords: chemical master equation; gene expression; noise; non-stationarity; stochastic models; transcription.
© 2017 The Authors.
Figures
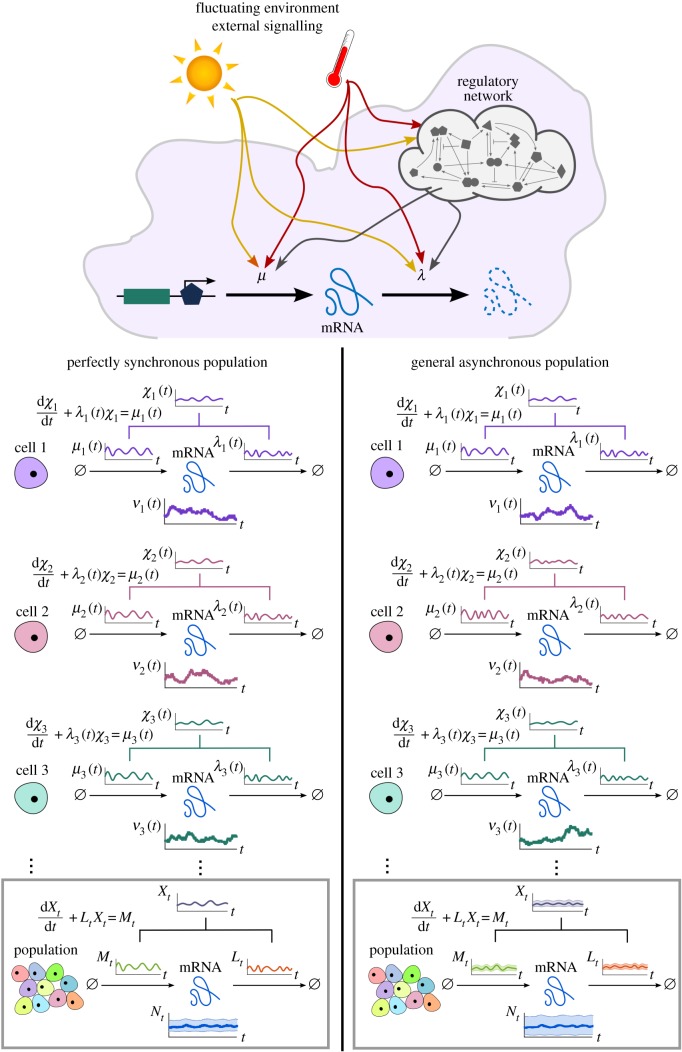
 and
and  , representing time-varying transcription and degradation rates. Both cellular drives are combined into the upstream effective drive
  , which dictates the long-term probability distribution describing the stochastic gene expression
  within each cell (2.10). When there is cell-to-cell variability in the population, the cellular drives are described by processes M and L leading to the upstream effective drive X. The probability distribution of the population corresponds to the mixture of the upstream process X and the Poissonian downstream transcriptional component, as given by (2.14). Increased synchrony in the population implies decreased ensemble variability of the random variables Mt, Lt, Xt and Nt. (Online version in colour.)
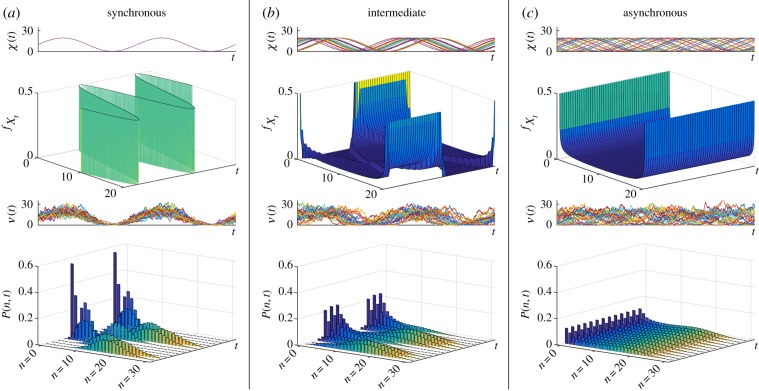
 given by equation (3.2); sample paths of the number of mRNAs, N; and the full solution of the ME P(n, t). (Online version in colour.)
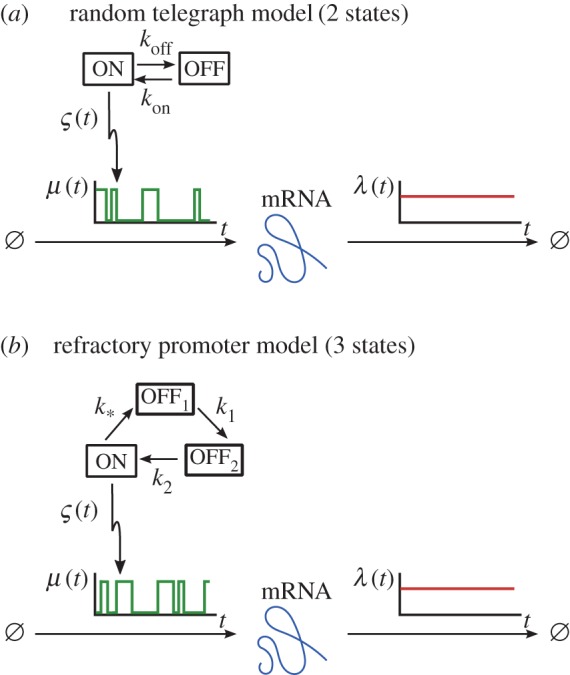
 . (Online version in colour.)
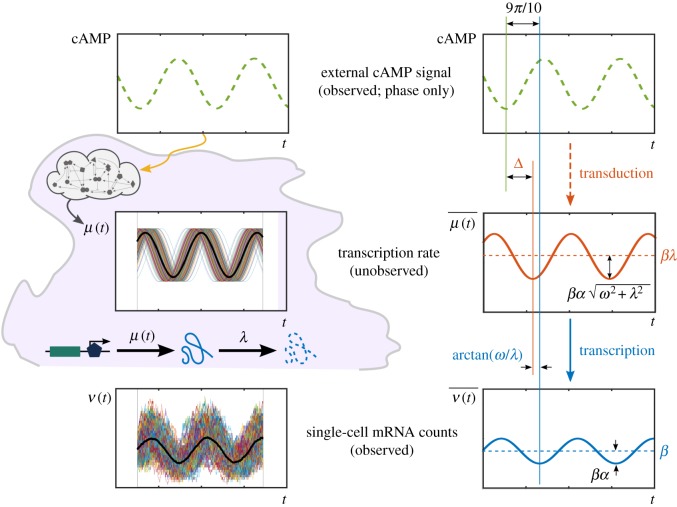
 oscillates with the same frequency as the external drive. This is consistent with equations (4.5)–(4.6), which also show that the total phase lag is the resultant of the signal transduction and transcription lags. For a signal with period T = 5 min and a gene with degradation rate λ = 0.04 min−1 [29], the transcription phase lag is
  , which corresponds to a delay of
  . Given a measured total mean lag of 9π/10, this implies that the signal transduction introduces a phase lag
  , equivalent to a delay of
  . (Online version in colour.)
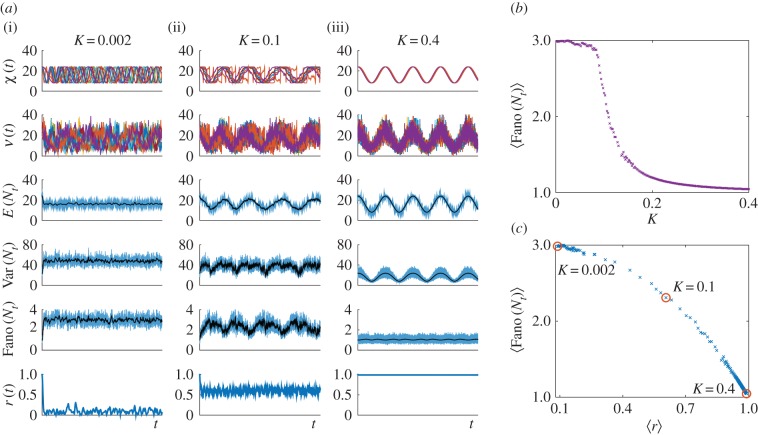
 . (b) Ensemble Fano factor (averaged over the simulated time courses) against coupling parameter
  . As K is increased, the oscillators become synchronized and the ensemble Fano factor decreases towards the Poisson value of unity. (c) Scatter plot of the ensemble Fano factor against the order parameter r(t) (both averaged over the simulated time courses). As the oscillators become synchronized (
 ), the ensemble Fano factor also approaches 1, signifying that the distribution is Poisson at all times. (Online version in colour.)
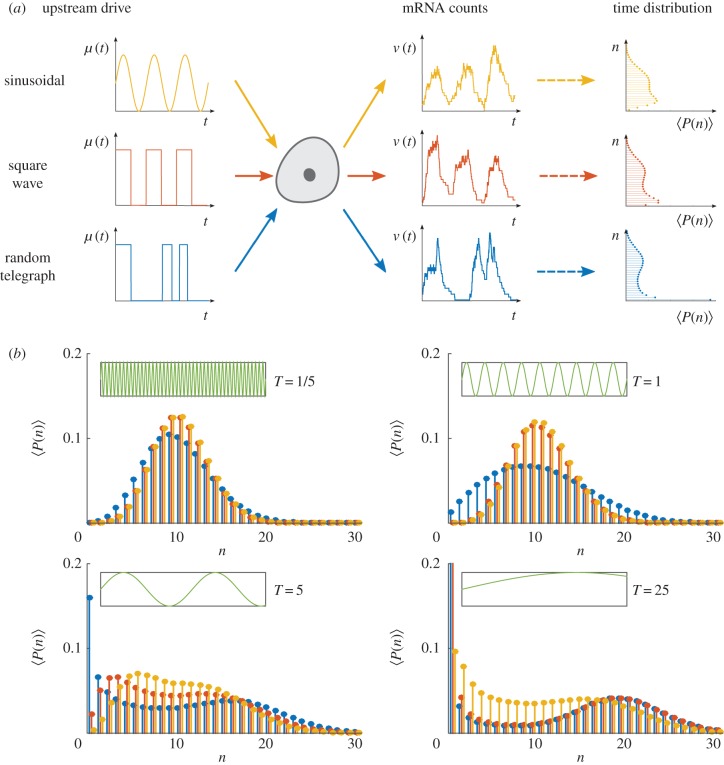
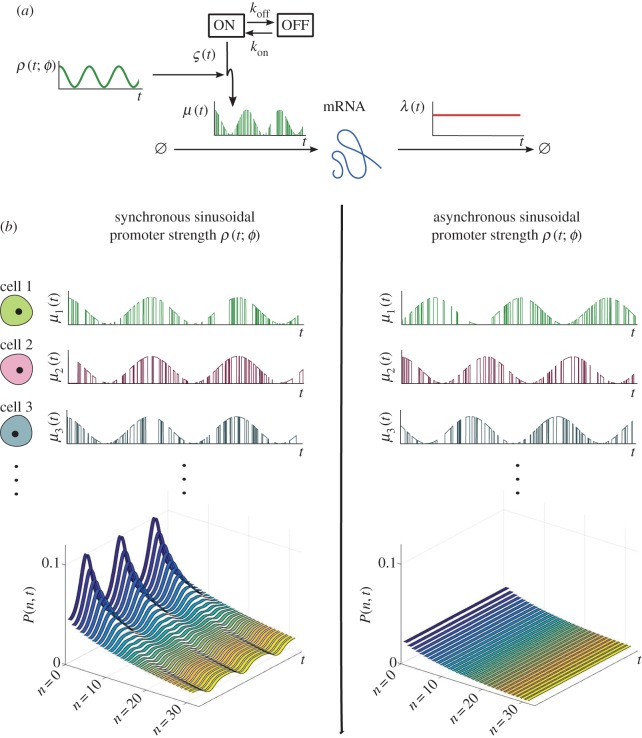
 : a sinusoidal wave with period T (yellow); a square wave with period T (red); a RT process with expected waiting time T/2 in each state (blue). For such ergodic systems, the distribution computed over time
  corresponds to the stationary distribution. (b) The distribution
  presents distinct features as the period T is varied. (Online version in colour.)
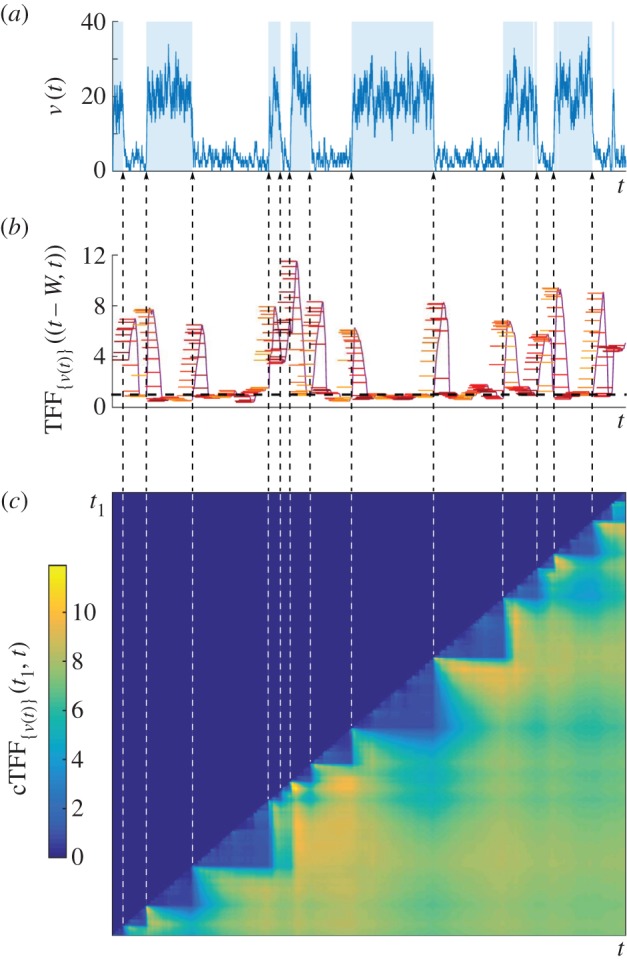
 of mRNA counts from the (leaky) RT model. The time periods when the gene is in the active state are shaded. (b) The temporal Fano factor (5.4),
 , computed over a time window W of fixed length indicated by the horizontal bars at each t. When W extends over a stationary section of the sample path, TFF is close to unity, corresponding to the Poisson distribution (black dashed line). (c) Heat map of the cTFF (5.5),
  , defined only for t ≥ t1. Note the marked step pattern corresponding to the switching times, indicated by dashed lines as a guide to the eye. (Online version in colour.)
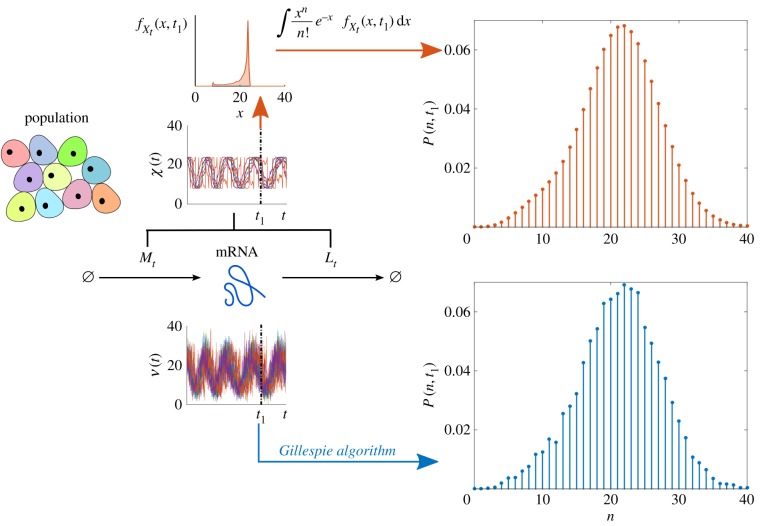
 , which is then mixed by performing the numerical integration (2.14) to obtain P(n, t) (top, red). The latter sampling through X is more regular and far less costly: CPU time via N is ≈36000 s, whereas CPU time via X is ≈0.1 s. (Online version in colour.)
Similar articles
-
Integrating single-molecule experiments and discrete stochastic models to understand heterogeneous gene transcription dynamics.Methods. 2015 Sep 1;85:12-21. doi: 10.1016/j.ymeth.2015.06.009. Epub 2015 Jun 12. Methods. 2015. PMID: 26079925 Free PMC article. Review.
-
Signatures of gene expression noise in cellular systems.Prog Biophys Mol Biol. 2009 Sep-Oct;100(1-3):57-66. doi: 10.1016/j.pbiomolbio.2009.06.003. Epub 2009 Jun 11. Prog Biophys Mol Biol. 2009. PMID: 19523977
-
Quantifying intrinsic and extrinsic variability in stochastic gene expression models.PLoS One. 2013 Dec 31;8(12):e84301. doi: 10.1371/journal.pone.0084301. eCollection 2013. PLoS One. 2013. PMID: 24391934 Free PMC article.
-
Stationary moments, distribution conjugation and phenotypic regions in stochastic gene transcription.Math Biosci Eng. 2019 Jul 3;16(5):6134-6166. doi: 10.3934/mbe.2019307. Math Biosci Eng. 2019. PMID: 31499756
-
Stochastic transcription initiation: Time dependent transcription rates.Biophys Chem. 2006 Apr 20;121(1):51-6. doi: 10.1016/j.bpc.2005.12.010. Epub 2006 Jan 27. Biophys Chem. 2006. PMID: 16442697 Review.
Cited by
-
Poisson representation: a bridge between discrete and continuous models of stochastic gene regulatory networks.J R Soc Interface. 2023 Nov;20(208):20230467. doi: 10.1098/rsif.2023.0467. Epub 2023 Nov 29. J R Soc Interface. 2023. PMID: 38016635 Free PMC article.
-
Mutational pressure by host APOBEC3s more strongly affects genes expressed early in the lytic phase of herpes simplex virus-1 (HSV-1) and human polyomavirus (HPyV) infection.PLoS Pathog. 2021 Apr 30;17(4):e1009560. doi: 10.1371/journal.ppat.1009560. eCollection 2021 Apr. PLoS Pathog. 2021. PMID: 33930088 Free PMC article.
-
Incorporating spatial diffusion into models of bursty stochastic transcription.J R Soc Interface. 2025 Apr;22(225):20240739. doi: 10.1098/rsif.2024.0739. Epub 2025 Apr 9. J R Soc Interface. 2025. PMID: 40199347 Free PMC article.
-
Transcriptional bursts explain autosomal random monoallelic expression and affect allelic imbalance.PLoS Comput Biol. 2021 Mar 9;17(3):e1008772. doi: 10.1371/journal.pcbi.1008772. eCollection 2021 Mar. PLoS Comput Biol. 2021. PMID: 33690599 Free PMC article.
-
The Chemical Fluctuation Theorem governing gene expression.Nat Commun. 2018 Jan 19;9(1):297. doi: 10.1038/s41467-017-02737-0. Nat Commun. 2018. PMID: 29352116 Free PMC article.
References
Publication types
MeSH terms
LinkOut - more resources
Full Text Sources
Other Literature Sources
Research Materials
