

A meiosis-specific Spt5 homolog involved in non-coding transcription
- PMID: 28053118
- PMCID: PMC5416832
- DOI: 10.1093/nar/gkw1318
A meiosis-specific Spt5 homolog involved in non-coding transcription
Abstract
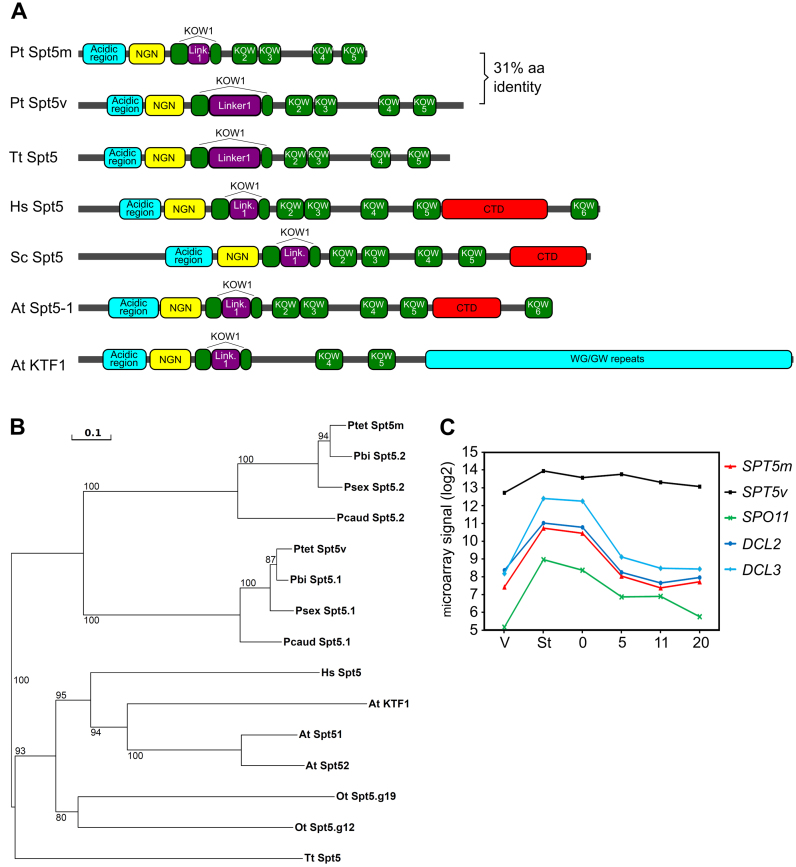
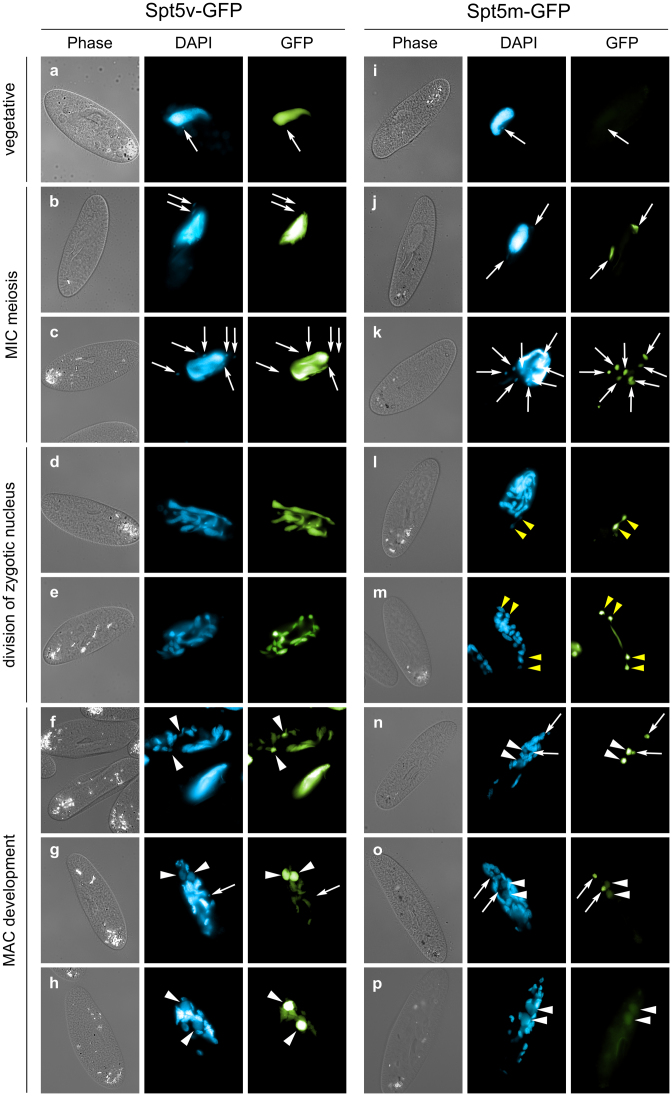
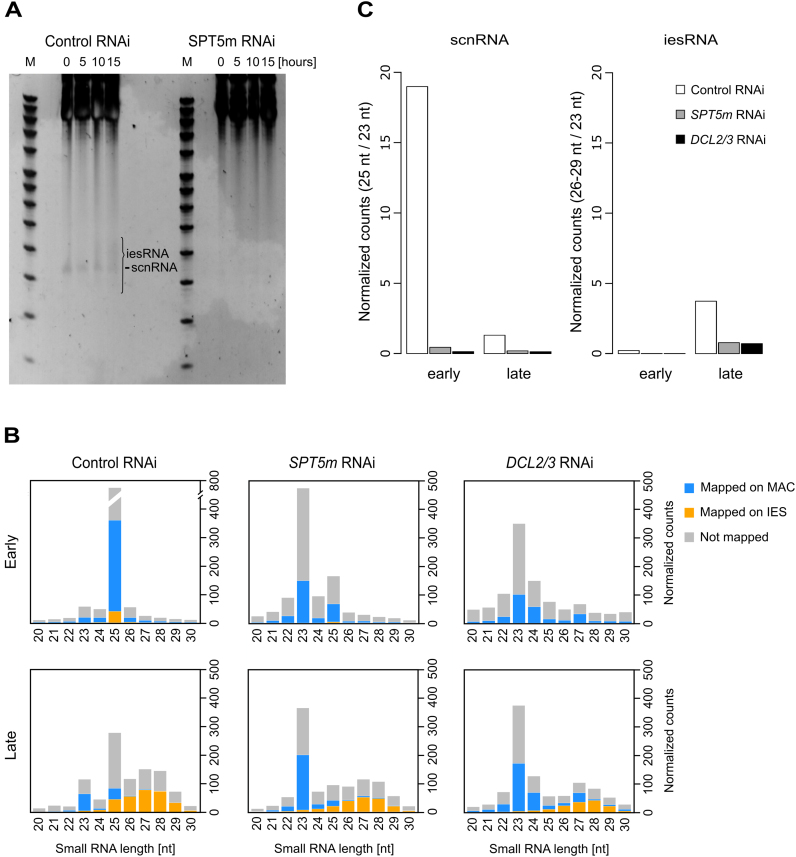
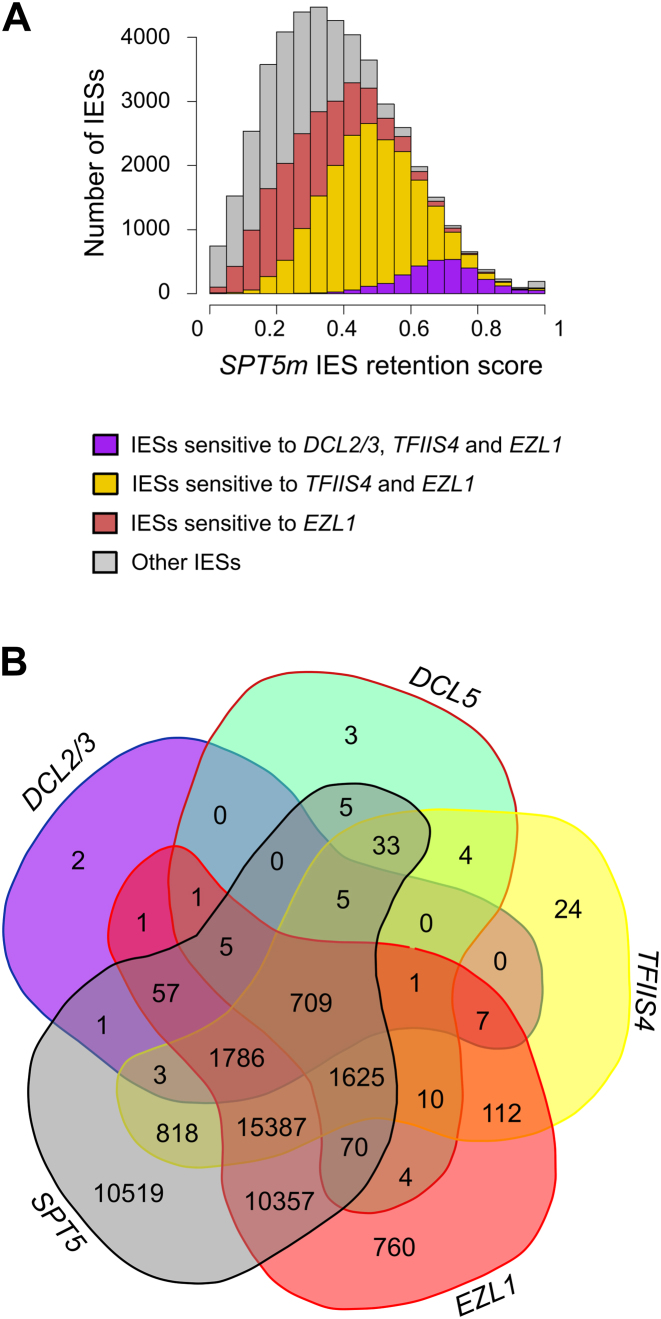
Spt5 is a conserved and essential transcriptional regulator that binds directly to RNA polymerase and is involved in transcription elongation, polymerase pausing and various co-transcriptional processes. To investigate the role of Spt5 in non-coding transcription, we used the unicellular model Paramecium tetraurelia. In this ciliate, development is controlled by epigenetic mechanisms that use different classes of non-coding RNAs to target DNA elimination. We identified two SPT5 genes. One (STP5v) is involved in vegetative growth, while the other (SPT5m) is essential for sexual reproduction. We focused our study on SPT5m, expressed at meiosis and associated with germline nuclei during sexual processes. Upon Spt5m depletion, we observed absence of scnRNAs, piRNA-like 25 nt small RNAs produced at meiosis. The scnRNAs are a temporal copy of the germline genome and play a key role in programming DNA elimination. Moreover, Spt5m depletion abolishes elimination of all germline-limited sequences, including sequences whose excision was previously shown to be scnRNA-independent. This suggests that in addition to scnRNA production, Spt5 is involved in setting some as yet uncharacterized epigenetic information at meiosis. Our study establishes that Spt5m is crucial for developmental genome rearrangements and necessary for scnRNA production.
© The Author(s) 2017. Published by Oxford University Press on behalf of Nucleic Acids Research.
Figures
Similar articles
-
The transient Spt4-Spt5 complex as an upstream regulator of non-coding RNAs during development.Nucleic Acids Res. 2022 Mar 21;50(5):2603-2620. doi: 10.1093/nar/gkac106. Nucleic Acids Res. 2022. PMID: 35188560 Free PMC article.
-
TFIIS-Dependent Non-coding Transcription Regulates Developmental Genome Rearrangements.PLoS Genet. 2015 Jul 15;11(7):e1005383. doi: 10.1371/journal.pgen.1005383. eCollection 2015 Jul. PLoS Genet. 2015. PMID: 26177014 Free PMC article.
-
Maternal noncoding transcripts antagonize the targeting of DNA elimination by scanRNAs in Paramecium tetraurelia.Genes Dev. 2008 Jun 1;22(11):1501-12. doi: 10.1101/gad.473008. Genes Dev. 2008. PMID: 18519642 Free PMC article.
-
Developmental genome rearrangements in ciliates: a natural genomic subtraction mediated by non-coding transcripts.Trends Genet. 2009 Aug;25(8):344-50. doi: 10.1016/j.tig.2009.05.007. Epub 2009 Jul 10. Trends Genet. 2009. PMID: 19596481 Review.
-
Programmed Rearrangement in Ciliates: Paramecium.Microbiol Spectr. 2014 Dec;2(6). doi: 10.1128/microbiolspec.MDNA3-0035-2014. Microbiol Spectr. 2014. PMID: 26104450 Review.
Cited by
-
Ancient Transcription Factors in the News.mBio. 2019 Feb 26;10(1):e01547-18. doi: 10.1128/mBio.01547-18. mBio. 2019. PMID: 30808693 Free PMC article. Review.
-
Massive colonization of protein-coding exons by selfish genetic elements in Paramecium germline genomes.PLoS Biol. 2021 Jul 29;19(7):e3001309. doi: 10.1371/journal.pbio.3001309. eCollection 2021 Jul. PLoS Biol. 2021. PMID: 34324490 Free PMC article.
-
Reversible fold-switching controls the functional cycle of the antitermination factor RfaH.Nat Commun. 2019 Feb 11;10(1):702. doi: 10.1038/s41467-019-08567-6. Nat Commun. 2019. PMID: 30742024 Free PMC article.
-
Six domesticated PiggyBac transposases together carry out programmed DNA elimination in Paramecium.Elife. 2018 Sep 18;7:e37927. doi: 10.7554/eLife.37927. Elife. 2018. PMID: 30223944 Free PMC article.
-
Origins and Molecular Evolution of the NusG Paralog RfaH.mBio. 2020 Oct 27;11(5):e02717-20. doi: 10.1128/mBio.02717-20. mBio. 2020. PMID: 33109766 Free PMC article.
References
-
- Kato H., Goto D.B., Martienssen R.A., Urano T., Furukawa K., Murakami Y.. RNA polymerase II is required for RNAi-dependent heterochromatin assembly. Science. 2005; 309:467–469. - PubMed
Publication types
MeSH terms
Substances
LinkOut - more resources
Full Text Sources
Other Literature Sources
Research Materials
