. 2017 Feb 15;198(4):1660-1672.
doi: 10.4049/jimmunol.1601495. Epub 2017 Jan 4.

Inactivation of Rab11a GTPase in Macrophages Facilitates Phagocytosis of Apoptotic Neutrophils

Affiliations

Inactivation of Rab11a GTPase in Macrophages Facilitates Phagocytosis of Apoptotic Neutrophils

Chunling Jiang et al. J Immunol. .

Abstract

The timely and efficient clearance of apoptotic neutrophils by macrophages (efferocytosis) is required for the resolution of inflammation and tissue repair, but the regulatory mechanisms remain unclear. In this study, we investigated the role of the small GTPase Ras-related protein in brain (Rab)11a in regulating efferocytosis, and on this basis the resolution of inflammatory lung injury. We observed that apoptotic neutrophil feeding induced a rapid loss of Rab11a activity in bone marrow-derived macrophages and found that depletion of Rab11a in macrophages by small interfering RNA dramatically increased the phagocytosis of apoptotic neutrophils compared with control cells. Additionally, overexpression of wild-type Rab11a inhibited macrophage efferocytosis, whereas overexpression of dominant-negative Rab11a (Rab11a S25N) increased the clearance of apoptotic neutrophils. Rab11a knockdown also increased the surface level of CD36 in macrophages, but it reduced cell surface expression of a disintegrin and metalloproteinase (ADAM) 17. Depletion of ADAM17 rescued the decreased surface CD36 expression found in macrophages overexpressing wild-type Rab11a. Also, blockade of CD36 abolished the augmented efferocytosis seen in Rab11a-depleted macrophages. In mice challenged with endotoxin, intratracheal instillation of Rab11a-depleted macrophages reduced neutrophil count in bronchoalveolar lavage fluid, increased the number of macrophages containing apoptotic neutrophils, and prevented inflammatory lung injury. Thus, Rab11a inactivation in macrophages as a result of apoptotic cell binding initiates phagocytosis of apoptotic neutrophils via the modulation of ADAM17-mediated CD36 cell surface expression. Our results raise the possibility that inhibition of Rab11a activity in macrophages is a promising strategy for activating the resolution of inflammatory lung injury.


Figures

Figure 1
Figure 1. Depletion of Rab11a enhances macrophage phagocytosis of apoptotic PMNs
J774A.1 macrophages (A) and BMDMs (B, C) were transfected with scrambled (Sc) or Rab11a siRNA (si). At 48 h post siRNA transfection, the transfected macrophages were labelled with CellTracker™ Green and incubated with CellTracker™ Red-labelled apoptotic PMNs (A, B) at 1:10 ratio for 2 h. The cells were then mounted on a slide and analyzed by fluorescent microscopy. Scale bars, 10 μm. (A) Rab11a knockdown increased the phagocytosis of apoptotic PMNs in J774A.1 macrophages. Left, Rab11a protein expression in macrophages at 48 h post siRNA transfection; Middle, representative fluorescent images showing macrophages engulfing apoptotic PMNs; Right, phagocytic index based on the fluorescent images. (B) Rab11a knockdown increased the phagocytosis of apoptotic PMNs in BMDMs. Left, Rab11a protein expression in BMDMs at 48 h post siRNA transfection; Middle, representative fluorescent images macrophages engulfing an apoptotic PMNs; Right, phagocytic index based on the fluorescent images. (C) Rab11a knockdown decreased the phagocytosis of IgG-opsonized fluorescent latex beads in BMDMs. The transfected BMDMs were labelled with CellTracker™ Red and incubated with FITC-labelled, IgG-opsonized latex beads (green) for 20 min. The cells were then mounted on a slide and analyzed by fluorescent microscopy. Left, representative fluorescent images showing macrophages engulfing IgG-opsonized latex beads; Right, phagocytic index based on the fluorescent images. Scale bars, 10 μm. Data were obtained from three independent cultures, each performed in triplicate. Each bar represents the mean ± SEM (n=3). Statistical significance was calculated by Student's t-test (A, B) or two-way ANOVA followed by Student's t-test (C). *P<0.05 vs. Sc siRNA groups.
Figure 2
Figure 2. Rab11a Inactivation promotes clearance of apoptotic PMNs
(A) Time-dependent Rab11a inactivation in BMDMs in response to apoptotic PMNs (ACs) feeding. BMDMs were co-cultured with apoptotic PMNs at 1:10 ratio for ∼15 min. Lysates from macrophages were analyzed by Rab11a Activation Assay Kit. Left, pull-down experiment showing the content of Rab11-GTP in BMDMs stimulated with ACs; Right, quantification of three independent experiments is provided. (B) Endogenous and exogenous expression of Rab11a protein in BMDMs analyzed by Western blots. BMDMs were transfected with vector, dominant negative (S25N), or wild type (WT) Rab11a cDNA. (C) Representative fluorescent imaging of phagocytosis of ACs. The transfected BMDMs were labeled with CellTracker™ Green. After incubation of macrophages with CellTracker™ Red-labelled apoptotic PMNs for 2 h, macrophage efferocytosis was visualized using fluorescence microscopy. Scale bar, 10 μm. (D) Phagocytic index. Data were obtained from three independent cultures, each performed in triplicate, and expressed as mean ± SEM. The P value was calculated by one-way ANOVA followed by Student's t-test. *P<0.05 vs. control (A) or vector group (D); †P <0.05 vs. 5 min group (A) or S25N group (D); ‡ P <0.05 vs. 10 min group (A).
Figure 3
Figure 3. Rab11a regulates macrophage cell surface expression of CD36
(A) Rab11a knockdown increased surface expression of CD36. BMDMs were transfected with a scrambled (Sc) or Rab11a siRNA. At 48 h post transfection, cells were stained with an anti-Rab11a Ab (green) and an anti-CD36 Ab (red) targeting an extracellular epitope, and cells were left intact (not permeabilized). Left, representative confocal images showing surface expression of CD36 by confocal microscopy; Right, quantitative fluorescence intensity of membrane CD36 expression. n=4. *P<0.05 vs Sc si control group. Scale bar, 10 μm. (B). Effects of Rab11a activation on surface expression. BMDMs were transfected with vector, dominant negative (S25N), or wild type (WT) Rab11a cDNA. At 48 h post transfection, cells were stained with an anti-CD36 Ab. Left, endogenous and exogenous expression of Rab11a protein in BMDMs analyzed by Western blots; Middle, surface expression of CD36 was assessed by flow cytometry; Right, quantitative data showing changes in mean fluorescent intensity (MFI) of CD36. n=4. * P<0.05 vs. vector group. † P<0.05 vs. S25N group. (C) CD36 blockade abolished Rab11a-depletion-mediated increase in phagocytosis of apoptotic PMNs. At 48 h after transfection of BMDMs with Sc siRNA or Rab11a siRNA, cells were treated with CD36 blocking Ab (20 μg/ml) or isotype Ab for 2 h. Macrophages were then labelled with CellTracker™ Green and co-incubated with CellTracker™ Red labelled apoptotic PMNs for 2 h. Phagocytosis of apoptotic PMNs was visualized using fluorescence microscopy. Left, Rab11a protein expression in macrophages at 48 h post siRNA transfection; Middle, representative fluorescent images showing macrophages engulfing apoptotic PMNs; Right, phagocytic index based on the fluorescent images. Scale bar, 10 μm. n=4. Statistical significance was calculated by Student's t-test (A) or one-way ANOVA followed by Student's t-test (B, C). * P<0.05 vs. Sc siRNA+Isotype groups, † P<0.05 vs. corresponding Isotype group.
Figure 4
Figure 4. Rab11a regulates macrophage cell surface ADAM17 expression
(A). Rab11a colocalized with ADAM17 in BMDMs. BMDMs were immunostained with anti-Rab11a (green) and anti-ADAM17 (red) Abs. Representative confocal images show colocalization (yellow) of Rab11a and ADAM17. Scale bar, 10 μm. (B) Rab11a associated with ADAM17 in BMDMs. BMDMs were incubated with apoptotic PMNs (ACs) for 15 min, immunoprecipitated (IP) with Rab11a, and immunoblotted (IB) with an anti–ADAM17 Ab. (C). Effects of Rab11a knockdown on cell surface expression of ADAM17. BMDMs were transfected with a scrambled (Sc) siRNA or Rab11a siRNA. Left, Rab11a protein expression in macrophages at 48 h post siRNA transfection; Middle, surface expression of ADAM17 was analyzed by flow cytometry; Right, quantitative data showing changes in mean fluorescent intensity (MFI) of ADAM17. n=4. Statistical significance was calculated by one-way ANOVA followed by Student's t-test. *P<0.05 vs. Isotype groups, †P<0.05 vs. Sc siRNA group. (D). Effects of Rab11a depletion on subcellular localization of ADAM17 in BMDMs. Top (left), immunoblot showing the levels of ADAM17 expression on cell surface; Top (right), immunoblot showing the levels of ADAM17 expression in cytosolic fraction; Bottom, immunoblot showing the total levels of ADAM17 expression. (E) Protein quantification by densitometry. Bar graph shows the relative abundance of ADAM17 protein (normalized to that of loading controls) from 3 independent experiments. Statistical significance was calculated by Student's t-test. *P<0.05 vs. corresponding Sc siRNA groups.
Figure 5
Figure 5. Rab11a deletion increase surface levels of CD36 through inhibiting ADAM17 trafficking
BMDMs were transfected with scrambled (Sc) or ADAM17 siRNA and plasmids encoding vector or GFP-tagged wild type (WT) Rab11a. (A) Protein expression of endogenous Rab11a and ADAM17 and exogenous expression of Rab11a protein in BMDMs were analyzed by Western blots. (B) Surface expression of CD36 was assessed by flow cytometry. (C) Quantitative data showing changes in mean fluorescent intensity (MFI) of CD36. n=4. Statistical significance was calculated by one-way ANOVA followed by Student's t-test. * P<0.05 vs. control groups (Vector + Sc). † P<0.05 vs. corresponding Sc group (Rab11a WT).
Figure 6
Figure 6. Role of macrophage Rab11a in resolution of lung inflammation and injury
(A) Experimental protocols of induction and time course of resolution of lung inflammation post-LPS challenge in wild type mice. Following depletion of alveolar macrophages with clodronate liposome (CLOD), mice were intratracheally instilled with LPS. BMDMs isolated from donor mice were cultured and transfected with a scramble siRNA (Sc) or Rab11a siRNA. After 48 h, the efficiency of transfection was evaluated by Western blot analysis. BMDMs treated with a Sc siRNA or Rab11a siRNA were i.t. injected into alveolar macrophages-depleted mice. Resolution of lung inflammatory injury was evaluated at d 1, 3, 5, 7 and 10 post LPS challenge as described in Materials and Methods. n = 6 animals/group/time point. (B) Neutrophil (PMN) counts in the BAL fluid. (C) PMN sequestration in lungs as assessed by MPO activity. (D) Pulmonary vascular protein permeability as determined by protein concentration of BAL fluid. (E) Pulmonary edema formation measured by wet-to-dry (W/D) lung weight ratio. (F) Histological analysis of lung tissue by hematoxylin and eosin staining (40× magnification). (G) Histopathological mean lung injury scores from low-power (20×) sections. Measurements were performed in triplicate for data analysis. Statistical significance was calculated by two- (B-E) or one-way (G) ANOVA followed by Tukey's multiple comparison tests. *P<0.05 vs. corresponding CLOD+LPS groups; †P<0.05 vs. corresponding Sc siRNA groups; ‡ P<0.05 vs. corresponding LPS groups.
Figure 7
Figure 7. Rab11 depletion increases phagocytosis of apoptotic bodies or PMNs by alveolar macrophages
Experimental protocols of induction and time course of resolution of lung inflammation post-LPS challenge are shown as Fig. 6A. Alveolar macrophage-depleted mice were intratracheally administered with vehicle (PBS, Control), or BMDMs transfected with scrambled (Sc) or Rab11a siRNA. (A) Representative photomicrographs of cytospin preparations of BAL cells 2 d after injection of BMDMs. Arrows indicate apoptotic bodies. Original magnification 40×. (B) Quantification of BAL fluid macrophages (MΦ) containing apoptotic bodies. n = 6 / each group. *P < 0.05 vs. control group; †P < 0.05 vs. Sc si group. (C) Effects of Rab11a depletion on phagocytosis of apoptotic PMNs in vivo following LPS challenge. 1.0 × 10⁷ pHrodo™ Red (SE)-labeled apoptotic PMNs was intratracheally instilled 2 d following CellTracker™ Green-labeled BMDM transplantation (2.0 × 10⁶). At 3 h after instillation of apoptotic PMNs, BAL was performed, washed, and analyzed by flow cytometry (pH to 10 with 0.003 M sodium carbonate). Representative flow cytometric dot plots demonstrating changes in the proportion of macrophages engulfing pHrodo-stained apoptotic PMNs are shown. (D) Phagocytic index was calculated by average percent of macrophage containing apoptotic PMNs. n = 6 / each group. Measurements were performed in triplicate for data analysis. Statistical significance was calculated by one-way ANOVA followed by Student's t-test. *P < 0.05 vs. control group; †P<0.05 vs. Sc si group.
Figure 8
Figure 8. Macrophage Rab11a regulates the release of cytokines
Experimental protocols of induction and time course of resolution of lung inflammation post-LPS challenge are shown as Fig. 6A. (A-D) Levels of TNF-α (A) and IL-6 (B), TGF-β1 (C), and IL-10 (D) in BAL fluid measured by ELISA. n = 6 /each group. Measurements were performed in triplicate for data analysis. Statistical significance was calculated by two-way ANOVA followed by Tukey's multiple comparison tests. *P < 0.05 vs. corresponding CLOD+LPS groups; †P < 0.05 vs. corresponding Sc siRNA groups; ‡ P<0.05 vs. corresponding LPS groups. CLOD, clodronate liposome.
Figure 9
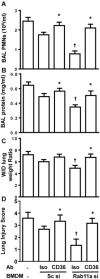
Figure 9. CD36 blockade abolishes Rab11a depletion-induced resolution of lung inflammation
Experimental protocols of induction and time course of resolution of lung inflammation post-LPS challenge are shown as Fig. 6A. CD36-blocking or isotype control (Iso) Ab was intravenously injected while BMDMs were i.t. admonished into the lung. At d 2 after injection of BMDMs, BAL and lung tissue was collected and tested. (A) PMNs in BAL fluid were enumerated to evaluate lung airspace inflammation. (B) Pulmonary vascular protein permeability as determined by protein concentration of BAL fluid. (C) Pulmonary edema formation measured by wet-to-dry (W/D) lung weight ratio. (D) Histopathological mean lung injury scores from low-power (20×) sections. n = 6 animals /group. Measurements were performed in triplicate for data analysis. Statistical significance was calculated by one-way ANOVA followed by Student's t-test. *P<0.05 vs. corresponding Iso group. †P<0.05 vs. Sc+Iso group.
Figure 10
Figure 10. Model of Rab11a in regulating of phagocytosis of apoptotic PMNs

Similar articles

Cited by

References

    1. Rock KL, Lai JJ, Kono H. Innate and adaptive immune responses to cell death. Immunol Rev. 2011;243:191–205. - PMC - PubMed
    1. Ortega-Gomez A, Perretti M, Soehnlein O. Resolution of inflammation: an integrated view. EMBO Mol Med. 2013;5:661–674. - PMC - PubMed
    1. Korns D, Frasch SC, Fernandez-Boyanapalli R, Henson PM, Bratton DL. Modulation of macrophage efferocytosis in inflammation. Front Immunol. 2011;2:57. - PMC - PubMed
    1. Voll RE, Herrmann M, Roth EA, Stach C, Kalden JR. Immunosuppressive effect of apoptotic cells. Nature. 1997;390:350–351. - PubMed
    1. Fadok VA, Bratton DL, Rose DM, Pearson A, Ezekewitz RA, Henson PM. A receptor for phosphatidyiserine-specific clearance of apoptotic cells. Nature. 2000;405:85–90. - PubMed

Publication types

MeSH terms

LinkOut - more resources