

Heterogeneous effects of norepinephrine on spontaneous and stimulus-driven activity in the male accessory olfactory bulb
- PMID: 28053247
- PMCID: PMC5350266
- DOI: 10.1152/jn.00871.2016
Heterogeneous effects of norepinephrine on spontaneous and stimulus-driven activity in the male accessory olfactory bulb
Abstract
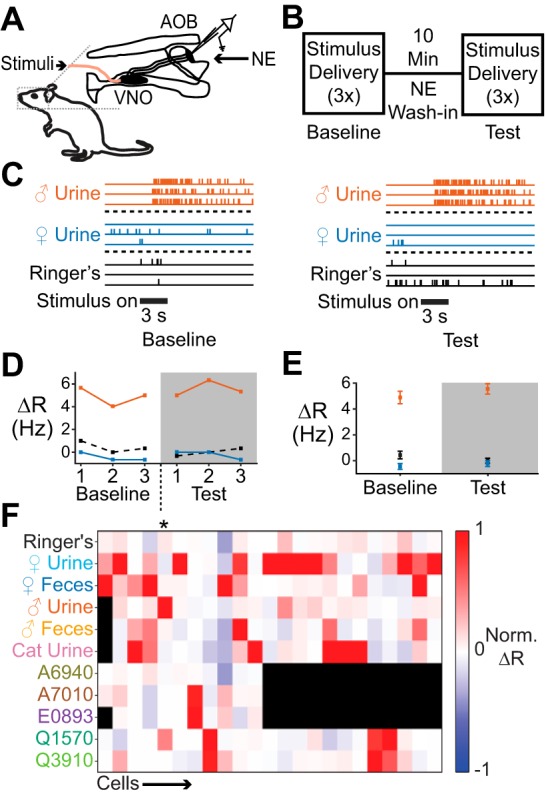
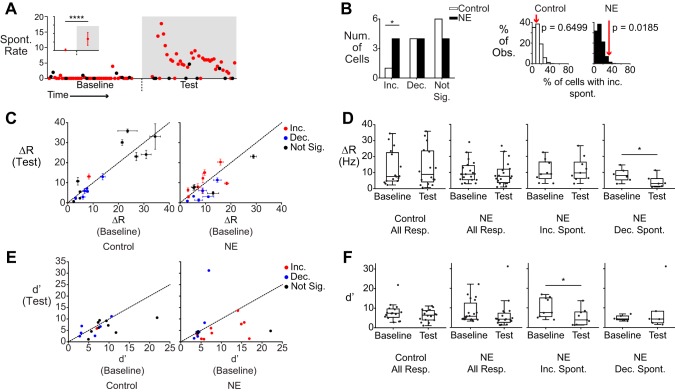
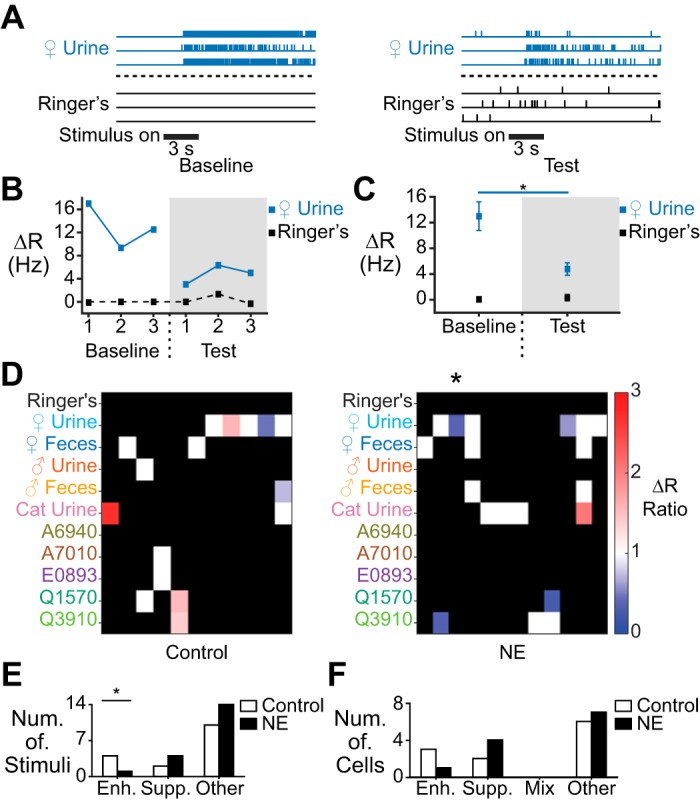
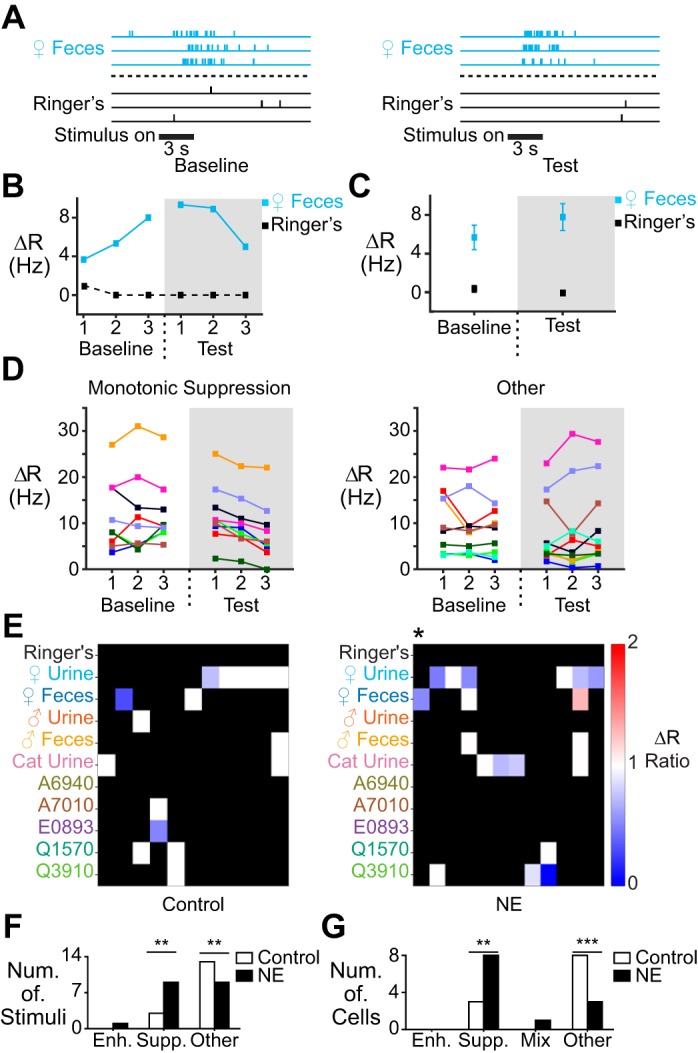
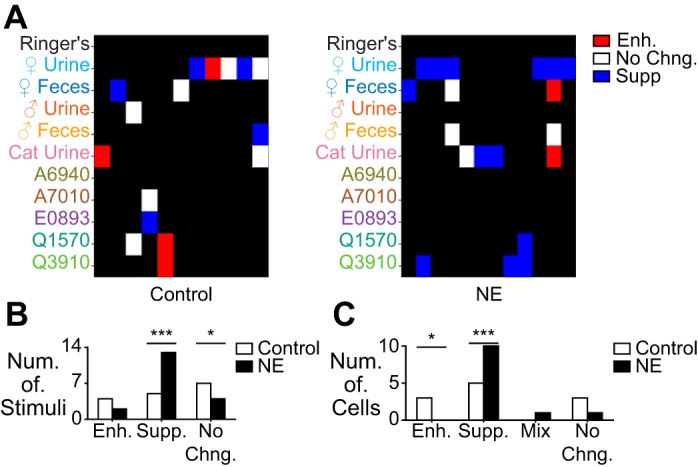
Norepinephrine (NE) release has been linked to experience-dependent plasticity in many model systems and brain regions. Among these is the rodent accessory olfactory system (AOS), which is crucial for detecting and processing socially relevant environmental cues. The accessory olfactory bulb (AOB), the first site of chemosensory information processing in the AOS, receives dense centrifugal innervation by noradrenergic fibers originating in the locus coeruleus. Although NE release has been linked to behavioral plasticity through its actions in the AOB, the impacts of noradrenergic modulation on AOB information processing have not been thoroughly studied. We made extracellular single-unit recordings of AOB principal neurons in ex vivo preparations of the early AOS taken from adult male mice. We analyzed the impacts of bath-applied NE (10 μM) on spontaneous and stimulus-driven activity. In the presence of NE, we observed overall suppression of stimulus-driven neuronal activity with limited impact on spontaneous activity. NE-associated response suppression in the AOB came in two forms: one that was strong and immediate (21%) and one other that involved gradual, stimulus-dependent monotonic response suppression (47%). NE-associated changes in spontaneous activity were more modest, with an overall increase in spontaneous spike frequency observed in 25% of neurons. Neurons with increased spontaneous activity demonstrated a net decrease in chemosensory discriminability. These results reveal that noradrenergic signaling in the AOB causes cell-specific changes in chemosensory tuning, even among similar projection neurons.NEW & NOTEWORTHY Norepinephrine (NE) is released throughout the brain in many behavioral contexts, but its impacts on information processing are not well understood. We studied the impact of NE on chemosensory tuning in the mouse accessory olfactory bulb (AOB). Electrophysiological recordings from AOB neurons in ex vivo preparations revealed that NE, on balance, inhibited mitral cell responses to chemosensory cues. However, NE's effects were heterogeneous, indicating that NE signaling reshapes AOB output in a cell- and stimulus-specific manner.
Keywords: accessory olfactory bulb; accessory olfactory system; chemical senses; information processing; norepinephrine.
Copyright © 2017 the American Physiological Society.
Figures
Similar articles
-
Paradoxically Sparse Chemosensory Tuning in Broadly Integrating External Granule Cells in the Mouse Accessory Olfactory Bulb.J Neurosci. 2020 Jul 1;40(27):5247-5263. doi: 10.1523/JNEUROSCI.2238-19.2020. Epub 2020 Jun 5. J Neurosci. 2020. PMID: 32503886 Free PMC article.
-
Stimulus-Induced Theta-Band LFP Oscillations Format Neuronal Representations of Social Chemosignals in the Mouse Accessory Olfactory Bulb.J Neurosci. 2023 Dec 13;43(50):8700-8722. doi: 10.1523/JNEUROSCI.1055-23.2023. J Neurosci. 2023. PMID: 37903594 Free PMC article.
-
Temporal Response Properties of Accessory Olfactory Bulb Neurons: Limitations and Opportunities for Decoding.J Neurosci. 2018 May 23;38(21):4957-4976. doi: 10.1523/JNEUROSCI.2091-17.2018. Epub 2018 Apr 30. J Neurosci. 2018. PMID: 29712784 Free PMC article.
-
Second messenger-mediated actions of norepinephrine on target neurons in central circuits: a new perspective on intracellular mechanisms and functional consequences.Prog Brain Res. 1991;88:351-62. doi: 10.1016/s0079-6123(08)63822-4. Prog Brain Res. 1991. PMID: 1667548 Review.
-
Cellular and network processes of noradrenergic modulation in the olfactory system.Brain Res. 2019 Apr 15;1709:28-32. doi: 10.1016/j.brainres.2018.03.008. Epub 2018 Mar 7. Brain Res. 2019. PMID: 29524435 Review.
Cited by
-
α2-Adrenergic receptor activation promotes long-term potentiation at excitatory synapses in the mouse accessory olfactory bulb.Learn Mem. 2018 Mar 15;25(4):147-157. doi: 10.1101/lm.046391.117. Print 2018 Apr. Learn Mem. 2018. PMID: 29545386 Free PMC article.
-
In vivo spontaneous activity and coital-evoked inhibition of mouse accessory olfactory bulb output neurons.iScience. 2023 Aug 7;26(9):107545. doi: 10.1016/j.isci.2023.107545. eCollection 2023 Sep 15. iScience. 2023. PMID: 37664596 Free PMC article.
-
Signal Detection and Coding in the Accessory Olfactory System.Chem Senses. 2018 Nov 1;43(9):667-695. doi: 10.1093/chemse/bjy061. Chem Senses. 2018. PMID: 30256909 Free PMC article. Review.
-
Noradrenaline modulates sensory information in mouse vomeronasal sensory neurons.iScience. 2024 Sep 2;27(10):110872. doi: 10.1016/j.isci.2024.110872. eCollection 2024 Oct 18. iScience. 2024. PMID: 39328934 Free PMC article.
-
The Bruce effect: Representational stability and memory formation in the accessory olfactory bulb of the female mouse.Cell Rep. 2022 Aug 23;40(8):111262. doi: 10.1016/j.celrep.2022.111262. Cell Rep. 2022. PMID: 36001975 Free PMC article.
References
-
- Bennett BD, Huguenard JR, Prince DA. Adrenergic modulation of GABAA receptor-mediated inhibition in rat sensorimotor cortex. J Neurophysiol 79: 937–946, 1998. - PubMed
MeSH terms
Substances
Grants and funding
LinkOut - more resources
Full Text Sources
Other Literature Sources